

Recomendados
Más contenido relacionado
Más de David Shore
Más de David Shore (20)
Último
Último (20)
09 09 22 Web 2.0 Weekly
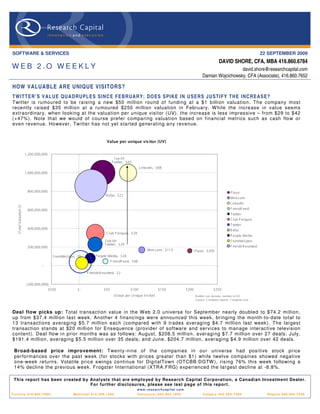
- 1. SOFTWARE & SERVICES 22 SEPTEMBER 2009 DAVID SHORE, CFA, MBA 416.860.6784 WEB 2.O WEEKLY david.shore@researchcapital.com Damian Wojcichowsky, CFA (Associate), 416.860.7652 HOW VALUABLE ARE UNIQUE VISITORS? T WIT T E R’ S V AL U E QU A D RU PL E S S IN C E F E B RU A R Y; DO E S S PI K E IN U S E R S J U ST IF Y T H E I NC R EA S E? Twitter is rumoured to be raising a new $50 million round of funding at a $1 billion valuation. The company most recently raised $35 million at a rumoured $250 million valuation in February. W hile the increase in value seems extraordinary, when looking at the valuation per unique visitor (UV), the increase is less impressive – from $29 to $42 (+47%). Note that we would of course prefer comparing valuation based on financial metrics such as cash flow or even revenue. However, Twitter has not yet started generating any revenue. Value per unique vis itor (UV) 1, 200, 000, 000 S ep 09 T witter, $42 L inkedin, $88 1, 000, 000, 000 800, 000, 000 P la xo B ebo, $22 Mint. com L inkedin (T ota l V a lua tion $) 600, 000, 000 F riendF eed T witter C lub P enguin T witter 400, 000, 000 B ebo C lub P enguin, $29 P eople Media F eb 09 S tumbleU pon T witter, $29 200, 000, 000 F riends R eunited Mint. com, $113 P la xo, $200 S tumbleU pon, $5 P eople Media , $20 F riendF eed, $48 - F riends R eunited, $2 (200, 000, 000) $(50) $- $50 $100 $150 $200 $250 (V a lue per U nique V is itor) B ubble s ize de note s numbe r of U V S ource : C ompany re ports , C ompe te .com Deal flow picks up: Total transaction value in the W eb 2.0 universe for September nearly doubled to $74.2 million, up from $37.4 million last week. Another 4 financings were announced this week, bringing the month-to-date total to 13 transactions averaging $5.7 million each (compared with 9 trades averaging $4.7 million last week). The largest transaction stands at $20 million for Ensequence (provider of software and services to manage interactive television content). Deal flow in prior months was as follows: August, $208.5 million, averaging $7.7 million over 27 deals; July, $191.4 million, averaging $5.5 million over 35 deals; and June, $204.7 million, averaging $4.9 million over 42 deals. Broad-based price improvement: Twenty-nine of the companies in our universe had positive stock price performances over the past week (for stocks with prices greater than $1) while twelve companies showed negative one-week returns. Volatile price swings continue for DigitalTown (OTCBB:DGTW ), rising 76% this week following a 14% decline the previous week. Frogster International (XTRA:FRG) experienced the largest decline at -8.8%. This report has been created b y Anal ysts that are emplo yed b y Research Capital Corporation, a Canadian Investment Dealer. For further disclosures, please see last page of this report. w w w . r e s e a rc h c a p i t a l . c o m T o ro n t o 4 1 6 . 8 6 0 . 7 6 0 0 Montreal 514.399.1500 Vancouver 604.662.1800 Calgary 403.265.7400 Regina 306.566.7550
- 2. Page 2 THE WEB 2.0 UNIVERSE Ninety public Web 2.0 companies: Our W eb 2.0 universe contains 90 companies, with a combined market cap of approximately $69 billion (Figure 1). The median market cap for the group is $49 million, with average trailing revenue of $161 million (median $54 million). The companies are also generally profitable, with a median EBITDA margin of 11.8%. On a valuation basis, the overall average is 5.4x trailing revenue (median 2.1x) and 13.2x trailing EBITDA (median 10.3x). Twenty of the companies have more than 500 employees. C omparable C ompany Analys is > Web 2.0 Trading C urrent US D Market US D L TM Total US D L TM Total E B ITDA TE V/L TM TE V/L TM C ompany Name L TM as of Ticker E xc hange C urrency HQ P ric e C ap ($m) R ev ($m) E B ITDA ($m) % R evenue E B ITDA E mployees Accelerize New Media, Inc. 6/30/2009 AC LZ OT C B B US D U nited S tates 0. 65 18. 2 4. 4 (3.7) -83. 3% 5.2x - 11 Actoz S oft C o. , Ltd. 6/30/2009 A052790 K OS E KRW S outh K orea 19, 950 142.6 107. 6 25. 6 23. 8% 1.0x 4. 3x NA AQ Interactive, Inc. 6/30/2009 3838 TS E JPY J apa n 52, 500 31. 0 64.2 (1.9) -2.9% 0.2x - NA As s ocia ted Media Holdings Inc. 6/30/2007 AS MH OT C P K US D U nited S tates 0. 01 0.6 0. 1 (2.3) NM 15. 6x - 3 B igs tring C orp. 6/30/2009 BS GC OT C B B US D U nited S tates 0. 02 1.1 0. 1 (1.5) NM 34. 6x - 4 B eta wave C orpora tion 6/30/2009 B W AV OT C B B US D U nited S tates 0. 07 2.0 9. 4 (12. 6) NM - - 51 B eyond C ommerce, Inc. 6/30/2009 B Y OC OT C B B US D U nited S tates 0. 17 7.9 11.7 (12. 8) NM 1.2x - 101 B right T hings plc 3/31/2009 AIM: B G T AIM GBP U nited K ingdom 0. 01 6.0 0. 0 (2.7) NM - - NA B roa dW ebAs ia Inc. 9/30/2008 BWBA OT C P K US D U nited S tates 0. 23 19. 5 0. 0 (4.6) NM - - 46 C DC C orp. 6/30/2009 C HIN.A Na s daqG S US D Hong K ong 2. 78 294.6 361. 6 25. 1 6.9% 0.8x 11.6x 2, 227 C hangyou. com Limited 6/30/2009 C Y OU Na s daqG S US D C hina 38.29 2, 106.0 241. 2 147. 2 61. 0% 7.6x 12.4x 628 C hina G ateway C orporation 9/30/2008 CGWY OT C P K US D U nited S tates 0. 02 0.3 6. 7 (6.6) -98. 9% 0.0x - 37 C hines e G amer Interna tional 6/30/2009 G T S M: 3083 GTS M TWD T a iwan 458 1, 187.8 61.6 34. 7 56. 2% 18. 1x 32.2x NA C LIC K E R Inc. 5/31/2009 C LK Z OT C B B US D U nited S tates 0. 01 0.4 2. 5 (1.2) -45. 8% 0.2x - 22 C ornerW orld C orporation 4/30/2009 CWR L OT C B B US D U nited S tates 0. 06 5.7 3. 9 NM NM 4.1x - 16 C yberplex Inc. 6/30/2009 T S X: C X TS X C AD C a nada 1 76. 6 90.5 9.8 10. 8% 0.6x 5. 8x NA DADA S pA 6/30/2009 C M: DA CM E UR Italy 6. 95 165.4 242. 6 31. 9 13. 1% 0.9x 6. 7x NA DXN Holdings B hd 5/31/2009 DX N K LS E MY R Malays ia 0. 61 39. 8 77.1 11. 1 14. 4% 0.7x 4. 9x NA Dibz International, Inc. NA DIB Z OT C P K US D U nited S tates 0. 00 0.0 NA NM NM - - NA DigitalP os t Interactive, Inc. 6/30/2009 DG LP OT C B B US D U nited S tates 0. 06 4.6 1. 0 (1.4) NM 6.7x - 7 DigitalT own, Inc. 5/31/2009 DG T W OT C B B US D U nited S tates 2. 64 72. 2 NM (2.5) NM - - 3 Dolphin Digital Media, Inc. 6/30/2009 DP DM OT C B B US D U nited S tates 0. 40 21. 5 0. 6 (3.4) NM 38. 6x - NA E olith C o. Ltd. 12/31/2008 A041060 K OS E KRW S outh K orea 875 52. 6 15.3 (3.6) -23. 6% 3.6x - NA E xtens ions , Inc. 6/30/2009 E XTI OT C P K US D U nited S tates 0. 25 11. 1 NM NM NM - - 2 F luid Mus ic C anada, Inc. 6/30/2009 T S X: F MN TS X C AD U nited S tates 1. 40 68. 0 5. 3 (5.1) -95. 2% 11. 4x - NA F rogs ter Intera ctive P ictures AG 6/30/2009 FR G XT R A E UR G ermany 17.13 63. 5 9. 7 (4.5) -47. 0% 6.4x - NA G ama nia Digital E nterta inment C o. , Ltd. 6/30/2009 6180 GTS M TWD T a iwan 51.70 242.1 140. 6 25. 1 17. 9% 1.6x 8. 7x NA G ameO n C o L td. 6/30/2009 3812 TS E JPY J apa n 100, 800 105.8 79.6 19. 5 24. 5% 0.4x 1. 7x NA G eoS entric O yj 6/30/2009 G E O 1V HL S E E UR F inla nd 0. 05 65. 9 5. 5 (17. 5) NM 12. 1x - 115 G iant Interactive G roup, Inc. 6/30/2009 GA NY S E US D C hina 8 1, 750.4 198. 5 124. 1 62. 5% - - 1, 570 G iga Media Ltd. 3/31/2009 G IG M Na s daqG S US D T a iwan 5. 57 303.7 183. 6 NM NM 1.3x - 751 G ravity C o., Ltd 6/30/2009 GR VY Na s daqG M US D S outh K orea 1. 95 54. 2 48.6 16. 5 33. 9% - - 469 G ree, Inc. 6/30/2009 T S E :3632 TS E JPY J apa n 9, 850 2, 394.2 151. 5 91. 0 60. 1% 15. 0x 25.0x NA G ungHo O nline E ntertainment, Inc. 6/30/2009 3765 OS E JPY J apa n 243, 000 302.3 116. 1 25. 8 22. 2% 2.3x 10.4x NA HanbitS oft, Inc. 6/30/2009 A047080 K OS E KRW S outh K orea 4, 050 73. 6 60.1 1.4 2.3% 1.0x 43.0x NA IAC /InterActiveC orp. 6/30/2009 IAC I Na s daqG S US D U nited S tates 20.63 2, 731.5 1, 392. 3 52. 7 3.8% 0.7x 18.8x 3, 200 IAS E nergy, Inc. 1/31/2009 IAS A.E OT C B B US D C a nada 0. 15 10. 6 0. 0 (0.8) NM - - NA is eemedia Inc. 3/31/2009 IE E T S XV C AD C a nada 0. 09 4.3 1. 6 (5.1) NM 2.1x - NA J umbuck E ntertainment Limited 6/30/2009 AS X: J MB AS X AU D Aus tralia 0. 40 16. 8 16.6 7.1 42. 8% 0.6x 1. 5x 79 K AB Dis tribution Inc. 6/30/2009 T S X: K AB TS X C AD C a nada 0 0.6 68.4 4.0 5.8% - - NA K ings oft C o. Ltd. 6/30/2009 3888 S E HK HK D C hina 8 1, 141.2 139. 1 61. 4 44. 2% 8.3x 18.7x 2, 271 Lingo Media C orpora tion 6/30/2009 T S XV : LM T S XV C AD C a nada 1. 00 11. 5 1. 2 (1.9) NM 8.8x - NA LiveW orld Inc. 6/30/2009 LV W D OT C P K US D U nited S tates 0. 05 1.5 10.6 (0.1) -1.2% 0.0x - NA LookS mart, Ltd. 6/30/2009 LO O K Na s daqG M US D U nited S tates 1. 28 21. 9 56.8 (4.4) -7.8% - - 90 Magnitude Information S ys tems Inc. 6/30/2009 MAG Y OT C B B US D U nited S tates 0. 01 4.5 0. 1 (2.5) NM - - 14 Mixi, Inc. 6/30/2009 2121 TS E JPY J apa n 599000.00 1, 002.2 132. 8 44. 8 33. 8% 6.7x 19.7x NA Modern T imes G roup Mtg AB 6/30/2009 MT G B OM SEK S weden 312.50 2, 974.2 1, 982. 6 304. 6 15. 4% 1.8x 11.7x 2, 969 MO K O .mobi Limited 12/31/2008 MK B AS X AU D Aus tralia 0. 07 5.2 1. 2 (2.6) NM 3.2x - NA Myriad G roup AG 12/31/2008 MY R N SWX C HF S witzerland 4. 46 92. 0 40.0 0.8 1.9% 2.4x - 405 NE O W IZ G ames C orporation 12/31/2008 A095660 K OS E KRW S outh K orea 42000. 00 732.8 205. 2 55. 1 26. 8% 3.5x 13.1x NA NetDragon W ebS oft, Inc. 6/30/2009 777 S E HK HK D C hina 6 394.2 89.3 25. 7 28. 7% 2.9x 9. 9x 2, 426 Neteas e.com Inc. 6/30/2009 NT E S Na s daqG S US D C hina 43.79 5, 667.6 472. 4 297. 4 63. 0% - - 3, 109 NeuLion Incorporated 6/30/2009 T S X: NLN TS X C AD C a nada 0. 93 98. 3 21.5 (13. 0) -60. 3% 4.1x - 237 NeXplore C orporation 6/30/2008 NX P C OT C P K US D U nited S tates 1 30. 7 0. 7 (6.2) NM 49. 2x - NA Ngi G roup Inc. 6/30/2009 2497 TS E JPY J apa n 26750. 00 36. 0 90.3 6.7 7.4% - - NA Northgate T echnologies Limited 6/30/2009 590057 BSE INR India 42.65 31. 0 82.8 (41. 4) -50. 0% 0.4x - NA O pen T ext C orp. 6/30/2009 OT E X Na s daqG S US D C a nada 39.45 2, 215.1 785. 7 205. 1 26. 1% 2.9x 10.9x 3, 411 O penwave S ys tems Inc. 6/30/2009 OP W V Na s daqG S US D U nited S tates 2. 70 225.4 191. 7 4.9 2.6% 0.6x 23.8x 590 P erfect W orld C o. , Ltd. 6/30/2009 PWR D Na s daqG S US D C hina 43.98 2, 163.0 255. 7 142. 2 55. 6% 0.7x 1. 2x 2, 096 P NI Digital Media Inc. 6/30/2009 T S XV : P N T S XV C AD C a nada 1. 89 59. 9 21.2 2.3 11. 0% 2.7x 24.9x NA Q uepa s a C orp. 6/30/2009 QP S A OT C B B US D U nited S tates 2 22. 1 0. 2 (10. 6) NM - - 74 O AO R B C Information S ys tems 12/31/2007 R BCI R TS US D R us s ia 1. 16 160.9 156. 2 20. 4 13. 1% 0.0x 0. 3x NA S handa Intera ctive E ntertainment Ltd. 6/30/2009 S NDA Na s daqG S US D C hina 53.53 3, 574.1 629. 0 296. 7 47. 2% - - 3, 124 S hutterfly, Inc. 6/30/2009 S F LY Na s daqG S US D U nited S tates 17.71 450.8 218. 6 27. 3 12. 5% 1.8x 14.2x 514 S K C ommunications C o. , Ltd. 12/31/2008 A066270 K OS E KRW S outh K orea 9310.00 323.4 190. 8 12. 4 6.5% 1.7x 26.1x NA S NAP Interactive, Inc. 6/30/2009 S TVI OT C B B US D U nited S tates 1 5.4 3. 5 0.9 27. 0% 1.1x 4. 0x 11 S NM G loba l Holdings 9/30/2008 S NMN OT C P K US D U nited S tates 0. 00 0.0 2. 0 (0.7) -34. 8% 1.1x - 33 S ocial Media V enures , Inc. 12/31/2008 S MV I OT C P K US D U nited S tates 0 0.0 0. 1 (0.1) -60. 6% 4.5x - NA S ocialwis e, Inc. 6/30/2009 S C LW OT C B B US D U nited S tates 0. 58 25. 7 0. 0 (5.6) NM - - NA S ohu. com Inc. 6/30/2009 S O HU Na s daqG S US D C hina 68.86 2, 639.7 485. 1 209. 6 43. 2% 4.4x 10.2x 3, 197 S park Networks , Inc. 6/30/2009 LO V AME X US D U nited S tates 2 45. 3 50.5 10. 8 21. 3% 0.9x 4. 0x 183 S pectrumDNA, Inc. 6/30/2009 S P XA OT C B B US D U nited S tates 0 10. 7 0. 1 (2.5) NM - - 7 T encent Holdings L td. 6/30/2009 700 S E HK HK D C hina 128 29, 985. 0 1, 391. 6 680. 3 48. 9% 23. 7x 48.4x 6, 421 T he P arent C ompa ny 8/2/2008 K IDS .Q OT C P K US D U nited S tates 0. 01 0.2 112. 0 (13. 5) -12. 0% 0.2x - 347 T he9 Limited 12/31/2008 NC T Y Na s daqG S US D C hina 8. 46 212.3 250. 6 85. 5 34. 1% - - 1, 626 T heS treet. com, Inc. 3/31/2009 TS CM Na s daqG M US D U nited S tates 2. 72 83. 2 67.0 1.9 2.9% 0.3x 9. 6x 310 T ota l S port O nline AS 3/31/2006 T OS O O T C NO NOK Norway 0. 03 0.1 2. 3 (1.1) -50. 6% 4.6x - 16 T ree.C om, Inc. 6/30/2009 TR E E Na s daqG M US D U nited S tates 7. 79 84. 2 216. 6 (0.7) -0.3% 0.4x - 700 U nis erve C ommunications C orp. 2/28/2009 T S XV : U S S T S XV C AD C a nada 0. 04 0.9 24.1 0.1 0.2% 0.2x - NA U nited O nline Inc. 6/30/2009 U NT D Na s daqG S US D U nited S tates 8. 26 692.5 949. 8 203. 2 21. 4% 1.0x 4. 7x 1, 469 U OMO Media, Inc 4/30/2009 U O MO OT C B B US D C a nada 0 10. 5 0. 9 (0.5) -53. 2% 12. 6x - NA V alueC lick Inc. 6/30/2009 V C LK Na s daqG S US D U nited S tates 13 1, 109.5 563. 6 99. 0 17. 6% 1.7x 9. 8x 1, 189 V OIS , Inc. 6/30/2009 V O IS OT C B B US D U nited S tates 0 2.5 0. 0 (1.0) NM - - 4 W ebzen Inc. 6/30/2009 W ZE N Na s daqG M US D S outh K orea 3. 05 36. 2 22.9 2.3 9.9% - - 328 W izzard S oftware C orpora tion 6/30/2009 W ZE AME X US D U nited S tates 0. 46 23. 2 5. 3 (4.5) -84. 9% 4.6x - 110 W orlds . com Inc. 6/30/2009 W DDD OT C B B US D U nited S tates 0. 10 5.2 0. 1 (0.7) NM - - 1 W ynds torm C orporation NA W Y ND OT C P K US D U nited S tates 0. 10 1.8 NA NM NM - - NA XING AG 6/30/2009 O 1B C XT R A E UR G ermany 32.75 253.5 59.0 17. 0 28. 8% 3.4x 11.8x 246 Y eda ngO nline C orp. 12/31/2007 A052770 K OS E KRW S outh K orea 9020.00 112.1 56.8 12. 2 21. 6% 2.1x 9. 9x NA Y nk K orea Inc. 12/31/2008 A023770 K OS E KRW S outh K orea 4215.00 18. 7 11.8 1.2 10. 5% - - NA High 29, 985. 0 1,982. 6 680.3 63. 0% 49. 2x 48.4x 6,421 Low 0.0 0.0 -41.4 -98. 9% - - 1 Average 769.5 160.8 38.6 5.2% 5.4x 13.2x 901 Median 48. 9 53.7 1. 2 11. 8% 2.1x 10.3x 242 Figure 1. Web 2.0 Universe Summary Source. Capital IQ
- 3. Page 3 C A P I T A L M A R K E T S A C T I V I T Y (M & A A N D F I N A N C I N G ) Deal flow picks up: Total transaction value in the W eb 2.0 universe for September nearly doubled to $74.2 million, up from $37.4 million at time of publication last week. This week has brought another four financings to the sector, bringing the month-to-date total to thirteen transactions averaging $5.7 million each (compared with our month-to-date average of $4.7 million last week over nine transactions). The largest transaction is a $20 million financing of Ensequence (provider of software and services to manage interactive television content). The Ensequence trade exceeds the previous transaction value high in September set by the $9 million financing of InXpo (Virtual Worlds). In comparison, total capital raised in August was $208.5 million, averaging $7.7 million (27 deals); for July (35 deals) $191.4 million, averaging $5.5 million; and June (42 deals) was $204.7 million (averaging $4.9 million). Financing Activity Last Twelve Months 400.0 18.0 16.2 16.0 350.0 14.6 14.0 300.0 12.0 250.0 9.7 10.0 (US$m) (US$m) 200.0 7.9 8.0 7.0 7.0 7.1 6.5 6.6 150.0 6.2 5.7 5.5 6.0 4.9 100.0 4.0 50.0 2.0 0.0 0.0 Sep-08 Oct-08 Nov-08 Dec-08 Jan-09 Feb-09 Mar-09 Apr-09 May-09 Jun-09 Jul-09 Aug-09 Sep-09 *May-09 includes $200m FB investment Total Average Figure 2. Financings, Last Twelve Months Source. Company reports
- 4. Page 4 Quiet After Mint: Following Intuit’s acquisition of Mint.com for $170 million last week, financing and M&A headlines were more muted with the $20 million series D financing of Ensequence making the top headline in the W eb 2.0 space. Fwix, a local news search application developer, announced a $2.8 million series A raise. NextBio, a life sciences collaboration products company, announced $8.0 million in series C financing. Finally, Mocapay, a mobile payments services concern, is raising $3 million in a series C financing. For additional details on financings, see Figures 23 and 24 (at end of note). Financing & M/A Summary - Last Three Months 200.0 180.0 160.0 140.0 120.0 Sep-09 (US$m) 100.0 Aug-09 Jul-09 80.0 60.0 40.0 20.0 0.0 Fwix xoopit Pandora Media MediaMath QuickPlay Media InXpo NextBio HiveLive Invodo Boxee Polyvore Nexage Z2Live ProtonMedia iLoop Mobile Greystripe iSyndica Masher Media Mocapay Roblox MOG StyleCaster Mint Quikr India Pvt. Ltd. RightsFlow CoTweet Skype People Media Turbine Friends Reunited AdLink Internet Media Ensequence iLike Ning Zoove RichRelevance Traffiq Edo Interactive Jobvite ConnectEdu SBNation InnoCentive Balihoo YuMe Fanbase OurStage Scoreloop Busca Tremor Media Aloqa Lat49 Plista FourSquare EduFire ChessCube Thread Clikthrough Cognitive Match Limited Cellufun BookFresh Super Rewards NowPublic OPEN Sports network TweetDeck MashLogic Tiny Pictures Linksify Metaversum Kontera Ltd. OneRiot KODA iSocket People Capital Comunitae Causes Outspark Acquia, Inc iMemories Conduit Labs Gigpark Bill.com Tributes.com Smith & Tinker Jambool Riot Games Akademos Figure 3. Capital Market Activity, Last Three Months Source. Company reports
- 5. Page 5 Advertising remains the most active sector: Advertising-related companies continue to see the most activity by number of transactions (10), followed by Social Networks (9), and Gaming (8) (Figure 4). The $2.0 billion acquisition of Skype skews the dollars transacted to the SMS/Voice segment, while the $170 million acquisition of Mint brings the Vertical Communities segment to the second highest total. Capital Market Activity by Sector - Last Three Months 200.0 180.0 160.0 140.0 120.0 (US$m) 100.0 80.0 60.0 40.0 20.0 2,025.0 197.5 100.1 98.5 85.0 80.0 73.9 64.5 40.0 38.2 37.3 20.7 13.2 12.5 12.0 10.0 8.6 8.0 8.0 7.0 5.0 4.1 4.0 3.2 2.8 1.0 0.5 0.5 0.0 Comment/Reputation Communities Gaming Online Dating Online Calendar Mobile Online Learning Enterprise Media Collaboration Microblog Online Lending Music SMS/Voice Infrastructure Advertising/Mobile Blog Search Classified Mobile Ad Social Networks Virtual Goods Advertising Virtual World Video Crowdsourced Aggregation Analytics Vertical Content # companies 1 5 10 8 9 1 5 5 5 5 3 5 1 1 3 3 2 1 1 1 1 1 2 1 1 1 1 1 Figure 4. Capital Market Activity, by Sector, Last Three Months Source. Company reports
- 6. Page 6 C A P I T A L M A R K E T S A C T I V I T Y (P R I C E P E R F O R M A N C E ) Web 2.0 index continues to outpace NASDAQ recovery: Our W eb 2.0 index (market-cap weighted) essentially mirrored the performance of the NASDAQ composite index from mid-2008 until earlier this year. However, the index has recently had a much stronger recovery relative to the NASDAQ index (Figure 5). Web 2.0 Index Price Performance 180 160 140 120 100 80 60 40 20 0 9/22/2008 10/6/2008 10/20/2008 11/3/2008 11/17/2008 12/1/2008 12/15/2008 12/29/2008 1/12/2009 1/26/2009 2/9/2009 2/23/2009 3/9/2009 3/23/2009 4/6/2009 4/20/2009 5/4/2009 5/18/2009 6/1/2009 6/15/2009 6/29/2009 7/13/2009 7/27/2009 8/10/2009 8/24/2009 9/7/2009 9/21/2009 Index: Web 2.0 (Market Cap) ^COMP - Share Pricing Figure 5. Web 2.0 Price Performance Source. Capital IQ
- 7. Page 7 Broad-based price improvement: Twenty-nine of the companies in our universe had positive stock price performances over the past week (for stocks with prices greater than $1) (Figure 6) while twelve companies showed negative one-week returns. Volatile price swings continue for DigitalTown (OTCBB:DGTW ), rising 76% this week following a 14% decline the previous week. Frogster International (XTRA:FRG) experienced the largest decline at -8.8% for the week. 1 Week P rice P erformance DigitalTow n, Inc. 76.0% S hutterf ly , Inc. 19.2% G igaMedia Ltd. 15.3% Gravity Co., Ltd 14.0% V alueClick Inc. 13.8% G ama nia Digital Entertainment 12.5% A c toz S oft Co., Ltd. 10.8% Chines e G amer Internationa l 10.6% Open Tex t Corp. 10.6% LookS mart, Ltd. 9.4% Modern Times G roup Mtg A B 7.9% NEOWIZ G ames Corporation 7.4% IA C/InterA ctiveCorp. 6.3% United Online Inc. 5.9% S ohu.com Inc. 4.6% S handa Interactive 4.1% Y nk K orea Inc. 3.8% Webz en Inc. 3.7% The9 Limited 3.5% S K Communications Co., Ltd. 3.3% Neteas e.c om Inc. 2.9% G iant Interactive G roup, Inc. 2.7% TheS treet. com, Inc. 2.6% Eolith Co. Ltd. 2.3% Perf ect World Co., Ltd. 1.3% S park Netw orks , Inc. 0.9% Tencent Holdings Ltd. 0.9% PNI Digital Media Inc. 0.5% CDC Corp. 0.4% Lingo Media Corporation 0.0% Cy berplex Inc. 0.0% X ING A G -0.3% Tree.Com, Inc. -0.5% Quepas a Corp. -0.6% My riad G roup A G -0.9% NetDragon WebS oft, Inc. -1.4% K ings of t Co. Ltd. -1.9% Y edangOnline Corp. -2.0% DA DA S pA -2.3% HanbitS oft, Inc. -3.6% Changy ou.com Limited -5.6% Openw ave S y s tems Inc. -5.9% Frogs ter Interac tive Pictures A G -8.8% -0.2 -0.1 0 0.1 0.2 0.3 0.4 0.5 0.6 0.7 0.8 0.9 Figure 6. 1-Week Price Performance Source. Capital IQ
- 8. Page 8 P U B L I C C O M P A N Y I N D U S T R Y N E W S (P A R T N E R S H I P S , F I N A N C I A L R E S U L T S , N E W P R O D U C T S ) K ey Developments Compa ny Headline Notes S hutter fly, Inc . (Nas da qGS : S F LY ) S hutte rfly Inc . Appoints B ria n S we tte to the B oa rd O n S eptember 8 , 20 09, B rian S wette wa s appointed to the B oa rd of D irec tors of S hutterfly Inc . Mr. S wette will a ls o s erv e on the A udit C ommittee of the B oa rd. M r. S we tte has s erved on the B oard of B urge r K ing s ince 2 003, a nd be ca me Non -E xe cutive C ha irma n in 20 06. Mr. S wette a ls o s erv es on the B o ard of Dire ctors for J amba Ju ice, C B L P artners , F R S C o mpa ny a nd C a re . com. S hutter fly, Inc . (Nas da qGS : S F LY ) Jo hn P ois son to J oin in S hutterfly, Inc S hutterfly I nc . an nounc ed tha t it has a cquired T iny P ic tures . T iny P ictures 's found er and C E O , J ohn P ois s on, a long with the T iny P ictures te am, will join S h utte rfly. C or nerW or ld C or poration C ornerW orld C orpora tion R eports E a rning s R es ults for C orn erW orld C orpora tion reported earnings res ults for the firs t quarter e nde d J uly 3 1, 2 009 . F or th e quarter, the compa ny reported net los s (O TC B B : C W R L ) the F irs t Q ua rte r E nded J uly 31 , 20 09 of $33 4, 5 55, down $107 , 57 1 for the sa me qua rter the prev ious ye a r 20 08. G iant Inte rac tiv e G roup, Inc . Gian t Interac tive Group I nc. A ppoints E rns t & Y oung Hua G iant Inte ra ctiv e G roup Inc. 's sha reho lde rs res olutions a dopted a t its a nnua l gene ra l mee ting of s hareholders held in S ha ngha i on (NYS E : GA) Ming a s the C ompa ny's I ndependent Auditors S eptember 11 , 20 09. T he c ompa ny 's s hareholders a ppo inted E rns t & Y oung Hua M ing as th e compa ny' s ind epe nden t au ditors for the f is c al year e nding D ecember 31 , 20 09. C M C a pita l Inv es tments ; Myri ad G roup My riad G roup A G ( S W X : M Y R N ) a c quire d Xumii, Inc. Myria d G roup AG (S W X: MY R N ) ac qu ired X umii, Inc . on S eptember 15 , 20 09. T he f ina ncia l terms of the de a l were not dis c los ed. A ll 17 AG (S W X : MY R N); S outhe rn C ros s employees o f Xu mii will be pa rt of Myria d G roup. T he tra ns ac tion is not ex pec te d to ha ve a ma teria l impa ct to Myria d re venue or E B IT DA for V enture Par tners ; Xumi i, Inc. the full fis ca l yea r 2009 . Myria d G roup AG (S W X: MY R N ) completed the ac quis ition of Xumii, Inc. on S eptember 15 , 20 09. L ookS mart, L td. (Nas da qG M: L O O K ) S ta ce y G ia malis to Le a ve L ook S ma rt L td. as G ene ra l O n S eptember 9 , 20 09, S ta cey G iama lis , G eneral C ouns el a nd S enior V ice P res ident, a nd L ook S ma rt Ltd. determined tha t Ms . G ia malis C ounse l a nd S en ior V ice P re sident would s epara te from the C o mpany ef fec tive S e ptembe r 15, 200 9. IA S E ne rgy, I nc . (O T C B B : IA S A.E ) IAS E ne rgy, Inc. a nnou nc ed delay ed 1 0-Q filing O n 0 9/1 5/20 09, IA S E ne rgy, Inc . a nno unc ed tha t the y will be una ble to file the ir next 10-Q by the de a dline requ ired by the S E C . K ings oft C o. L td. (S E HK : 38 88) K ings oft C o. Ltd. R e ports E arnings R e sults f or the F irs t K ings oft C o. Ltd. reporte d ea rnings res ults for th e first ha lf of 20 09. F or the firs t ha lf, the company reaped total revenues of C NY 476 million, Ha lf of 200 9 ris ing 37% yea r on yea r. G ross profit arriv ed a t C N Y 417 million, jumping 40% from firs t half of 200 8. G ros s ma rgin reache d 88 % . IA S E ne rgy, I nc . (O T C B B : IA S A.E ) IAS E ne rgy D ele ted F ro m OT C B B IA S E nergy, Inc' s common s toc k ha s been delete d from O T C B ulletin B oard effe ctiv e S eptember 16 , 20 09 on a ccount of its fa ilure to comply with N AS D 6 530. T he compa ny ha s been added to NB B . NetDr agon W e bS oft, Inc. (S E HK : 77 7) NetDra gon W ebS oft Inc . La unches Demon R ising Ne tDragon W e bS o ft I nc. an nou nc ed the la unc h of Demon R is ing, a n ew C h ine se ex pans ion pac k for its fla gs hip E u demons O nline ga me. De mon R is ing marks the fifth E P re lea s ed f or E udemons O n line s inc e the g ame wa s initia lly la unc hed in J une 200 6, a nd will introduce a s erie s of six co mpre hens ive insta nc ed a ctivities . IB 3 Network s , Inc . (O T C B B : IB NW ) IB 3 Networks I nc . T ermin ates J ulia C ooper a s V P of E ffe ctive S eptember 14 , 20 09, Ju lia C oope r was termina ted as V P of S ales a nd O pe ra tions of IB 3 Ne twork s Inc. S a les a nd O pera tions T ence nt Holdings Ltd. (S E HK : 700) T enc ent A ggres s ively S couting F or O verse a s M& A T he P re sident of T ence nt H olding s Ltd. , C hi-ping L a u s a id that the compa ny will a cc elerate the pace of its merge a nd a cquis ition and may cond uct direct inves tment a nd joint inve stme nt to ex pa nd overs eas . L au noted tha t Te nc ent will ke ep scouting for pote ntia l foreign M& A opportunities a nd h as a lrea dy o pene d repre se ntative o ffice s in V ietna m, India , S outh K orea, a nd the U. S . T e nc ent would lik e to s eiz e opportunities in the g loba l fina ncia l meltdown and pa rtner with other c ompanie s in re la ted f ie lds tha t ha s grea t potentia l, sa id La u. Howe ve r, T ence nt will not lower its crite ria for potentia l M &A de a ls a t a time when mo re and more M& A opportun ities a re being thrown up bec aus e of the global fin ancial crisis . T he firm will e xa mine the fe a s ibility o f the de a ls by ev alua ting its o wn te chnology , tale nt a nd bus in es s performance , ac cording to L au. L ogic a ; O pen T ext C orp. Open T e xt C orp. E x tends P a rtners hip with L ogica O pe n T ex t C orp. ha s extende d its pa rtners hip with L ogica , with L ogic a joining th e O pen T ex t G lo ba l P a rtne r P rogra m for S A P C ompe tence . (Nas da qG S : O T E X ) Under th e ag re ement, Logica will deliv er a nd s upport the O pe n T ex t E nte rpris e C ontent Ma nagement (E C M) s uite for S A P s olutions. T he compa nie s, togethe r with S AP , will colla bora te on the implementa tion o f joint mark et o fferings , bas ed on the O pen T e xt E C M s uite for S A P s olutions , in co njunction with a range of cons ulting, s ys tems integra tion, a pplica tio n mana gement and manag ed operation s ervices from Lo gica . O penwav e S ys tems Inc . Openwa ve S ys tems Inc . - C onfe re nce P res entation C a ll T o pres ent outlining c ompa ny's vis ion for produc ts , ma rk ets a nd growth stra tegy (Nas da qG S : O P W V) T re e.C om, Inc . (N as daqG M: T R E E ) T re e.C om I nc. an d M ortech I nc. R e solve L aws uit T ree. C om Inc. and Morte ch Inc. hav e res olv ed their laws uit to the mutu al s atisf ac tio n of both partie s, a nd the la ws uit ha s been dismiss ed. Dolby L a boratori es Inc. (NY S E : DL B ); Gian t Interac tive to U tiliz e Dolby(R ) A xon 3D V oice G iant Inte ra ctiv e G roup Inc. a nnounced tha t it will integra te Dolby(R ) A xon, th e 3D voice technolog y developed by Do lby L a bora tories I nc. , G iant Inte rac tiv e G roup, Inc . T echnology in ZT Online into its f la gs hip ma s sively multipla ye r online role playin g ga me (MMO R P G ) ZT O nline . Z T O nline will incorporate Dolby A xon 3D voice to MO K O .mobi L i mited (AS X : MK B ) MO K O .mobi L imited R eports R eturn on E qu ity R e sults MO K O .mobi Limite d (L oo p M obile) reported return on e quity res ults for th e year e nded J une 30, 200 9. for the ye a r, th e compa ny re ported for the Y ea r E nde d J un e 30 , 20 09 los s on equity of 271 . 2% and los s on as s ets o f 18 4. 3% c ompared to los s on equity of 18 3. 5% and lo ss o n as s ets of 1 50. 4 % for the sa me Figure 7. Key Developments Source. Capital IQ
- 9. Page 9 VALUATION Online Gaming companies lead market-cap charts: Fifteen companies in our W eb 2.0 universe top US$1 billion in market capitalization (Figure 8), up from thirteen last week. Fifty-eight of the ninety-one companies have market caps under US$100 million, with 37 under US$10 million. Online gaming companies dominate the top of the list, led by Tencent Holdings with a market cap near US$30 billion. Market C ap (US D m) Tenc ent Holdings Ltd. 29985.0 Neteas e.c om Inc . 5667.6 S handa Interac tive Entertainment 3574.1 Modern Times Group Mtg A B 2974.2 IA C/InterA ctiv eCorp. 2731.5 S ohu.c om Inc . 2639.7 G ree, Inc . 2394.2 Open Tex t Corp. 2215.1 Perf ec t W orld Co., L td. 2163.0 Cha ngyou. com L imited 2106.0 Gia nt Interac tive Group, Inc . 1750.4 Chines e G amer Interna tional 1187.8 K ings of t Co. Ltd. 1141.2 V a lueClic k Inc . 1109.5 Mix i, Inc . 1002.2 NEOWIZ G ames Corpora tion 732.8 United Online Inc . 692.5 S hutterf ly, Inc . 450.8 NetDragon WebS oft, Inc . 394.2 S K Communic ations Co., Ltd. 323.4 G iga Media Ltd. 303.7 GungHo Online Entertainment, Inc . 302.3 CDC Corp. 294.6 XING A G 253.5 Ga ma nia Digita l Enterta inment Co., 242.1 Openw a ve S y s tems Inc . 225.4 The9 L imited 212.3 DA DA S pA 165.4 OA O R B C Information S y s tems 160.9 A ctoz S of t Co., Ltd. 142.6 Y edangOnline Corp. 112.1 Ga meOn Co Ltd. 105.8 NeuL ion Incorpora ted 98.3 My ria d Group A G 92.0 Tree. Com, Inc . 84.2 TheS treet.c om, Inc . 83.2 Cy berplex Inc . 76.6 HanbitS oft, Inc . 73.6 Digita lTow n, Inc . 72.2 Fluid Mus ic Canada, Inc . 68.0 GeoS entric Oyj 65.9 Frogs ter Interac tive Pic tures A G 63.5 PNI Digita l Media Inc . 59.9 Grav ity Co., Ltd 54.2 Eolith Co. Ltd. 52.6 S pa rk Netw orks , Inc . 45.3 DXN Holdings B hd 39.8 Webz en Inc . 36.2 Ngi Group Inc . 36.0 A Q Intera ctiv e, Inc . 31.0 Northgate Tec hnologies L imited 31.0 NeXplore Corpora tion 30.7 S ocia lw is e, Inc . 25.7 Wiz z a rd S oftw are Corpora tion 23.2 Quepa s a Corp. 22.1 LookS mart, L td. 21.9 Dolphin Digita l Media, Inc . 21.5 B roa dWebA s ia Inc . 19.5 Y nk K orea Inc . 18.7 A c celeriz e New Media, Inc . 18.2 J umbuc k Entertainment L imited 16.8 Lingo Media Corpora tion 11.5 Ex tens ions , Inc . 11.1 S pec trumDNA , Inc . 10.7 IA S Energy, Inc . 10.6 UOMO Media , Inc 10.5 B eyond Commerc e, Inc . 7.9 B right Things plc 6.0 CornerWorld Corpora tion 5.7 S NA P Intera ctiv e, Inc . 5.4 MOK O.mobi L imited 5.2 Worlds .c om Inc . 5.2 Digita lPos t Intera ctiv e, Inc . 4.6 Ma gnitude Inf orma tion S y s tems Inc . 4.5 is eemedia Inc . 4.3 V OIS , Inc . 2.5 B eta w av e Corpora tion 2.0 W ynds torm Corpora tion 1.8 LiveWorld Inc . 1.5 B igs tring Corp. 1.1 Unis erv e Communic ations Corp. 0.9 K A B Dis tribution Inc . 0.6 A s s oc iated Media Holdings Inc . 0.6 CL ICK ER Inc . 0.4 China Ga tew a y Corpora tion 0.3 The Parent Company 0.2 Tota l S port Online A S 0.1 S NM Globa l Holdings 0.0 Dibz Interna tiona l, Inc . 0.0 S oc ia l Media V enures , Inc . 0.0 0 500 1,000 1,500 2,000 2,500 3,000 3,500 4,000 Figure 8. Market Cap Ranking Source. Capital IQ
- 10. Page 10 TEV/Revenue (LTM) averages 5.4x: The overall average TEV/Revenue (LTM) multiple for our group is 5.4x (vs. 5.2x last week) (Figure 9). Three companies trade at more than 25x revenue – Bigstring Corp. (OTCBB:BSGC) at 34.6x, Dolphin Digital Media, Inc. (OTCBB:DPDM) at 38.6x, and NeXplore Corporation (OTCPK:NXPC) at 49.2x. The median of 2.1x is up from 1.7x last week. Note that we exclude multiples greater than 50x. Twenty-seven companies have multiples under 1.5x. T E V/L T M R evenue (x) 60. 0 49.2 50. 0 38.6 40. 0 34.6 30. 0 23.7 20. 0 18.1 15.0 15.6 12.6 11.4 12.1 10. 0 8.3 8.8 A vera ge, 5.4 6.4 6.7 6.7 7.6 5.2 3.5 3.6 4.1 4.1 4.4 4.5 4.6 4.6 2.7 2.9 2.9 3.2 3.4 1.5 1.6 1.7 1.7 1.8 1.8 2.1 2.1 2.3 2.4 0.2 0.2 0.2 0.3 0.4 0.4 0.4 0.6 0.6 0.6 0.7 0.7 0.7 0.8 0.9 0.9 1.0 1.0 1.0 1.1 1.1 1.2 1.3 0. 0 N E O WIZ G ames C orporation J umbuc k E nterta inment L imited MO K O .mobi L imited UO MO Media, Inc C LIC K E R Inc. G a mania Digital E ntertainment C o., Ltd. G ungH o O nline E ntertainment, Inc. P N I Digital Media Inc. C hines e G amer Interna tional U nis erve C ommunications C orp. N orthgate T echnologies L imited DXN Holdings B hd C ha ngy ou.com L imited G a meO n C o Ltd. T ree.C om, Inc. C DC C orp. B ey ond C ommerc e, Inc. S K C ommunica tions C o., Ltd. DigitalP os t Intera ctive, Inc. F luid Mus ic C a nada , Inc. Dolphin Digital Media, Inc. T he P a rent C ompany Modern T imes G roup Mtg AB G eoS entric O y j S N M G loba l Holdings NeuLion Inc orporated C ornerWorld C orporation Lingo Media C orporation NeX plore C orporation T heS treet.com, Inc . United O nline Inc . S NAP Intera ctive, Inc. O pen T ex t C orp. C y berplex Inc . IAC /InterAc tiveC orp. S pa rk N etwork s , Inc . G igaMedia Ltd. V alueC lic k Inc . is eemedia Inc . NetDra gon WebS oft, Inc . XIN G AG E olith C o. Ltd. S ohu.com Inc . F rogs ter Intera ctiv e P ic tures AG Mix i, Inc . G ree, Inc . As s ociated Media Holdings Inc . T encent Holdings Ltd. O penwave S y s tems Inc . P erfect World C o., Ltd. H anbitS oft, Inc . Y nk K orea Inc . Y edangO nline C orp. S ocial Media V enures , Inc . B igs tring C orp. My riad G roup AG T otal S port O nline AS S hutterfly , Inc . Acceleriz e New Media , Inc . K ings oft C o. Ltd. DADA S pA Ac toz S oft C o. , Ltd. Wiz z ard S oftware C orporation Figure 9. TEV/Revenue Ranking Source. Capital IQ TEV/Revenue (LTM) by country/exchange: W e have also calculated multiples based on where the companies are listed or domiciled. Figure 10 shows the average TEV/Revenue multiples by stock exchange. The OTCBB has the largest number of companies (18), trading at an average multiple of 10.1x (vs. 11.5x last week). On a geographic basis, the United States has the most companies (38), trading at an average of 7.4x revenue (vs. 5.6x last week) (Figure 11). Ten of the companies are Canadian (average 4.3x revenue). Average TEV/LTM Revenue - By Exchange Average TEV/LTM Revenue - By Country 14.0 14.0 12.1 12.1 12.0 12.0 11.6 10.0 11.6 10.0 8.0 10.1 9.8 8.0 7.9 (x) 7.4 (x) 6.0 5.6 7.0 5.4 4.9 4.6 6.0 4.0 3.4 4.9 4.9 2.7 2.4 2.3 4.6 4.3 2.2 2.1 1.9 1.8 0.9 4.0 2.0 0.7 2.4 0.4 2.0 2.2 1.9 1.8 0.9 0.0 0.4 0.00.0 0.8 0.7 OTCNO OTCPK OTCBB GTSM NasdaqGM HLSE SEHK TSE OSE KOSE NasdaqGS RTS OM CM 0.4 0.0 0.0 TSX XTRA AMEX KLSE BSE AIM TSXV SWX 0.0 ASX Germany Finland China United Japan Canada Hong Kong Malaysia India Russia United Italy South Taiwan Australia Norway Switzerland Sweden # Companies 1 3 18 11 2 5 4 2 1 4 2 1 1 6 14 2 1 1 1 1 5 1 1 # Companies 1 10 38 3 6 2 1 10 1 8 2 1 1 1 1 1 1 1 Figures 10 & 11. TEV/Revenue Ranking (Exchange, Country) Source. Capital IQ