1. DavidBatchelor
October19, 2010
Period7, Physics
The Effect of Temperature on Frequency in a Wine Glass
Introduction
Have you ever rotated your finger around the rim of a wine glass? When done correctly, a
sound is created thus receiving the name “singing wine glass”. When different amounts of
water are added to the glass, different sound pitches are created. In this Independent Research
lab, the main goal was to find out how temperature affects sound. In other words, how does
the temperature of the water in a wine glass affect the resonant frequency created by making
the wine glass “sing”?
The theory behind the question is simple. As the temperature of the water in the wine glass
decreases, the temperature of the wine glass itself decreases causing it to contract thus
creating less space for sound to resonate consequently creating a higher frequency. In contrast,
as the temperature of the water increases, the temperature of the wine glass increases causing
it to expand thus creating more space for sound to resonate therefore creating a lower
frequency sound. The predictions made for this experiment more or less followed the
guidelines of the theory. As the temperature of the water increases, the frequency decreases.
Likewise, as the temperature of the water decreases, the frequency increases.
1
2
3
Microphone
LoggerPro Device
Water Heater
GraduatedCylinder
Beakerof
ice water
Surface TemperatureProbes
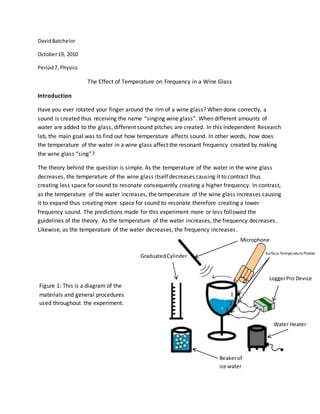
Figure 1: This is a diagram of the
materials and general procedures
used throughout the experiment.
2. Procedure
The setup of the lab involves a wine glass that has three different surface temperature probes
that are positioned at three different locations; one on the top (1), middle (2) and bottom (3)
(see Figure 1 for reference). All three temperature probes are connected to a computer
program called “logger pro” where the temperatures are recorded into the computer. A
microphone is also integrated with Logger Pro so the frequency can be recorded as an FFT
graph which displays the peak frequency. The FFT graph on Logger Pro is set at 0.2 seconds
which reads 10,000 samples per second. To take the data, one partner holds the microphone
above the wine glass while the other partner rotates his/her finger around the rim of the wine
glass to achieve the “singing wine glass sound”. Additionally, a beaker of ice cold water and a
water heater is on standby until different temperatures of water are needed for the
experiment. Furthermore, the dimensions of the wine glass are 6.1 cm for the diameter of the
opening of the glass, 0.05 cmfor the thickness of the wall of the wine glass, 16.51 cmfor the
height and 9 cm for the height (not including the stem and base). The temperature probes are
taken off the wine glass while recording frequency as this would obstruct the frequency
reading. 100ml of water (measured with a graduated cylinder) is used for every single water
temperature and trial so that the data is consistent throughout the experiment. In the
experiment, the independent variable is the temperature of the water and the dependent
variable would be the resonant frequency as a result of ringing the wine glass. The controlled
variables are the wine glass, the temperature of the room and the microphone as well as the
person making the noise from the wine glass. The temperature of the room is always kept
constant as long as nobody turns off the air conditioner. Five different water temperatures are
used throughout the experiment with three trials given to each temperature.
Data Processing
Table 1: This table displays the different temperatures collected using three different surface
temperature probes. In addition, table 1 shows the different levels of temperature used such as
“coldest, cold, room temp and hot”. As shown in Figure 1, the three temperature probes are
Temperature of Probes (± 0.1 ˚C)
Water
Temperature
Level Probe 1 Probe 2 Probe 3
Average (P1-P3) Average (P1-P2)
Coldest 25.6 17.2 12.0 18.3 21.4
Cold 26.1 21.0 20.0 22.4 23.6
Room
Temperature
Water 26.6 27.0 27.0 26.9 26.8
Hot 30.8 36.9 33.0 33.6 33.9
Hottest 37.3 48.6 40.4 42.1 43.0
3. placed in three different locations because the temperature of the wine glass is different on the
top of the glass than the bottom of the glass.
Additionally, the averages for Probes 1 and 2 were taken separately. In Diagram 1, the
positioning of the temperature probes had certain inaccuracies. The inaccuracy of temperature
probe 3 was the fact that it was positioned on thicker glass. When a glass is rung, the only parts
of the glass that vibrate are the thin walls of the glass; around the same location of probe 1 and
2. However the positioning of probe 3 was on thick glass where there is no vibration. Thus, the
average temperatures of probe 1 and 2 were taken separately to see if the exclusion of probe 3
had an effect on the overall results.
Frequency of Glass (±2.0 Hz)
Water Temp Level Trial 1 Trial 2 Trial 3 Average
Coldest 1193 1193 1196 1194
Cold 1193 1193 1193 1193
Room Temperature
Water 1193 1190 1193 1192
Hot 1193 1193 1193 1193
Hottest 1193 1193 1193 1193
Table 2: This table shows the frequencies recorded for all the different temperatures of the
wine glass. As you can see from the data recorded, the different temperatures had no apparent
effect on the resonation frequency of the wine glass which was different from what was
predicted and expected before the experiment was carried out. Instead of seeing a decrease or
increase in frequency as a result of temperature change, the frequency remained almost
entirely constant.
Figure 2: Thisa sample FFTgraph that displaysthe peakfrequencyof the firsttrial of a hotwater
sample.Asyoucan see,the peakfrequencyforthistrial is1193.24. Almostall of the trialsstayed
on thispeakexceptfortwowhichwere onlyafew Hz off
4. Figure 3: In this graph, the average temperatures as well as the average frequencies are shown.
As you can see, the different temperatures did not affect the frequencies thus forming a
straight linear line with a slope of zero passing through all uncertainty bars.
5. Figure 4: In this graph, the relationship between the average temperatures of probes 1 and 2
and the average frequencies are shown. As explained earlier, the average temperatures for
probe 1 and 2 were taken to see if the exclusion of probe 3 had any effect on the final results.
As a result, the exclusion of probe 3 didn’t have any effect on the final result as the line in the
graph stayed linear with a slope of zero.
6. Conclusion
As a result of the data that was gathered throughout the experiment, the final results were very
different from what was expected and predicted. After all the data was gathered, averages of
temperatures and frequencies were made and put into tables and graphs for a better
understanding of the data. When the data was put into the graph, there was no noticeable
change in the data. As shown in figures 3 and 4, a straight linear line with a slope of zero was
formed for all the data found thus concluding that all the data was constant. It can also be
determined that the data was constant as well as fairly accurate because the line goes through
all five relatively small uncertainty bars. As a result of the data found, our theory and prediction
were not supported. The ideal line in terms of the original theory was supposed to have a slope
because as one increases, the other must decrease and vice versa. However the final graph
formed did not support this theory at all. It can be concluded that the temperature of the water
in a wine glass does not affect the resonant frequency of the wine glass when rung. Although
this is a perfectly good result, it doesn’t mean that the same results will be achieved with higher
quality materials and lower limitations. It can be inferred that if given far lower and far higher
temperatures, and better instruments, a change could be found and a slope could be achieved
in the final graph.
I believe that there is a high level of confidence in this experiment. The fact that the line in the
final graph passed through all five points and ran through all five relatively small uncertainty
bars chows that the data was reliable and accurate. I am confident with my data that this exact
experiment could be conducted elsewhere in the world and they would get more or less the
exact same constant trend in their data.
I believe that this data can be universally applicable to anyone in the world however only to a
certain extent. The temperatures used in the experiment ranged from 20 C to about 60 C; as
these are real temperatures of liquid that one may possess in their wine glass any normal day
that this can be universally applicable to anyone. However, the use of extremely high and
extremely low temperatures may not be achievable or accessible to some people. Therefore
this experiment is universally applicable to a certain extent.
7. Evaluation
There were a few places in which this experiment could have gone better during the entire
process. First, the temperature of the room was always altering when students turned the air
conditioning on and off. As a result of this, the changing room temperature could have affected
the data results. Second, during the experiment, the actual temperature of the water was not
recorded with a thermometer. Instead we relied on the surface temperature probes. If the
temperature was taken directly from the water then that could have given us a better sense of
accuracy when measuring the temperature of the water.
Further Research
Some suggestions for further research in this field would require the achievement of extremely
high temperatures and extremely low temperatures. This would allow one to find out if
temperature really does have an effect on the frequency of a wine glass. Another suggestion
could be different shaped wine glasses. This could further expand one’s understanding of the
wine glass as oppose to the different temperatures.