Springboro Schools
•
1 recomendación•520 vistas

Data from the Ohio Department of Education website regarding the performance of Springboro schools.

Recomendados
Más contenido relacionado
Destacado
Destacado (17)
Más de David Bowman
Springboro Schools
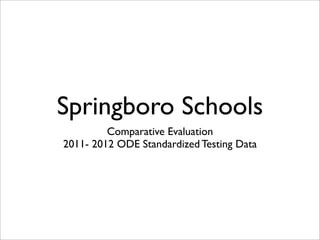
- 1. Springboro Schools Comparative Evaluation 2011- 2012 ODE Standardized Testing Data
- 2. What data is presented? • The source data is taken from The Ohio Department of Education Website. The test data comes from preliminary district, traditional school, community school, and STEM school results on Ohio’s 2011-2012 state tests. • The source data used can be found on the Ohio Department of Education website - http://education.ohio.gov/GD/Templates/Pages/ ODE/ODEDetail.aspx?page=3&TopicRelationID=1&ContentID=131230 • The data is based on standardized tests used to measure performance of districts relative to state standards and other schools in the state. • This presentation takes a subset of that data, comparing Springboro schools to the leading public school in the region, Ohio public schools overall, Ohio Charter Schools that do not serve low income populations, and Ohio Charter Schools overall.
- 3. Springboro compared to: • Oakwood: The top ranked district in the region, and widely recognized as a high performing public school district. Oakwood is significantly smaller than Springboro, but similar in average household income. This offers a benchmark against a top performing district. • Ohio Public School Average: The mean average of all Ohio Public School Districts. This offers a comparison of how Springboro performs relative to all public districts. • OH Charter LP: This is the average of test results gathered on Ohio charter schools that specifically have low rates of poverty, meaning that they are not designed to serve poor areas. Many charter schools serve challenged areas, and this subset provides a metric for the performance of charter schools that are focused on areas where poverty is not a major factor. • Ohio Charter: This is the mean average of data collected from all charter schools in the State of Ohio.
- 4. Questions To Ask As You Review The Data
- 5. How does Springboro perform relative to the leading district in the region?
- 6. How does Springboro perform relative to the average Ohio public school district?
- 7. How does Springboro perform relative to charter schools that do not focus on serving impoverished areas and charter schools overall?
- 8. Grade 3 Reading OAA Springboro 95.2 Oakwood 97.2 OH Public 84.9 OH LP Charter 82.7 Ohio Charter 60 0 25 50 75 100
- 9. Grade 3 Math OAA Springboro 93.7 Oakwood 95 OH Public 84.6 OH LP Charter 79.6 Ohio Charter 60.3 0 25 50 75 100
- 10. Grade 4 Reading OAA Springboro 96.3 Oakwood 99.4 Centerville 92.9 OH Public 87.7 OH LP Charter 80.1 Ohio Charter 0 25 50 75 100
- 11. Grade 4 Math OAA Springboro 93.5 Oakwood 97 OH Public 83.2 OH LP Charter 74.9 Ohio Charter 55.8 0 25 50 75 100
- 12. Grade 5 Reading OAA Springboro 91.3 Oakwood 93.1 OH Public 81.1 OH LP Charter 80.3 Ohio Charter 55.7 0 25 50 75 100
- 13. Grade 5 Math OAA Springboro 88 Oakwood 90.4 OH Public 72.4 OH LP Charter 70.1 Ohio Charter 41.5 0 25 50 75 100
- 14. Grade 5 Science OAA Springboro 87.2 Oakwood 94.3 OH Public 78.7 OH LP Charter 78.1 Ohio Charter 44.6 0 25 50 75 100
- 15. Grade 6 Reading OAA Springboro 97.4 Oakwood 98.9 OH Public 89.9 OH LP Charter 83.7 Ohio Charter 73.7 0 25 50 75 100
- 16. Grade 6 Math OAA Springboro 94.4 Oakwood 96.2 OH Public 84.6 OH LP Charter 77.7 Ohio Charter 59.3 0 25 50 75 100
- 17. Grade 7 Reading OAA Springboro 92.2 Oakwood 95.4 OH Public 83.6 OH LP Charter 79.2 Ohio Charter 62.7 0 25 50 75 100
- 18. Grade 7 Math OAA Springboro 89.5 Oakwood 94.2 OH Public 78.7 OH LP Charter 71 Ohio Charter 50.8 0 25 50 75 100
- 19. Grade 8 Reading OAA Springboro 95.2 Oakwood 97.2 OH Public 84.9 OH LP Charter 82.7 Ohio Charter 60 0 25 50 75 100
- 20. Grade 8 Math OAA Springboro 93.7 Oakwood 96.5 OH Public 84.4 OH LP Charter 66.4 Ohio Charter 60.4 0 25 50 75 100
- 21. Grade 8 Science OAA Springboro 88.2 Oakwood 96.6 OH Public 77.9 OH LP Charter 46.3 Ohio Charter 42.3 0 25 50 75 100
- 22. Ohio Graduation Test Reading (Grade 10) Springboro 97.7 Oakwood 98.8 OH Public 89.3 OH LP Charter 74.3 Ohio Charter 71.4 0 25 50 75 100
- 23. Ohio Graduation Test Writing (Grade 10) Springboro 97.7 Oakwood 97.5 OH Public 90.1 OH LP Charter 70.5 Ohio Charter 70 0 25 50 75 100
- 24. Ohio Graduation Test Math (Grade 10) Springboro 97.2 Oakwood 97.5 OH Public 87.3 OH LP Charter 69.3 Ohio Charter 58.2 0 25 50 75 100
- 25. Ohio Graduation Test Science (Grade 10) Springboro 95.9 Oakwood 97.5 OH Public 82.2 OH LP Charter 51.2 Ohio Charter 49.3 0 25 50 75 100
- 26. Ohio Graduation Test Social Studies (Grade 10) Springboro 94.8 Oakwood 97.5 OH Public 86.1 OH LP Charter 44.9 Ohio Charter 56.9 0 25 50 75 100
- 27. Ohio Graduation Test Reading (Grade 11) Springboro 99.2 Oakwood 99.4 OH Public 95.4 OH LP Charter 88.7 Ohio Charter 79.4 0 25 50 75 100
- 28. Ohio Graduation Test Writing (Grade 11) Springboro 98.9 Oakwood 99.4 OH Public 95.7 OH LP Charter 82.6 Ohio Charter 79.6 0 25 50 75 100
- 29. Ohio Graduation Test Math (Grade 11) Springboro 98.6 Oakwood 100 OH Public 94 OH LP Charter 77.6 Ohio Charter 69.5 0 25 50 75 100
- 30. Ohio Graduation Test Science (Grade 11) Springboro 98.3 Oakwood 99.4 OH Public 91.1 OH LP Charter 72.8 Ohio Charter 61 0 25 50 75 100
- 31. Ohio Graduation Test Social Studies (Grade 11) Springboro 98.6 Oakwood 99.4 OH Public 92.1 OH LP Charter 78.5 Ohio Charter 67.4 0 25 50 75 100
- 32. Percent of State Indicators Met Springboro 100 Oakwood 100 OH Public 85.4 OH LP Charter 40.9 Ohio Charter 31.5 0 25 50 75 100
- 33. Performance Index Springboro 107.2 Oakwood 109.8 OH Public 99.2 OH LP Charter 87.7 Ohio Charter 78.2 0 27.5 55 82.5 110
- 34. More questions
- 35. Does Springboro have serious educational issues or do we perform on par with leading districts?
- 36. Will charter schools strengthen Springboro schools or weaken them?
- 37. Is exploring charter schools a wise investment of taxpayer money or could that money be better spent on strengthening our current school system?