
Recomendados
Recomendados
Más contenido relacionado
La actualidad más candente
La actualidad más candente (20)
Similar a operatingmodelandorganizationdesigntoolkit-overviewandapproach-211220031125.pdf
Similar a operatingmodelandorganizationdesigntoolkit-overviewandapproach-211220031125.pdf (20)
Último
Último (20)
operatingmodelandorganizationdesigntoolkit-overviewandapproach-211220031125.pdf
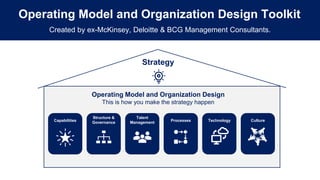
- 1. Operating Model and Organization Design Toolkit Created by ex-McKinsey, Deloitte & BCG Management Consultants. Operating Model and Organization Design This is how you make the strategy happen Strategy Capabilities Structure & Governance Talent Management Processes Technology Culture
- 2. Introduction 2 “This Toolkit was created by ex-McKinsey, Deloitte and BCG Management Consultants after more than 3,000 hours of work. It shares our combined 100+ years of experience advising executive teams around the world. It includes all the Frameworks, Best Practices & Templates required to successfully implement an operating model and organization design initiative, and make your strategy happen. Leverage the know-how of ex-McKinsey, Deloitte & BCG Management Consultants. Join the 200,000+ Executives, Consultants & Entrepreneurs who are already leveraging our Business & Consulting Toolkits to improve the performance of their organization and boost their own career. If you have any questions, send us an email at sales@slidebooks.com and one of our ex-McKinsey, Deloitte & BCG Management Consultants will get back to you within 2 business days.” Aurelien Domont Management Consultant Slidebooks Consulting Managing Director
- 3. This Slideshare Powerpoint presentation is only a small preview of our Toolkit. You can download the entire Toolkit in Powerpoint and Excel at www.slidebooks.com 3 www.slidebooks.com
- 4. Context 4 In a time of economic turbulence, disruptive technology, globalization, and unprecedentedly fierce competition, having a great operating model and organization design is becoming more important that ever. A great operating model and organization design will help you: • Make your strategy happen • Boost your company’s performance • Adapt to the changing conditions • Change the trajectory of your business • Improve coordination and decision-making • Improve risk management Companies without the right operating model and organization design often experience the following challenges: • Operational inefficiencies as people expend effort in areas not aligned with the strategic plan • Ambiguity around accountabilities, roles and responsibilities, slowing down the decision-making process. • Low interaction and integration between divisional units and functional areas, as it is unclear to people how they should cross these implicit boundaries • Increased or sustained operating risks due to the absence of clear principles, roles, responsibilities and processes
- 5. Problem 5 In a survey conducted by The Boston Consulting Group, almost 80% of respondent companies reported under-going a recent reorganization exercise (in about half of those cases, a large-scale, enterprise-wide reorganization initiative). However, survey respondents rated fewer than half of the reorganization efforts as successful. The underlying reason for such a low success rate: all too often, the companies’ leaders relied on complex organizational frameworks that have become outmoded and ineffective in today’s business environment.
- 6. Our solution Our ex-McKinsey, Deloitte and BCG management consultants decided to create an Operating Model and Organization Design Toolkit that will help you make the strategy of your organization happen (or your client’s strategy if you are a management consultant). 6 Toolkit Tools Templates Step-by-step Tutorials Real-life Examples Best Practices Support from Tier-1 Management Consultants Frameworks The Operating Model and Organization Design Toolkit includes:
- 7. Objectives The Operating Model and Organization Design Toolkit includes frameworks, tools, templates, tutorials, real-life examples and best practices to help you: 7 • Make your strategy happen in order to boost your company’s performance • Successfully implement an operating model and organization design initiative with our simple and comprehensive 3-phase approach: (I) Carry out a Business Case for change, (II) Assess Current State & Design Future State, (III) Define Roadmap and Implement • (I) Carry out a Business Case for change: (1) Business opportunity & suggested solution, (2) Project objectives, scope & approach, (3) Project deliverables & business outcomes, (4) Strategic alignment, (5) Dependencies & constraints, (6) Risk assessment & mitigation, (7) Change impact assessment, (8) Project costs, (9) Benefits, (10)Net present value, (11) Key success factors & KPIs • (II) Assess Current State & Design Future State: (1) Capabilities, (2) Structure and governance, (3) Talent management, (4) Processes, (5) Technology, (6) Culture, (7) Executive summary, (8) Updated Business case • (III) Define Roadmap and Implement: (1) Roadmap to reach the target state, (2) Programs and projects governance, (3) Project initiation, (4) Project implementation, (5) Post project evaluation
- 8. Framework The Operating Model and Organization Design Toolkit focuses on 6 components that will help you make your strategy happen 8 Operating Model and Organization Design This is how you make the strategy happen Strategy Capabilities Structure & Governance Talent Management Processes Technology Culture
- 9. 3-Phase Approach The Operating Model and Organization Design Toolkit includes a 3-Phase Approach that we built and refined over the past 20 years, by constant trial and error. The good news is that you don’t have to waste your time, energy and money going through that lengthy trial-and- error process. You can simply leverage our work and customize it based on the specificities of your organization. 9 Phase I: Carry out a Business Case for change Phase II: Assess Current state & Design Future State Phase III: Define Roadmap and Implement 1. Business opportunity & suggested solution 2. Project objectives, scope & approach 3. Project deliverables & business outcomes 4. Strategic alignment 5. Dependencies & constraints 6. Risk assessment & mitigation 7. Change impact assessment 8. Project costs 9. Benefits 10.Net present value 11.Key success factors & KPIs 1. Capabilities 2. Structure and governance 3. Talent management 4. Processes 5. Technology 6. Culture 7. Executive summary 8. Updated Business case 1. Roadmap to reach the target state 2. Programs and projects governance 3. Project initiation 4. Project implementation 5. Post project evaluation
- 10. Guide 10 You can directly use our deliverables for your own purposes. You’ll simply have to insert your logo and adjust the slides based on the specificities of your organization. Please note that our deliverables also include many slides with best practices, tutorials, and real-life examples to help you make the necessary adjustments based on the specificities of your organization. These slides includes an orange rectangle on their top right corner. You may decide to delete these slides as they are mainly here to help you fill in the rest of the deliverable. Before you do so, copy paste this document, so you always have the original version in case you need it.
- 11. In the next slides, you’ll see a small preview of the Phase I 11 Phase I: Carry out a Business Case for change Phase II: Assess Current state & design future state Phase III: Implement 1. Business opportunity & suggested solution 2. Project objectives, scope & approach 3. Project deliverables & business outcomes 4. Strategic alignment 5. Dependencies & constraints 6. Risk assessment & mitigation 7. Change impact assessment 8. Project costs 9. Benefits 10.Net present value 11.Key success factors & KPIs 1. Capabilities 2. Structure and governance 3. Talent management 4. Processes 5. Technology 6. Culture 7. Overarching current state and target state 8. Updated Business case 1. Roadmap to reach the target state 2. Programs and projects governance 3. Project initiation 4. Project implementation 5. Post project evaluation
- 12. Change Impact High Impact Net Present Value $8M Number of Resources 12 Change Manager John Doe Cash Flow (US $ millions) Project Sponsor John Doe Intangible Benefits Insert your own text Project Costs $4M Tangible Benefits $14M Project Manager John Doe Strategic Alignment Insert the Strategic Objectives that the project is aligned with Lean Business Case Project name: Project description: 12 (5.1) 1.8 4.6 6.9 9.9 Year 1 Year 2 Year 3 Year 4 Year 5 This Lean Business Case is very important, as your CEO and Senior executives may not have time to deep dive into more details. It is the first section of the Business Case, but it is often done at the end.
- 13. See below 4 screenshots from the Phase I. 13 Driver Tree Simple Financial Model Project Cash Flow Sophisticated Financial Model
- 14. In the next slides, you’ll see a small preview of the Phase II 14 Phase I: Carry out a Business Case for change Phase II: Assess Current state & design future state Phase III: Implement 1. Business opportunity & suggested solution 2. Project objectives, scope & approach 3. Project deliverables & business outcomes 4. Strategic alignment 5. Dependencies & constraints 6. Risk assessment & mitigation 7. Change impact assessment 8. Project costs 9. Benefits 10.Net present value 11.Key success factors & KPIs 1. Capabilities 2. Structure and governance 3. Talent management 4. Processes 5. Technology 6. Culture 7. Overarching current state and target state 8. Updated Business case 1. Roadmap to reach the target state 2. Programs and projects governance 3. Project initiation 4. Project implementation 5. Post project evaluation
- 15. In the next slides, you’ll see a small preview of the Phase II 15 Phase I: Carry out a Business Case for change Phase II: Assess Current state & design future state Phase III: Implement 1. Business opportunity & suggested solution 2. Project objectives, scope & approach 3. Project deliverables & business outcomes 4. Strategic alignment 5. Dependencies & constraints 6. Risk assessment & mitigation 7. Change impact assessment 8. Project costs 9. Benefits 10.Net present value 11.Key success factors & KPIs 1. Capabilities 2. Structure and governance 3. Talent management 4. Processes 5. Technology 6. Culture 7. Overarching current state and target state 8. Updated Business case 1. Roadmap to reach the target state 2. Programs and projects governance 3. Project initiation 4. Project implementation 5. Post project evaluation
- 16. To be able to deliver on our new strategy, we need to master the following 5 core capabilities 16 Mission & Vision Mission: Vision: Core Capabilities Description Replace by your own text Replace by your own text Replace by your own text Replace by your own text Replace by your own text Replace by your own text Replace by your own text Replace by your own text Replace by your own text Replace by your own text Additional template with 5 core capabilities
- 17. To be able to deliver on our new strategy, we need to master the following 5 core capabilities 17 Mission & Vision Mission: Vision: Core Capabilities Description Understanding consumers Creating and building brands Partnering an going to market with consumers and suppliers Really knowing the consumers, and covering their unmet needs, and designing solutions for them better than any competitor can. Launching and cultivating brands with powerful consumer value equations for true longevity in the marketplace. Being the partner of choice by virtue of P&G's willingness to work together on joint business plans and to share joint value creation Innovating R&G with the aim of advancing materials science and invent breakthrough single new products, but also taking an innovative approach to business models. Leveraging global scale Operating as one company to maximize buying power, cross brand synergies, and development of globally replicable capabilities Real-life example from the company Procter and Gamble
- 18. In the next slides, you’ll see a small preview of the Phase II 18 Phase I: Carry out a Business Case for change Phase II: Assess Current state & design future state Phase III: Implement 1. Business opportunity & suggested solution 2. Project objectives, scope & approach 3. Project deliverables & business outcomes 4. Strategic alignment 5. Dependencies & constraints 6. Risk assessment & mitigation 7. Change impact assessment 8. Project costs 9. Benefits 10.Net present value 11.Key success factors & KPIs 1. Capabilities 2. Structure and governance 3. Talent management 4. Processes 5. Technology 6. Culture 7. Overarching current state and target state 8. Updated Business case 1. Roadmap to reach the target state 2. Programs and projects governance 3. Project initiation 4. Project implementation 5. Post project evaluation
- 19. Potential Structure Options We are considering 6 types of organizational structures for our target state 19 Functional Structure CEO Strategy production Marketing Sales Product-based Structure Geographic-based Structure CEO Cars Battery storages Solar Roofs Strategy Product Marketing Sales Strategy Product Marketing Sales Strategy Product Marketing Sales CEO Asia Europe North America Strategy Product Marketing Sales Strategy Product Marketing Sales Strategy Product Marketing Sales Process-based Structure CEO Exploration Refining Distribution Customer-based Structure CEO Urgent care Emergency care Inpatient care Human resources Finance Community relations Strategy Product Marketing Sales Strategy Product Marketing Sales Matrix Structure (e.g. Products x Geographic-based) CEO Cars Battery storages Solar Roofs America Europe Asia
- 20. Potential Structure Options Zoom on the Functional Structure 20 Functional Structure Appropriate for Advantages Disadvantages • Organisations which sell a low price product and need to keep costs down • Organisations with stable, undifferentiated markets • Organisations with well- understood customer requirements • Organisations with one or two product lines • Organisations with long product development lifecycles • Organisations where there is minimal need for interdependency between functions • Resource efficient and maximises margins through leveraging economies of scale and functional expertise • Clear functional divisions drive strong accountability and control by function • Drives common standards, collaboration, specialism and attention to quality within each function • Supports common culture and values • Less responsive and adaptive to market and customer needs • Hierarchy and bureaucracy can become rigid and stifling • Communication between divisions can be limited and inadequate leading to silo mentality • Interdepartmental conflict can occur
- 21. In the next slides, you’ll see a small preview of the Phase II 21 Phase I: Carry out a Business Case for change Phase II: Assess Current state & design future state Phase III: Implement 1. Business opportunity & suggested solution 2. Project objectives, scope & approach 3. Project deliverables & business outcomes 4. Strategic alignment 5. Dependencies & constraints 6. Risk assessment & mitigation 7. Change impact assessment 8. Project costs 9. Benefits 10.Net present value 11.Key success factors & KPIs 1. Capabilities 2. Structure and governance 3. Talent management 4. Processes 5. Technology 6. Culture 7. Overarching current state and target state 8. Updated Business case 1. Roadmap to reach the target state 2. Programs and projects governance 3. Project initiation 4. Project implementation 5. Post project evaluation
- 22. Table of Contents 22 Recruitment Performance Management Leadership Development Competency Management Mentoring Reward and Recognition Reassignment or Termination of Employment Succession Planning
- 23. Recruitment 23 Our new talent management practices will naturally help to improve our organization's reputation as a great employer. One that treats its staff well, recognizes and builds talent, and provides advancement opportunities. Our competency management practices will also help us identify the competencies that we need to successfully enable our strategy. We will teach our managers to be “Talent-minded” managers and keep an eye out for potential new team members, and to be much more interested and involved in recruitment and hiring practices. To facilitate and standardized the hiring, we also created a Role Profile Template (see next slides), which can be used across the organization.
- 24. For each role, we created a Role Profile to capture individual responsibilities, accountabilities, metrics and reporting arrangements. 24 A Role Profile provides clarity on what is expected of people in specific roles. The Role Profile helps to ensure that roles and expectations are clearly communicated and understood by everyone in the organisation. Using a Role Profile template to define roles also drives consistency in the articulation of roles across the organisation. In the next slide, you’ll see the Role Profile Template that we decided to create for our Organization.
- 25. Role Profile Template 25 Role summary Key activities Key performance indicators Other comments Enter the name of the role / job title Role Enter your own text Reports to Enter your own text Business Unit Insert in this box the key aspects of the role. Ensure this is specific about the role and doesn’t describe general business deliverables. Focus on the outputs of the role and the impact the role has on achieving business objectives Insert your own text Try to follow a logical sequence. If there is a shared responsibility, mention it in brackets. For each activity, start by a verb, describe what is done, and why it is done. Examples: Scope of the role: International, National Regional Location: New York Enter Change Canvas version & submit date Current incumbent
- 26. Balanced Scorecard Description 26 C1 - Insert text C2 - Insert text C3 - Insert text C4 - Insert text I1 - Insert text I2 - Insert text I3 - Insert text I4 - Insert text L1 - Insert text L2 - Insert text L3 - Insert text L4 - Insert text F1 - Insert text F2 - Insert text F3 - Insert text F4 - Insert text Strategic Objectives Key Performance Indicators C1 - Insert text C2 - Insert text C3 - Insert text C4 - Insert text I1 - Insert text I2 - Insert text I3 - Insert text I4 - Insert text L1 - Insert text L2 - Insert text L3 - Insert text L4 - Insert text F1 - Insert text F2 - Insert text F3 - Insert text F4 - Insert text Targets C1 - Insert text C2 - Insert text C3 - Insert text C4 - Insert text I1 - Insert text I2 - Insert text I3 - Insert text I4 - Insert text L1 - Insert text L2 - Insert text L3 - Insert text L4 - Insert text F1 - Insert text F2 - Insert text F3 - Insert text F4 - Insert text Financial To satisfy our shareholders, what financial objectives must we accomplish? Perspective Customer To achieve our financial objectives, what customer needs must we serve? Internal processes To satisfy our customers and shareholders, in which internal business processes must we excel?” Learning & Growth To achieve our “Financial”, “Customer” and “Internal Processes” strategic objectives, what does the organization need to learn? A Balanced Scorecard includes 4 perspectives
- 27. Balanced Scorecard Description 27 C1 Insert your own text C2 Insert your own text C3 Insert your own text I1 Insert your own text I2 Insert your own text I3 Insert your own text L1 Insert your own text L2 Insert your own text L3 Insert your own text F1 Increase earnings per share F2 Increase revenue per customer F3 Reduce cost per customer Strategic Objectives Key Performance Indicators C1 Insert your own text C2 Insert your own text C3 Insert your own text I1 Insert your own text I2 Insert your own text I3 Insert your own text L1 Insert your own text L2 Insert your own text L3 Insert your own text F1 Net income per share (vs. last year) F2 Revenue per customer F3 Cost per customer Targets C1 Insert figure C2 Insert figure C3 Insert figure I1 Insert figure I2 Insert figure I3 Insert figure L1 Insert figure L2 Insert figure L3 Insert figure F1 +$100M F2 $300 F3 $75 Financial To satisfy our shareholders, what financial objectives must we accomplish? Perspective Customer To achieve our financial objectives, what customer needs must we serve? Internal processes To satisfy our customers and shareholders, in which internal business processes must we excel?” Learning & Growth To achieve our “Financial”, “Customer” and “Internal Processes” strategic objectives, what does the organization need to learn? Each perspective has specific Strategic Objectives, Key Performance Indicators & Targets
- 28. In the next slides, you’ll see a small preview of the Phase II 28 Phase I: Carry out a Business Case for change Phase II: Assess Current state & design future state Phase III: Implement 1. Business opportunity & suggested solution 2. Project objectives, scope & approach 3. Project deliverables & business outcomes 4. Strategic alignment 5. Dependencies & constraints 6. Risk assessment & mitigation 7. Change impact assessment 8. Project costs 9. Benefits 10.Net present value 11.Key success factors & KPIs 1. Capabilities 2. Structure and governance 3. Talent management 4. Processes 5. Technology 6. Culture 7. Overarching current state and target state 8. Updated Business case 1. Roadmap to reach the target state 2. Programs and projects governance 3. Project initiation 4. Project implementation 5. Post project evaluation
- 29. Replace this text by the name of your key Process #1 Current state 29 stakeholders Process steps (activities) CEO Director Insert name Insert name Insert name Insert name Insert name Activity Activity Activity Activity Activity Activity Activity Demonstrated effectiveness: Low Medium High Key findings (e.g. pain points, areas of improvement): Insert your own text
- 30. In the next slides, you’ll see a small preview of the Phase II 30 Phase I: Carry out a Business Case for change Phase II: Assess Current state & design future state Phase III: Implement 1. Business opportunity & suggested solution 2. Project objectives, scope & approach 3. Project deliverables & business outcomes 4. Strategic alignment 5. Dependencies & constraints 6. Risk assessment & mitigation 7. Change impact assessment 8. Project costs 9. Benefits 10.Net present value 11.Key success factors & KPIs 1. Capabilities 2. Structure and governance 3. Talent management 4. Processes 5. Technology 6. Culture 7. Overarching current state and target state 8. Updated Business case 1. Roadmap to reach the target state 2. Programs and projects governance 3. Project initiation 4. Project implementation 5. Post project evaluation
- 31. Technologies required to fully enable our strategy 31 Digital Marketing 3-D Printing Drones Robots Virtual Reality Big Data Artificial Intelligence Cloud Computing Cyber Security Blockchain Internet of Things Augmented reality
- 32. Why are we considering the Big Data for our organization? 32 Big data is a term that describes the large volume of data, both structured and unstructured, that inundates a business on a day-to-day basis. But it’s not the amount of data that’s important. It is what organizations do with the data that matters. Big data can be analyzed for insights that lead to better tactical and strategical decisions. While the term “big data” is relatively new, the act of gathering and storing large amounts of information for eventual analysis is ages old. The concept gained momentum in the early 2000s when industry analyst Doug Laney articulated the now-mainstream definition of big data as the three Vs: • Volume: Organizations collect data from a variety of sources, including business transactions, social media and information from sensor or machine-to-machine data. In the past, storing it would’ve been a problem, but today, new technologies have eased the challenge. • Velocity: Data streams in at an unprecedented speed and must be dealt with in a timely manner. RFID tags, sensors and smart metering are driving the need to deal with torrents of data in near-real time. • Variety: Data comes in all types of formats, from structured, numeric data in traditional databases to unstructured text documents, email, video, audio, stock ticker data and financial transactions. The amount of data in our world has been exploding, and analyzing large data sets will become a key basis of competition, underpinning new waves of productivity growth, innovation, and consumer surplus, according to research by MGI and McKinsey's Business Technology Office.
- 33. Examples of industry using Big Data 33 Government Manufacturing Banking Health care Retail Education With large amounts of information streaming in from countless sources, banks are faced with finding new and innovative ways to manage big data. Big Data and Analytics help banks better understand customers and minimize risk. Big data brings big insights, but it also requires financial institutions to stay one step ahead of the game with advanced analytics. Educators armed with data-driven insight can make a significant impact on school systems, students and curriculums. By analyzing big data, they can identify at- risk students, make sure students are making adequate progress, and can implement a better system for evaluation and support of teachers and principals. When government agencies are able to harness and apply analytics to their big data, they gain significant ground when it comes to managing utilities, running agencies, dealing with traffic congestion or preventing crime. But while there are many advantages to big data, governments must also address issues of transparency and privacy. Patient records. Treatment plans. Prescription information. When it comes to health care, everything needs to be done quickly, accurately, and, in some cases, with enough transparency to satisfy stringent industry regulations. When big data is managed effectively, health care providers can uncover hidden insights that improve patient care. Armed with insight that big data can provide, manufacturers can boost quality and output while minimizing waste – processes that are key in today’s highly competitive market. More and more manufacturers are working in an analytics-based culture, which means they can solve problems faster and make more agile business decisions. Customer relationship building is critical to the retail industry – and the best way to manage that is to manage big data. Retailers need to know the best way to market to customers, the most effective way to handle transactions, and the most strategic way to bring back lapsed business. Big data remains at the heart of all those things.
- 34. In the next slides, you’ll see a small preview of the Phase II 34 Phase I: Carry out a Business Case for change Phase II: Assess Current state & design future state Phase III: Implement 1. Business opportunity & suggested solution 2. Project objectives, scope & approach 3. Project deliverables & business outcomes 4. Strategic alignment 5. Dependencies & constraints 6. Risk assessment & mitigation 7. Change impact assessment 8. Project costs 9. Benefits 10.Net present value 11.Key success factors & KPIs 1. Capabilities 2. Structure and governance 3. Talent management 4. Processes 5. Technology 6. Culture 7. Overarching current state and target state 8. Updated Business case 1. Roadmap to reach the target state 2. Programs and projects governance 3. Project initiation 4. Project implementation 5. Post project evaluation
- 35. A high organization culture score correlates with a high business performance 35 (1) Performance of 26 companies relative to EuroStoxx Sectorindex. Result >0 means outperformance. Considered time interval: 10 years (2) Results of an analysis of company values performance, researched jointly by Bertelsmann foundation and Booz & Company Organizational Culture Score 2) Higher Performers “Middle of the Road” Underperformers Indexed EBIT Performance (1) -1 -0,8 -0,6 -0,4 -0,2 +0,2 +0,4 +0,6 +0,8 +1 60 65 70 75 80 85 High Average Low Correlation between organizational culture score and Company Peer Business Performance
- 36. Our Target State can be summarized by 5 key Cultural Characteristics that will help us deliver on the strategy 36 Insert your own text Insert your own text Insert your own text Insert your own text Insert your own text
- 37. Our Target State can be summarized by 5 key Cultural Characteristics that will help us deliver on the strategy 37 Bold Commercially Savvy Networked Agile Customer Centric Real-life example from a global insurance company
- 38. In the next slides, you’ll see a small preview of the Phase III 38 Phase I: Carry out a Business Case for change Phase II: Assess Current state & design future state Phase III: Implement 1. Business opportunity & suggested solution 2. Project objectives, scope & approach 3. Project deliverables & business outcomes 4. Strategic alignment 5. Dependencies & constraints 6. Risk assessment & mitigation 7. Change impact assessment 8. Project costs 9. Benefits 10.Net present value 11.Key success factors & KPIs 1. Capabilities 2. Structure and governance 3. Talent management 4. Processes 5. Technology 6. Culture 7. Overarching current state and target state 8. Updated Business case 1. Roadmap to reach the target state 2. Programs and projects governance 3. Project initiation 4. Project implementation 5. Post project evaluation
- 39. Governance model to define and implement our Target Operating Model and Organization Design 39 Program Portfolio Director Insert name Program Manager Structure & Governance Insert name Program Manager Talent Management Insert name Program Manager Processes Insert name Program Manager Technology Insert name Program Manager Culture Insert name Program Manager Capability Insert name Executive Sponsor CEO Project [insert project name]: • PM: Insert name • CM: Insert name • SMEs: Insert names Project [insert project name]: • PM: Insert name • CM: Insert name • SMEs: Insert names Project [insert project name]: • PM: Insert name • CM: Insert name • SMEs: Insert names Project [insert project name]: • PM: Insert name • CM: Insert name • SMEs: Insert names Project [insert project name]: • PM: Insert name • CM: Insert name • SMEs: Insert names Project [insert project name]: • PM: Insert name • CM: Insert name • SMEs: Insert names Project [insert project name]: • PM: Insert name • CM: Insert name • SMEs: Insert names Project [insert project name]: • PM: Insert name • CM: Insert name • SMEs: Insert names Project [insert project name]: • PM: Insert name • CM: Insert name • SMEs: Insert names Project [insert project name]: • PM: Insert name • CM: Insert name • SMEs: Insert names Project [insert project name]: • PM: Insert name • CM: Insert name • SMEs: Insert names Project [insert project name]: • PM: Insert name • CM: Insert name • SMEs: Insert names Project [insert project name]: • PM: Insert name • CM: Insert name • SMEs: Insert names Project [insert project name]: • PM: Insert name • CM: Insert name • SMEs: Insert names Project [insert project name]: • PM: Insert name • CM: Insert name • SMEs: Insert names Project [insert project name]: • PM: Insert name • CM: Insert name • SMEs: Insert names Project [insert project name]: • PM: Insert name • CM: Insert name • SMEs: Insert names Project [insert project name]: • PM: Insert name • CM: Insert name • SMEs: Insert names Caption: PM: Project Manager CM: Change Manager SMEs: Subject Matter Experts Please note that a program portfolio includes multiple programs. And a program includes multiple projects/initiatives
- 40. Culture Implementation Roadmap 40 Week Owner Due date Status 1 2 3 4 5 6 7 8 9 10 11 … Involve as many stakeholders as possible during the new corporate culture design phase AD Mar 31 On Track Present the new culture to the Leadership team AD Mar 21 On Track Present the new culture to the Managers Aurelien F. Mar 21 Done Train the leadership team members to become role model Christian G. Mar 21 Late Train the managers to become role model George P. Mar 21 Done Present the new culture to the entire company George P. Mar 21 On Track Communicate regularly and effectively on the new culture George P. Mar 31 On Track Insert your own text George P. Mar 31 On Track Insert your own text Christian G. Mar 21 Late Insert your own text George P. Mar 21 Done Insert your own text George P. Mar 21 On Track Insert your own text George P. Mar 31 On Track Insert your own text George P. Mar 31 On Track Real-life example
- 41. See below screenshots from the Phase III 41 Overarching Implementation Roadmap in Excel Project Dashboard
- 42. Structure of the Toolkit The Operating Model and Organization Design Toolkit includes 470 Powerpoint slides and 24 Excel sheets categorized in 4 folders that you can download on your device immediately after your purchase. 42 1 2 3 4 Overview and approach Phase I - Carry out a Business Case for change Phase II - Assess Current state & Design Future State Phase III - Define Roadmap and Implement 470 editable Powerpoint slides* 24 editable Excel sheets* + *Please note that the number of Powerpoint slides and Excel sheets listed is the number of unique slides and sheets. For example, a Powerpoint slide that has been duplicated to facilitate the understanding of our clients only count for 1 Powerpoint slide.
- 43. Interested in more than 1 Toolkit? You can access to all our Toolkits for half the price with the Gold Business & Consulting Package www.slidebooks.com Gold Business & Consulting Package Learn More 43
- 44. Key Benefits of our Business & Consulting Toolkits 44 Improve the growth & efficiency of your organization by leveraging Business & Consulting Toolkits created by ex-McKinsey, Deloitte & BCG Consultants. It cost us $1.7M to create all our Business & Consulting Toolkits. Get them for a fraction of this cost. It’s like hiring Management Consultants to create all the practical Frameworks, Tools & Templates required to get a competitive advantage. Get the job done quicker and never start from scratch again with our ready-made & fully editable Frameworks, Tools & Templates in Powerpoint & Excel. We have worked 20,000+ hours over the past 5 years to create the world’s best Business & Consulting Toolkits. Don’t reinvent the wheel. Download now. Improve your skills & capabilities and meet your professional goals by learning how the Fortune 100 and Global Consulting Firms do it. Get free support and advice from our ex-McKinsey, Deloitte & BCG Management Consultants. Hiring top-tier Consultants for a management consulting project would cost you $300k+. A lot more expensive than purchasing our Toolkits. Impress your stakeholders and become your organization’s subject matter expert with world-class approaches to resolve common business problems.
- 45. What our clients say about our Toolkits Review imported from Facebooks, Amazon and Klaviyo 45 See more reviews >
- 46. 46 Trusted by small and large organizations Customer satisfaction Number of countries leveraging our Business & Consulting Toolkits 160+ Number of professionals leveraging our Business & Consulting Toolkits 200,000+ 4.8 Daily rate of our ex-McKinsey, Deloitte and BCG Management Consultants $3k - $4k Join the 200,000+ Executives, Consultants & Entrepreneurs leveraging our Business & Consulting Toolkits to improve the performance of their organization and boost their own career.
- 47. Need more help? Hire one of our Management Consultants for $3,000 a day See more Management Consultants
- 48. This was only a small preview. www.slidebooks.com 48