
Recomendados
Recomendados
Más contenido relacionado
La actualidad más candente
La actualidad más candente (20)
Destacado
Destacado (20)
Similar a Interpreting Free Body Diagrams
Similar a Interpreting Free Body Diagrams (20)
Último
Último (20)
Interpreting Free Body Diagrams
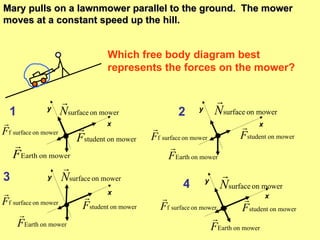
- 1. Mary pulls on a lawnmower parallel to the ground. The mower moves at a constant speed up the hill. 1 3 4 Which free body diagram best represents the forces on the mower? x y x y x y x y 2
- 2. Mary pulls on a lawnmower parallel to the ground. The mower moves at a constant speed up the hill. 1 3 4 Which free body diagram best represents the forces on the mower? x y x y x y x y 2
- 3. Stacey pulls a mower at 40-degrees relative to the ground. 1 2 3 4 Which free body diagram best represents the forces on the mower? x 40 0 y y x 40 0 x y 40 0 y x 40 0
- 4. Stacey pulls a mower at 40-degrees relative to the ground. 1 2 3 4 Which free body diagram best represents the forces on the mower? x 40 0 y y x 40 0 x y 40 0 y x 40 0
- 5. Marsha pulls a sled on ice (no friction). The rope exerts a 150-N force at an angle of 20 0 above horizontal. The mass of the sled and her brother is 45 kg. g = 10 m/s 2 . Stacey represented this situation pictorially and mathematically. Did the student mislabel or forget to include anything? 1 (150 N) should be (150 N) sin 20 o . 2 (150 N) should be (150 N) cos 20 o . 3 Include a +(150 N) sin 20 o term in the y equation. x x : (150 N) = (45 kg) a x y : N – (45 kg)(10 m/s 2 ) = (45 kg) 0 4 Both (1) and (3) need corrections. 5 Both (2) and (3) need corrections.
- 6. Marsha pulls a sled on ice (no friction). The rope exerts a 150-N force at an angle of 20 0 above horizontal. The mass of the sled and her brother is 45 kg. g = 10 m/s 2 . Stacey represented this situation pictorially and mathematically. Did the student mislabel or forget to include anything? 1 (150 N) should be (150 N) sin 20 o . 2 (150 N) should be (150 N) cos 20 o . 3 Include a +(150 N) sin 20 o term in the y equation. x x : (150 N) = (45 kg) a x y : N – (45 kg)(10 m/s 2 ) = (45 kg) 0 4 Both (1) and (3) need corrections. 5 Both (2) and (3) need corrections.
- 7. What are the missing signs? x : (150 N) cos 20 o = (45 kg) a x y : __ N __ (45 kg)(10 m/s 2 ) __ (150 N) sin 20 o = 0 1 + – + 2 + + – 3 – – + 4 – – – 5 + + + Steve pulls a sled on ice (no friction) with a 150-N force at an angle of 20 0 . The mass of the sled and her brother is 45 kg. g = 10 m/s 2 . Stacey represented this pictorially and mathematically. x o
- 8. What are the missing signs? x : (150 N) cos 20 o = (45 kg) a x y : __ N __ (45 kg)(10 m/s 2 ) __ (150 N) sin 20 o = 0 1 + – + 2 + + – 3 – – + 4 – – – 5 + + + Steve pulls a sled on ice (no friction) with a 150-N force at an angle of 20 0 . The mass of the sled and her brother is 45 kg. g = 10 m/s 2 . Stacey represented this pictorially and mathematically. x o
- 9. Which diagram best represents the forces exerted on the car by the Earth and the Earth’s surface? The motion of a car is represented with the motion diagram below. x y 4 o x x y 1 x y 2 x y 3 x y 5
- 10. Which diagram best represents the forces exerted on the car by the Earth and the Earth’s surface? The motion of a car is represented with the motion diagram below. x y 4 o x x y 1 x y 2 x y 3 x y 5
- 13. Which FBD best represents the above motion diagram for a car? x y 2 x y 1 x y 3 x y 4
- 14. Which FBD best represents the above motion diagram for a car? x y 2 x y 1 x y 3 x y 4
- 15. 1 5 Either 2 or 4 are possible 4 2 3 Which motion diagram best represents the situation shown in the free-body diagram?
- 16. 1 5 Either 2 or 4 are possible 4 2 3 Which motion diagram best represents the situation shown in the free-body diagram?
- 17. 1 Which FBD below best represents the forces exerted on the ball as it moves DOWN (ignore air resistance)? 2 3 4
- 18. 1 Which FBD below best represents the forces exerted on the ball as it moves DOWN (ignore air resistance)? 2 3 4
- 19. 1 Which FBD below best represents the forces exerted on the ball at the TOP of its path? 2 3 4 5 No forces are exerted on the ball
- 20. 1 Which FBD below best represents the forces exerted on the ball at the TOP of its path? 2 3 4 5 No forces are exerted on the ball
- 21. x y Which speed versus time chart best represents this situation? 1 2 3 v t v t v t
- 22. x y Which speed versus time chart best represents this situation? 1 2 3 v t v t v t