1. MARKET ANALYSIS > SMARTPHONE APPLICATIONS
Part 1 : Devices
The market of smartphone applications is inevitably linked to the market of devices allowing to
download and to use applications.
It is expected that connections to web sites will mainly be made from smartphones in 2014. The
actual trend is a constant and significant growth of both smartphones and tablets.
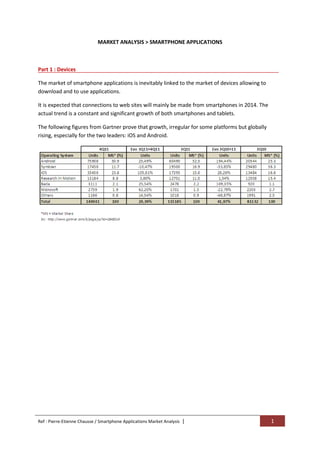
The following figures from Gartner prove that growth, irregular for some platforms but globally
rising, especially for the two leaders: iOS and Android.
Ref : Pierre-Etienne Chausse / Smartphone Applications Market Analysis | 1
2. Part 2 : Operating Systems
Android has recorded an impressive increase of its market share since it has been introduced. It now
accounts for more than half of the global market of operating systems.
iOS with almost 25% market share of the market records a regular increase. Its massive and coherent
innovation and marketing strategy places it in a good position, especially given it acts as a single
player.
Other operating systems occupy a minority share of the market.
Appearing as not as homogenous as iOS, Android imposes itself as the emerging leader, adopted by
most smartphone manufacturers. The distribution of applications is organized in a better way,
leading to a notable increase of the volume of available applications.
The following chart shows how the number of available applications for both iOS and Androïd does
evolve.
700000
600000
500000
400000
Android
300000 IOS
200000
100000
0
01.10
02.10
03.10
04.10
05.10
06.10
07.10
08.10
09.10
10.10
11.10
12.10
01.11
02.11
03.11
04.11
05.11
06.11
07.11
08.11
09.11
10.11
11.11
12.11
01.12
02.12
03.12
04.12
Ref : Pierre-Etienne Chausse / Smartphone Applications Market Analysis | 2
3. Part 3 : Android Applications > Popularity
The success of Android applications depends on the category they belong to, their price (or non price
when they are free) and several various elements (technical characteristics, design,…).
Most (58,60%) applications are downloaded less than 50 times. The distribution of applications by
volume is presented below:
10k-50k 50k-250k >250k
5k-10k
1000-5000
500-1000
<50
100-500
50-100
Less than 25% of applications are distributed more than a 1.000 times.
The global repartition of Free/Paid applications is the following: 70,45% Free Vs 29,55% Paid. The
following chart shows that the popularity of an application is linked to the fact it is free or not. The
most popular applications are free one. More than 99% of applications distributed more than
250.000 times are free.
100,00%
80,00%
60,00%
Paid
40,00%
Free
20,00%
0,00%
Ref : Pierre-Etienne Chausse / Smartphone Applications Market Analysis | 3
4. Part 4 : Android Applications > Categories
In terms of volume of applications available by category, 3 categories clearly stand out: games,
entertainment and personalization.
Personalization is also remarkable as the category with the biggest part of paid applications: almost
60%. Medical, Books and Comics are categories with more than 40% percents paid applications.
On the other side of the scope, Shopping, Business and News are categories where more than 90% of
applications are available for Free.
Refer to the following chart for a global view of all categories …
Games
Entertainment
Personalization
Books & Reference
Tools
Lifestyle
Education
Travel & Local
Music & Audio
Business
Sports
News & Mag.
Free
Productivity
Social Paid
Health & Fitness
Communication
Finance
Media & Video
Photography
Shopping
Medical
Transportation
Comics
Libraries & Demo
Weather
0 10000 20000 30000 40000 50000 60000
Ref : Pierre-Etienne Chausse / Smartphone Applications Market Analysis | 4
5. The average tag price for paid applications is 3,1$. Games are amongst the cheaper ones whereas
Business (5,78$), Education (7,42$) and especially Medical (14,04$) are the most expensive ones in
average.
Medical
Education
Business
Libraries & Demo
Books & Reference
Finance
Media & Video
Travel & Local
Comics
Transportation
Lifestyle
Social
Productivity
Communication
Photography
Sports
News & Magazines
Tools
Health & Fitness
Weather
Music & Audio
Entertainment
Shopping
Games
Personalization
0 2 4 6 8 10 12 14
Ref : Pierre-Etienne Chausse / Smartphone Applications Market Analysis | 5
6. Part 5 : Android Applications > Revenues
Paid applications are estimated to earn an average of nearly 2.500$. This amount varies depending
on categories, as shown on the chart below:
Part 6 : Android Applications > Market Size
According to various sources, the Android Market represents between 9 to 15 billions download.
Taking a 10 billion figure, here is the repartition by category
Ref : Pierre-Etienne Chausse / Smartphone Applications Market Analysis | 6