Visual perception labs are interested in the brains ability to use covert attention to process a visual scene. An experiment was designed with MATLAB software to look at the effect of eccentricity, or stimulus radius, on the accuracy of covert attention during a visual search task. Knowing that acuity degrades in the periphery of the retina, away from the fovea, it was hypothesized that the accuracy of covert attention will decrease with an increase in radius.
1. Demeris Morse
Yuliy R 5pm
1
Visual Search and Attention
Introduction
Visual search is a cognitive task that is a part of everyday life that is crucial for animal and
human survival. There are two processes of visual search: Overt and covert eye movements.
Overt attention refers to ballistic and saccadic eye movements. Covert eye attention refers to
shifting of visual attention, or attending to different parts of the visual scene without moving
one’s eyes.1
The importance of covert attention resides in the brains ability to direct attention
independent of eye movements.
Ultimately it is in the ability to direct
attention that has profound effects on the
ability to find objects in a visual scene or
search task. There are multiple theories
that try to explain how attention changes
visual processing. The Serial Attention
Model states that covert attention attends
to one object at a time and integrates the
feature of each target until it finds the
target item. Fundamentally, the function
of attention is to bind information2
across different dimensions of a target to perform a visual
task. Serial Attention is limited by the number of items, or set size, that attention must serially
process. As the number of items increases, the brain does not have enough time to go to each
item individually to process. As the number of items increases (n) beyond the number of
items the brain can serially process at once (k) then observers are left to guess which item is
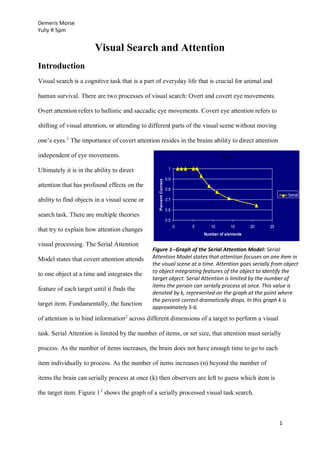
the target item. Figure 13
shows the graph of a serially processed visual task search.
Serial
0.5
0.6
0.7
0.8
0.9
1
0 5 10 15 20 25
Number of elements
PercentCorrect
Serial
Figure 1--Graph of the Serial Attention Model: Serial
Attention Model states that attention focuses on one item in
the visual scene at a time. Attention goes serially from object
to object integrating features of the object to identify the
target object. Serial Attention is limited by the number of
items the person can serially process at once. This value is
denoted by k, represented on the graph at the point where
the percent correct dramatically drops. In this graph k is
approximately 5-6.
2. Demeris Morse
Yuliy R 5pm
2
Signal Detection Theory (SDT) assumes the brain can attend to the whole scene at once with
equal processing. The function of attention is to select relevant information and ignore
distractors. This model assumes that a neuron firing in response to objects in a scene vary
from "target" or "non-target", in other words, responses are inherently noisy, or vary. Noise
refers to the neurons capability to
correctly distinguish between a target
and a distractor. Noise depends on the
discrimibility (d’) of the target and
distractor. The SDT model is
inherently limited by d’. The lower d’
the lower the discrimibility and the
higher d’ the better the discrimibility.
Accuracy also degrades as set size
increases. When there are more
objects in the scene there are more
responses and chances for the neuron
to misidentify a distractor for a
target.4
Figure 25
shows the graph of
a SDT model.
Limited Resources Theory states attentional resources are limited and the quality of
processing decreases as the number of distractors in the visual field increases. Attention is
divided among many items in a scene, thus when set size increases less attention can be
dedicated to each item, thus lowering the quality of processing of an individual item.
Therefore, limited samples is limited by the set size of the scene. As the set size increases,
discrimibility (d’) decreases making observers more prone to errors.
0.5
0.6
0.7
0.8
0.9
1
0 10 20 30 40
Set-size
Percentcorrect
d'=1.5
d'=2.0
d'=3.0
d'=4.5
Figure 2--SDT Graph: In the SDT model, attention is parallel
in the visual scene and every object is equally processed.
Each distractor and target response is inherently noisy or
varies. The responses assume a normal distribution where
the mean response is considered the normal response. The
distance between the distractor and target means is
quantified as d’. d’ represents the discrimibility of the
distractor and target object. As shown in the graph, as d’
increases the objects are better discriminated and the
chance of confusing the distractor for target is low. As d’
decreases, the objects become less discriminable, and there
is greater chance for error. As the set size increases, there
are more responses for the target and distractor,
increasing the chances for the observer to misinterpret the
distractor for the target.
3. Demeris Morse
Yuliy R 5pm
3
To study the three models of covert attention, a participant completed a visual search task that
required them to search for a specific colored square in an array of different colored squares.
Since the experiment was interested in studying covert attention, eye movements were
controlled for by using a two forced choice paradigm, where the observer briefly saw two sets
of stimuli and chose which stimuli contained the target block. The experimental conclusions
therefore relied on the accuracy of covert attention, instead of the observer's reaction time.
The experiment was specifically designed to look at the effect of eccentricity, or stimulus
radius, on the accuracy of covert attention. Knowing that acuity degrades in the periphery of
the retina, away from the fovea, it was hypothesized that the accuracy of covert attention will
decrease with an increase in radius. It was predicted that the brain will utilize attention in
ways similar to the Signal Detection or Limited Resources and as the number of distractors
increases the accuracy of the observers ability to correctly distinguish the target block would
decrease, no matter the radius of the rings. It was further hypothesized that the larger radii
would, however, cause the greatest loss of accuracy.
Methods
One female undergraduate student at the University of California Santa Barbara, taking a
psychology lab for course work, participated in the experiment. The experiment was run on a
Dell desktop using MATLAB software to code the experiment. The visual search program
ColorSearch2IFC was used to search for a colored target among distractors of different colors.
The experiment used a forced choice method as a design to measure accuracy instead of
reaction time. The observer first fixed their gaze on a small square in the screen then pressed
the space bar to begin a trial. The stimulus is presented in two 100 millisecond (ms) intervals
that was separated by an intertrial interval that lasted 10 ms. In each interval a set of blocks
were displayed in a circle around the fixation square. To standardize the size of the pixel for
various displays, the retinal size of a pixel was calculated. The visual angle on one pixel on
4. Demeris Morse
Yuliy R 5pm
4
the retina was calculated to be 0.031°. To convert the stimuli to visual angles, the size of the
stimuli in pixels was multiplied by the conversion factor 0.031°. For the rest of the report, the
stimuli size will be reported in pixels instead of visual angles for simplicity. The size of the
blocks were set to 15 pixels. The target was present in one of the two stimuli intervals, and it
was the observer’s responsibility to use their covert attention to spot the target. If the target is
in the first interval the observer pressed the 'D' key. If the target was in the second interval the
observer pressed the 'K" key. After the response, the fixation point reappeared and the
observer could start a new trial by pressing the space bar. The observer could quit the
experiment anytime by pressing 'Q'. In this experiment the color parameters were set to the
following: The background color was black (0, 0, 0), the fixation point was white (255, 255,
255), the target color was green (0, 255, 0), and the distractor colors were blue (0, 0, 255) and
light green (0, 255, 125). Two distractor colors were chosen to prevent "pop out" effects,
which occurs when the target is easily distinguishable and seemingly "pops out" against the
distractors. The number of items in each display or set size was set to 3, 5, 10, and 12. The set
sizes were presented in random order to the observer to prevent learning effects, which occurs
when the observer learns how to perform the experiment more effectively over time. The
eccentricity of the circle of items to the fixation point was manipulated. Initially, it was set to
250 for the first half of the experiment, then set to 450 for the second half of the experiment.
The observer completed 5 runs each with 10 blocks for the 250 radius condition first, then
completed 5 runs each with 10 blocks for the 450 radius condition last. The percentage of
correct responses were recorded for each set size. The whole experiment was completed in
one 3 hour lab period.
5. Demeris Morse
Yuliy R 5pm
5
Results and Discussion
For both conditions, the percent correct (average) was calculated across each set size correct
responses. Then, the percent correct averages for each set size in each run were averaged
together for a final average for the specific set size. For both conditions these averages were
plotted on scatter plots as show in Figure 4a and 4b. The standard error for each set size was
calculated and added as error bars to the data points. To determine which model of attention
best fit the data, the percent correct values were entered in the Cyberfit website. Cyberfit
explained how well the data fit each model by performing a goodness of fit test represent by
the value C2
(Chi-squared). A lower C2
value indicated a better fit than a high C2
value.6
Cyberfit also calculated d' values for SDT and Limited Samples Models and k for the Serial
Attention Model. When the radius of the images was set to 250, the Serial Attention Model
best fit the data: k = 5, C2
= 4.18. For the other models the computed values were d' = 2.8, C2
= 18.7 (SDT), d' = 6.34, C2
= 6.08 (Limited Samples). When the radius of the images was set
to 450, the Limited Samples model best fit the data: d' = 3.28, C2
= 0.13. For the other models
0.5
0.6
0.7
0.8
0.9
1
1.1
2 4 6 8 10 12
PercentageofCorrectResponses
Set Size
Effect of Eccentricity on Visual Search
Serial Model
Noisy Parallel MAX Model
Limited Samples Model
Radius = 250
Error Bars denote
SEM (+/-)
Figure 4a -- The Effect of Eccentricity on Visual Search: When the visual display is set to a radius of
250, the percent correct responses best fits to a Serial Model of Attention (k= 5, C2
= 4.18, SEM =
0.034).
6. Demeris Morse
Yuliy R 5pm
6
Figure 4b—The Effect of Eccentricity on Visual Search: When the visual display is set to a radius of
450, the percent correct responses best fits to a Limited Samples Model (d’= 3.28, C2
= 0.13, SEM =
0.048).
the computed values were k = 2, C = 0.32 (Serial Attention), d' = 1.45, C2
= 2.3. It was
hypothesized that the Limited Samples Model would best fit the data as the eccentricity of the
rings increased. According to the data, when the radius was small, attention actually followed
the Serial Attention Theory, a result not previously hypothesized. However, as the radius
expands, into the periphery, attention fit the Limited Samples model, supporting the original
hypothesis that covert attention will follow either a Serial attention or Limited Samples
Model. As shown in Figure 4a and 4b, as the set size increases in both radii, the accuracy of
covert attention degrades supporting the initial hypothesis that covert attention will degrade
with increasing set size, independent of the attention model and radii. Further, the graphs
show the largest loss of accuracy occurred when the radii was set to 450. The data also shows
that the Limited Samples model is not used when the radius of the image is much smaller.
Instead, the brain utilizes a Serial Attention strategy. It was not predicted that covert attention
would follow different models dependent on the ring size. Instead, the experiment's data
concludes covert attention is not uniform in the visual scene. It is possible the brain may uses
different attentional strategies for different parts of the visual field. Objects that are nearer to
0.45
0.5
0.55
0.6
0.65
0.7
0.75
0.8
0.85
0.9
2 4 6 8 10 12
PercentageofCorrectResponses
Set Size
Effect of Eccentricity on Visual Search
Serial Model
Noisy Parallel MAX Model
Limited Samples Model
Radius = 450
Error Bars denote
SEM (+/-)
7. Demeris Morse
Yuliy R 5pm
7
the fovea, the cone-dense region of the retina responsible for acuity and color vision, may use
Serial Attention because Serial Attention may require high acuity and color vision to integrate
details of the distractors and target to correctly determine the target. On the other hand, as
objects move into the periphery the brain may utilize a Limited Samples approach because
rods in the periphery cannot distinguish fine detail or color, inhibiting Serial Processing from
integrating details of the target image in the periphery. In the periphery, attention may be
focused on the whole scene rather than fine details. According to the data, as the limited
attention in the periphery processes more images, the quality of processing is reduced,
impeding performance. The brain may not utilize Serial Attention in the periphery because of
its inability to distinguish fine detail and integrate features to determine the correct target
object. Conversely, the brain may not utilize a Limited Samples approach near the fovea
because of its ability to discern finer features of target objects, which would allow serial
processing to work best. The variance in attention begs the question: If serial processing is
associated with images on the fovea, is Serial Processing the inherently more accurate form of
Attention? Could serial processing discern and integrate features of a target item because the
images in the fovea are more processed in detail? More research is needed to confirm whether
different models are used depending on the type of vision being used. Then, research could try
to answer whether Serial Attention is the most accurate form of visual search.
Although the data is partially consistent with the initial hypothesis and the models of
attention, the experiment contained considerable amounts of error. A primary error is due to
poor motor skills. The participant would press the key that did not correlate to her initial
response. Learning effects may have occurred because the participant complete five runs of
the same condition in a row. Thus, the participant may have learned to distinguish the target
over time. An experiment that controls for learning effects and motor skills may improve the
data and reduce error. To further support the theory that the visual field may apply different
8. Demeris Morse
Yuliy R 5pm
8
types of covert attention to the visual field experiments should test larger and smaller radii. If
the data shows that different radii consistently fit different models of attention then
experiments can be designed to study the function of using multiple types of covert attention.
1 Miguel Eckstein, “Visual Search and Attention,” PowerPoint presentation, May 27, 2015, University of
California Santa Barbara, Santa Barbara, CA.
2 Ibid.
3 Ibid.
4 David Brainard, “Visual Search Experiment—2IFC,” University of California Santa Barbara, Santa Barbara, CA.
5 Ibid., Eckstein
6 Ibid.