Tmd10192008 Evening Edition
•
0 recomendaciones•133 vistas

The market detective is a Chartered Market Technician (CMT). He uses technical analysis to identify market turning points and opportunities. He is primarily an Elliottician, he uses the Elliott wave principle and Fibonacci ratio analysis to uncover clues about the direction of the market. He uses other forms of technical analysis to corroborate his findings in such a way as to assign a probability factor to them.

Recomendados
Más contenido relacionado
Más de David Waggoner
Último
Último (20)
Tmd10192008 Evening Edition
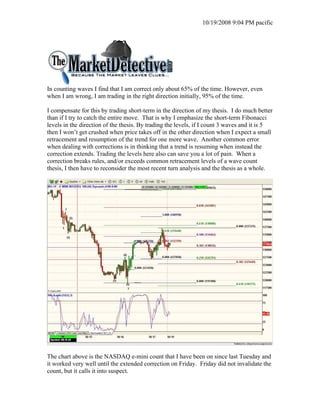
- 1. 10/19/2008 9:04 PM pacific In counting waves I find that I am correct only about 65% of the time. However, even when I am wrong, I am trading in the right direction initially, 95% of the time. I compensate for this by trading short-term in the direction of my thesis. I do much better than if I try to catch the entire move. That is why I emphasize the short-term Fibonacci levels in the direction of the thesis. By trading the levels, if I count 3 waves and it is 5 then I won’t get crushed when price takes off in the other direction when I expect a small retracement and resumption of the trend for one more wave. Another common error when dealing with corrections is in thinking that a trend is resuming when instead the correction extends. Trading the levels here also can save you a lot of pain. When a correction breaks rules, and/or exceeds common retracement levels of a wave count thesis, I then have to reconsider the most recent turn analysis and the thesis as a whole. The chart above is the NASDAQ e-mini count that I have been on since last Tuesday and it worked very well until the extended correction on Friday. Friday did not invalidate the count, but it calls it into suspect.
- 2. 10/19/2008 9:04 PM pacific I often bounce between counting waves and measuring ratios on the NASDAQ e-minis and the S&P e-minis. Often one of the indices is hitting the ratios exactly while the other is only approximate. I refer to the one hitting the levels as the leader. The extension up from 1270 NQ finished with the 60min bar closing on the .618 extension level of the wave up from 1910, but it certainly seemed like a breakout during the fray on Friday. This kind of miss makes me immediately contrast it against the S&P e-minis. In the S&P e-minis price stopped exactly at the .618 retracement level of the move down from 1067. In retrospect, it is clear that the 60 minute S&P e-minis was the leader on Friday. I mentioned this in an alert early in the day, but I ended up watching the NQ at the crucial turn/breakout pivot and missed the relevance of the turn. I hopeyou did better. Moral of the story: follow the leader. Looking at the 60 minute ES chart below, the black labeling shows 3 waves down from 1067, matching the NASDAQ e-mini count, while the red labeling shows 5 waves down. 60 MIN ES Chart Despite the favorable ratios of 3 waves down, a 3 wave count as a motive wave (3 of 5) is running into problems in both indices.
- 3. 10/19/2008 9:04 PM pacific Primarily because the retracement level of what would be the 4th wave is at a .618 retracement, and that is very uncommon for a 4th wave. However, since we have not breached the bottom of wave 1 yet on either the ES or NQ 60 minute charts above for the 3 wave count, we have only violated a guideline and not broken a rule. Another problem with the (5) of 3 thesis following the extension on Friday, is that now a (5) of 3 wave in the ES would not even make a new low with the .618 extension. I show this higher low in the 60minute chart with a blue trend line. The result of the 5th wave being a .618 Fibonacci extension of the 3rd wave would result in an uncommon truncated 5th wave (5th wave shorter than 3rd). Two uncommon characteristics are improbable. This relegates last week’s thesis to the back burner. I originally stated on October 10th that I thought we had completed the 3rd wave down from the October high in the S&P, then, last weekend I changed my mind because I couldn’t get a confirmation with the NASDAQ e-minis. All last week I continued with the thesis that there was one more wave to go before we completed wave 3 down from the October high in 2007. Price agreed most of last week as we headed down from 15000 in the NQ and then completed a zigzag retracement that was a perfect 1:1 ratio. Still focusing on the NASDAQ e-minis right up until Friday, I was saying I believed we still had one more wave to go before we finished 3 waves down from the October high. The S&P e-minis corroborated this while the retracement level paused at 95000. However, with the extension on Friday, the probability bias has changed. Go back to the 60minute ES chart above where I have also labeled a 5 wave count in red. I also show the implications of what a 5 wave count would mean. It would mean that we completed 3 waves down from October 2007on 10/10/2008. That would consequently mean that we are in wave (2) of 5 down from October 2007. What is the most common retracement for a 2nd wave? It is .618. If we head down from here this is the thesis that I will be trying to corroborate with wave counts. This will be the easy path from here. The more difficult path is determining how high we can go if we can continue go up. Once again referencing the 60min ES chart red labels, a second wave can technically can go up to a 99% retracement of wave 1. The most common Fibonacci retracement levels are .618, then .810. This is not the only option for higher prices. There is another option that I will present in the morning, if futures stay up overnight, that allows for the 3 wave counts down from
- 4. 10/19/2008 9:04 PM pacific 1067 and 1500 to be correct. It also assumes that wave 3 down from October 2007 ended on October 10th. TMD/DW The market detective provides personal market opinion based on sound technical analysis and research. However, no warranty is given or implied as to its true reliability. The market detective will make errors and mistakes. The market detective is not an investment adviser and is not making recommendations to buy, sell, or place orders relating to the futures contracts, ETFs, or stocks that he writes about. The responsibility for decisions made from information contained in this service are solely that of the individual subscriber. The individual must fully research and make his/her own decisions before acting on any information provided by the market detective. The market detective assumes no responsibility for subscriber investment or trading results.