Cardiac output
•Descargar como PPTX, PDF•
43 recomendaciones•39,010 vistas

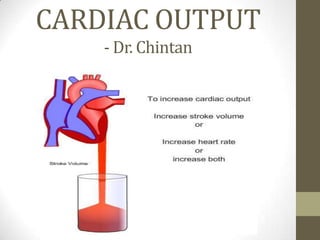
Cardiac output is the volume of blood pumped by the heart each minute. It is calculated as stroke volume multiplied by heart rate. Stroke volume is the volume of blood pumped from the left ventricle with each beat. Factors that affect cardiac output include body metabolism, exercise level, age, and body size. Cardiac output increases with exercise and decreases with age. It is tightly regulated to meet the metabolic demands of the body's tissues.

Recomendados
Más contenido relacionado
La actualidad más candente
La actualidad más candente (20)
Destacado
Similar a Cardiac output
Similar a Cardiac output (20)
Más de DrChintansinh Parmar
Más de DrChintansinh Parmar (20)
Último
Último (20)
Cardiac output
- 1. CARDIAC OUTPUT - Dr. Chintan
- 2. Cardiac Output Cardiac output is the quantity of blood pumped into the aorta each minute by the heart. Unit – liter (ml) / min. CO = SV multiplied by Heart Rate (HR) or Pulse Rate (PR) Cardiac Output = Arterial Pressure / Total Peripheral Resistance Cardiac output varies widely with the level of activity of the body. The following factors directly affect cardiac output: (1) The basic level of body metabolism, (2) Whether the person is exercising or not, (3) The person's age, and (4) Size of the body.
- 3. Stroke Volume Stroke volume ( SV ) is the volume of blood pumped from one ventricle of the heart with each beat. Unit of SV measurement is ml / beat. SV is calculated using measurements of ventricle volumes from an echocardiogram and subtracting the volume of the blood in the ventricle at the end of a beat ( called end - systolic volume ) from the volume of blood just prior to the beat ( called end - diastolic volume ). SV = EDV – ESV The term stroke volume can apply to each of the two ventricles of the heart, although it usually refers to the left ventricle. The stroke volumes for each ventricle are generally equal, both being approximately 70 ml in a healthy 70 kg man. Stroke volume is an important determinant of cardiac output, which is the product of stroke volume and heart rate
- 4. Stroke Volume When the heart contracts strongly, the end - systolic volume can be decreased to as little as 10 to 20 millilitres. Conversely, when large amounts of blood flow into the ventricles during diastole, the ventricular end - diastolic volumes can become as great as 150 to 180 millilitres in the healthy heart. By both increasing the end - diastolic volume and decreasing the end - systolic volume, the stroke volume output can be increased to more than double normal. Men, on average, have higher stroke volumes than women due to the larger size of their hearts. However, stroke volume depends on several factors such as contractility, duration of contraction, preload (end - diastolic volume) and after load.
- 5. Stroke Volume Prolonged aerobic exercise training may also increase stroke volume, which frequently results in a lower (resting) heart rate. Reduced heart rate prolongs ventricular diastole (filling), increasing enddiastolic volume, and ultimately allowing more blood to be ejected (cardiovascular conditioning in athletes). Stroke volume is intrinsically controlled by preload (the degree to which the ventricles are stretched prior to contracting). An increase in the volume or speed of venous return will increase preload and, through the Frank – Starling law of the heart, will increase stroke volume. Elevated after load (commonly measured as the aortic pressure during systole) reduces stroke volume. Though not usually affecting stroke volume in healthy individuals, increased after load will hinder the ventricles in ejecting blood, causing reduced stroke volume.
- 6. Stroke Volume The resistance to the ejection of blood by the ventricle is called afterload. The left ventricle, for example, must create sufficient pressures during systole to overcome diastolic arterial pressure and systemic vascular resistance before any blood is ejected. While preload enhances contractility and stroke volume, high pressures in the arterial vessels during ventricular end diastole is inversely related to stroke volume. While systemic vascular resistance is not easily determined without a pulmonary artery catheter, diastolic blood pressure is easily measured. So while an accurate estimate of afterload is often not clinically practical, a patient’s diastolic pressure provides a good indication of the resistance the left ventricle must overcome. In general, the higher the diastolic pressure, the higher the afterload.
- 7. Stroke Volume Afterload is also tied to cardiac hypertrophy. As the resistance to chamber contraction increases, the chamber adapts to this increased workload with the accumulation of increased fiber within the myocardial cells. This makes the cells stronger but also bulks up the cells, ultimately resulting in chamber hypertrophy. Unfortunately, these thicker chamber walls can be associated with additional complications such as decreased contractility, reduced stroke volume, and cardiac dysrhythmias.
- 8. Cardiac Output For young, healthy men, resting cardiac output averages about 5.6 L / min. For women, this value is about 4.9 L / min. With increasing age, body activity diminishes; the average cardiac output for the resting adult is often stated to be almost exactly 5 L / min. Experiments have shown that the cardiac output increases approximately in proportion to the surface area of the body. Therefore, cardiac output is frequently stated in terms of the cardiac index, which is the cardiac output per square meter of body surface area. The normal human being weighing 70 kilograms has a body surface area of about 1.7 square meters, which means that the normal average cardiac index for adults is about 3 L/min/m2 of body surface area.
- 9. Cardiac Output Cardiac output is regulated throughout life almost directly in proportion to the overall bodily metabolic activity. Therefore, the declining cardiac index is indicative of declining activity with age.
- 10. Cardiac Output Frank - Starling law of the heart states that when there is increased quantities of blood flow (venous return – pre load) into the heart, the cardiac muscle contracts with increased force, and this empties the extra blood that has entered from the systemic circulation. And so there is increased cardiac output. The venous return to the heart is the sum of all the local blood flows through all the individual tissue segments of the peripheral circulation. Therefore, it follows that cardiac output regulation is the sum of all the local blood flow regulations. When the total peripheral resistance (after load) increases above normal, the cardiac output falls; conversely, when the total peripheral resistance decreases, the cardiac output increases.
- 11. Cardiac Output Two types of factors usually can make the heart a better pump than normal. (1) Nervous stimulation: Increased sympathetic & inhibited parasympathetic activity leads to both increased heart rate & strength of heart contraction leading to increased cardiac output. (2) Hypertrophy of the heart muscle: A long-term increased workload, but not so much excess load that it damages the heart, causes the heart muscle to increase in mass and contractile strength in the same way that heavy exercise causes skeletal muscles to hypertrophy leading to increased cardiac output.
- 12. Cardiac Output Low cardiac output, whether it be a peripheral factor or a cardiac factor, if ever the cardiac output falls below that level required for adequate nutrition of the tissues, the person is said to suffer circulatory shock. Cardiac index is calculated mainly in this type of patient for early detection of shock. In the human, except in rare instances, cardiac output is measured by indirect methods that do not require surgery. Two of the methods commonly used are the oxygen Fick’s method and the indicator dilution method.
- 13. Cardiac Output Why cardiac output is vital to our well-being ? Simply, cardiac output is intimately connected to energy production. Sufficient perfusion to the tissues yields an abundant energy supply. Poor tissue perfusion results in critical shortages of energy and often diminished function. Sufficient cardiac output is necessary to deliver adequate supplies of oxygen and nutrients (glucose) to the tissues.
- 14. Table No. 1 : Example values in healthy 70 kg man Measure Typical value Normal range End - diastolic volume ( EDV ) 120 ml 65 - 240 ml End - systolic volume ( ESV ) 50 ml 16 - 143 ml Stroke volume ( SV ) 70 ml 55 - 100 ml Ejection fraction ( Ef ) 65 % 55 to 70 % Heart rate ( HR ) 75 bpm 60 to 100 bpm Cardiac output ( CO ) 5.25 L / minute 4.0 - 8.0 L / min Of the total CO, 75 % is distributed to the vital organs – Liver, kidney, brain, lung, heart
- 15. Table No. 2 : Effect of various Physiologic conditions on Cardiac Output Condition or Factor No Sleep change Moderate changes in environmental temperature Increase Anxiety and excitement ( 50 – 100 % ) Eating ( 30 % ) Exercise ( up to 700 % ) High environmental temperature Pregnancy ( Later months ) Epinephrine High Altitude due to hypoxia Day time according to metabolic activity Decrease Sitting or standing from lying position ( 20 – 30 % )
- 16. Factors regulating Cardiac Output
- 17. Factors regulating HR Age, Sex Body temp. – Marey’s law Drugs – E, NE, Bainbridge reflex Diseases: ↑ in ICP – bradycardia – Cushing reflex Thyrotoxicosis Hypoxia Emotions, Exercise Pain – superficial & deep, respiration – sinus arrhythmia
- 18. Factors controlling HR Cardiac innervation by ANS Medullary Cardiovascular centers: VMC, CVC HR & Respiration – Role of inspiratory neurons Role of baroreceptors – NTS – CVC, Resting vagal tone Role of chemoreceptors - hypoxia
- 20. Pathway relating interaction of cardiac and respiratory reflexes I neurons + - Chemoreceptors + Nucleus tractus solitarius Baroreceptor + Nucleus ambiguus
- 21. THANQ…