SlideShare una empresa de Scribd logo
1 de 52
Descargar para leer sin conexión
United States
       Department of


                          Grain:
       Agriculture
       Foreign
       Agricultural
       Service
       Circular Series
       FG 02-10
       February 2010
                          World Markets and Trade

Barley: A Decade of Change & Export Redistribution
                         1999/00                                               2009/10
                                                                                        1.5 MMT
                                                                                         Exports


                                            10 MMT
                                            Exports


                                   EU       Russia & Ukraine                 Other

Once upon a time (just ten years ago), the EU dominated much of the international barley
market, particularly in North Africa and the Middle East. Competitors, such as Australia and
Canada, faced the EU’s comparative freight and logistical advantages (there were also small
erratic suppliers, such as Syria and Turkey). The EU support programs guaranteed high
prices and stimulated production, while export subsidy programs helped to ensure that EU
barley had a competitive price advantage against other countries.

However, it is all different now. Global barley trade dynamics have changed dramatically
with the emergence of low-cost supplies and increased competition from Russia and Ukraine,
which also happen to be competitive regional exporters that can match the EU’s comparative
freight and logistical advantages. EU policies and programs have reduced market and
support prices, stimulated domestic use, and de-emphasized export subsidies as a market-
clearing mechanism. Recent regulation changes will soon eliminate intervention support for
barley, which could cause some acreage to shift to more profitable crops, and further reduce
exportable supplies.


                              Approved by the World Agricultural Outlook Board - USDA
TABLE OF CONTENTS

                World Markets and Trade: Commentary and Current Data
                  Wheat ................................................................................................................. 4
                  Rice .................................................................................................................... 8
                  Coarse Grains................................................................................................... 12

                Historical Data Series for Selected Regions and Countries ............................ 31

                Endnotes to Grain: World Markets and Trade ............................................... 50


                The Foreign Agricultural Service (FAS) updates its production, supply and distribution database
                for cotton, oilseeds, and grains at 9 a.m. on the day the World Agricultural Supply and Demand
                Estimates (WASDE) report is released. It is available on the FAS website
                (http://www.fas.usda.gov/psdonline/). This circular is released at 10:00 a.m. on the same day,
                together with its downloadable data set.


                                                                               Grain: World Markets and Trade, February 2010

Foreign Agricultural Service/USDA                                             2
Office of Global Analysis                                                                                                                       February 2010
All Grain Summary Comparison


                                                                          Wheat                                  Rice, Milled                            Corn

                                        Marketing Year       2007/08      2008/09       2009/10      2007/08      2008/09       2009/10     2007/08     2008/09       2009/10


     Production

       United States                    (Jun-May)                  55.8        68.0           60.3         6.3            6.5         7.0       331.2       307.1         334.1

       Other                                                      554.6       614.7         617.1        428.0          440.8       429.2       460.7       484.4         463.8


        World Total                                               610.5       682.7         677.4        434.4          447.3       436.3       791.9       791.5         797.8


     Domestic Consumption

       United States                    (Jun-May)                  28.6        34.3           32.2         4.1            4.1         4.2       261.6       259.1         282.3

       Other                                                      584.6       599.1         612.2        422.4          429.6       430.4       509.2       514.7         525.1


        World Total                                               613.2       633.4         644.4        426.5          433.7       434.5       770.9       773.7         807.4


     Ending Stocks

       United States                    (Jun-May)                   8.3        17.9           26.7         0.9            1.0         1.3        41.3        42.5          43.7

       Other                                                      112.7       146.1         169.2         80.0           92.4        91.2        88.4       103.4          90.4


        World Total                                               121.1       164.0         195.9         81.0           93.3        92.5       129.6       145.9         134.0


     TY Imports

       United States                    (Jun-May)                   3.0           3.5          3.3         0.7            0.7         0.7         0.5           0.3         0.3

       Other                                                      110.6       136.1         118.4         27.6           26.1        28.1        99.4        81.2          82.3


        World Total                                               113.6       139.5         121.6         28.2           26.8        28.9        99.9        81.5          82.6


     TY Exports

       United States                    (Jun-May)                  34.3        27.3           22.5         3.3            3.1         3.2        60.7        47.9          50.0

       Other                                                       82.1       115.2         101.8         26.5           25.9        27.7        37.6        35.3          34.9


        World Total                                               116.4       142.5         124.3         29.8           29.0        30.8        98.2        83.2          84.9


      Note: Consumption in this table has not been adjusted for differences in marketing year imports and exports
      and therefore differs from global totals shown elsewhere.

      Marketing years for U.S. grains are: Wheat (Jun-May), Rice (Aug-Jul), Corn (Sep-Aug).
      'Marketing Year' column is germane for U.S. wheat only.


Foreign Agricultural Service/USDA
Office of Global Analysis                                                                                                                                             February 2010
WHEAT: WORLD MARKETS AND TRADE
                PRICES:
                                                                               U.S. Weekly FOB Export Bids
                                                                                                                   300
                Domestic: Prices for all classes of wheat
                fell through the first week in February,
                except for Hard Red Spring (HRS)
                which was unchanged. Growing global                                                                250
                supplies more than offset a slight uptick


                                                                                                                         $/MT
                in U.S. export sales. Soft and Hard Red
                Winter showed the largest declines, of
                $24 and $18/ton, respectively, while                                                               200
                Soft White fell $10/ton.

                TRADE CHANGES IN 2009/10
                                                                                                                   150
                Selected Exporters:


                                                                       1
                                                                       8
                                                                       5


                                                                     15
                                                                     22
                                                                     29
                                                                      /6

                                                                       3


                                                                       7
                                                                      /4
                                                                       0


                                                                       1
                                                                       8


                                                                       5
                                                                    /2


                                                                    /1
                                                                    /2
                                                                    /1
                                                                    /1
                                                                    /2


                                                                   1/
                                                                   1/


                                                                   2/
                                                                  12
                                                                  11


                                                                  1/
                                                                  1/
                                                                  1/
                                                                 11
                                                                 11
                                                                 11


                                                                 12
                                                                 12
                                                                 12
                                                                        HRS        HRW         SRW           SWW
                     •    Argentina is raised 1.0 million
                          tons to 4.0 million on higher production and increased exportable supplies.

                     •    Pakistan is halved to 500,000 tons based on reduced exports to Afghanistan.

                     •    Turkey is up 300,000 tons to 2.6 million due to higher expected flour shipments to Iraq
                          and Indonesia.

                Selected Importers:

                     •    Afghanistan is raised 700,000 tons to 2.0 million as the pace of wheat flour shipments
                          from Kazakhstan remains brisk.

                     •    Iran is cut 1.0 million to 3.5 million based on the slow pace of imports.

                     •    Pakistan is halved to 500,000 due to increased domestic supplies and minimal imports to
                          date.

                     •    Turkey is up 500,000 tons to 2.5 million based on the strong pace of trade, particularly
                          from Russia.

                     •    Uzbekistan is increased 400,000 tons to 1.4 million on the strong pace of flour shipments
                          from Kazakhstan.

                     •    United States is up 150,000 tons to 3.3 million because of expected feed-quality wheat
                          imports from Brazil and Europe.


                                                                   Grain: World Markets and Trade, February 2010

                                                                   4
Foreign Agricultural Service/USDA
Office of Global Analysis                                                                                                       February 2010
World Wheat, Flour, and Products Trade
                                                July/June Year, Thousand Metric Tons
                                     2004/05            2005/06         2006/07        2007/08    2008/09    2009/10
                                                                                                                 Feb

                                                                                                                none
     TY Exports
       Argentina                       13,426              8,216          12,168         10,228      8,598      4,000
       Australia                       15,826             15,211          11,241          7,449     13,452     15,000
       Canada                          15,109             15,633          19,278         16,561     18,583     18,500
       China                            1,171              1,397           2,783          2,835       723       1,000
       EU-27                           14,745             15,701          13,816         12,271     25,318     19,000
       Kazakhstan                       3,039              3,817           8,089          8,181      5,701      7,500
       Mexico                            504                533             548           1,261      1,406      1,200
       Russia                           8,456             10,514          10,584         12,552     18,393     18,000
       Turkey                           2,235              3,208           2,200          1,763      2,342      2,600
       Ukraine                          4,403              6,461           3,366          1,236     13,037      9,000
       Others                           6,360              5,886           6,482          7,782      7,632      6,049
                 Subtotal              85,274             86,577          90,555         82,119    115,185    101,849
                 United States         28,552             27,252          25,041         34,328     27,295     22,500
                 World Total          113,826            113,829         115,596        116,447    142,480    124,349
                                                                                                                none
     TY Imports
       Afghanistan                      1,000               500            1,400          2,300      3,800      2,000
       Algeria                          5,358              5,476           4,874          5,904      6,359      5,300
       Bangladesh                       2,058              2,034           1,731          1,555      2,882      2,600
       Brazil                           5,009              5,823           7,704          7,136      6,367      6,500
       Egypt                            8,150              7,771           7,300          7,700      9,900      8,800
       EU-27                            7,061              6,758           5,137          6,942      7,740      6,500
       Indonesia                        4,661              4,981           5,596          5,224      5,423      5,500
       Iran                              200               1,105            700            200       9,300      3,500
       Iraq                             3,010              4,996           2,912          3,424      3,868      3,800
       Israel                           1,549              1,663           1,458          1,186      2,060      2,100
       Japan                            5,744              5,469           5,747          5,701      5,156      5,300
       Korea, South                     3,591              3,884           3,439          3,092      3,371      3,700
       Libya                            1,488              1,722            994           1,567      1,677      1,650
       Mexico                           3,717              3,549           3,610          3,136      3,341      3,100
       Morocco                          2,272              2,418           1,801          4,191      3,759      1,800
       Nigeria                          3,014              3,678           3,265          2,677      3,550      3,500
       Peru                             1,449              1,644           1,367          1,452      1,385      1,500
       Philippines                      2,593              2,954           2,754          2,266      3,201      3,000
       Saudi Arabia                       50                 77              91             48       1,400      1,600
       South Africa                     1,407              1,242            885           1,333      1,500      1,500
       Sudan                            1,522              1,659           1,323          1,060      1,712      1,500
       Syria                             200                231             200            200       1,700      1,800
       Turkey                            372                 64            1,778          2,192      3,577      2,500
       Venezuela                        1,504              1,691           1,765          1,498      1,500      1,525
       Yemen                            1,860              2,187           2,420          1,861      2,786      2,300
       Others                          39,463             35,270          39,999         36,728     38,742     35,515
                 Subtotal             108,302            108,846         110,250        110,573    136,056    118,390
                 Unaccounted            3,578              2,684           1,952          2,862      2,964      2,709
                 United States          1,946              2,299           3,394          3,012      3,460      3,250
                 World Total          113,826            113,829         115,596        116,447    142,480    124,349


      TY=Trade Year, see Endnotes.


Foreign Agricultural Service/USDA
Office of Global Analysis                                                                                    February 2010
World Wheat Production, Consumption, and Stocks
                                         Local Marketing Years, Thousand Metric Tons
                                    2004/05         2005/06         2006/07            2007/08    2008/09    2009/10
                                                                                                                 Feb

                                                                                                                none
     Production
       Argentina                      16,100          14,600          16,100             18,000      9,000      9,000
       Australia                      21,905          25,173          10,822             13,569     20,939     22,500
       Canada                         24,796          25,748          25,265             20,054     28,611     26,500
       China                          91,952          97,445         108,466            109,298    112,464    114,500
       Egypt                           7,177           8,184           8,274              8,275      7,883      7,900
       EU-27                         146,886         132,356         124,870            120,133    151,080    138,218
       India                          72,150          68,640          69,350             75,810     78,570     80,580
       Iran                           14,568          14,308          14,500             15,000     10,000     12,000
       Kazakhstan                      9,950          11,200          13,450             16,450     12,550     17,000
       Morocco                         5,540           3,043           6,327              1,583      3,730      6,370
       Pakistan                       19,500          21,612          21,277             23,300     21,500     24,000
       Russia                         45,400          47,700          44,900             49,400     63,700     61,700
       Turkey                         18,500          18,500          17,500             15,500     16,800     17,800
       Ukraine                        17,500          18,700          14,000             13,900     25,900     20,900
       Uzbekistan                      5,250           5,800           5,850              6,200      6,000      6,200
       Others                         49,852          49,681          45,534             48,163     45,951     51,959
                 Subtotal            567,026         562,690         546,485            554,635    614,678    617,127
                 United States        58,698          57,243          49,217             55,821     68,016     60,314
                 World Total         625,724         619,933         595,702            610,456    682,694    677,441
                                                                                                                none
     Total Consumption
       Algeria                         7,550           7,750           7,850              8,050      8,450      8,750
       Brazil                          9,900          10,450          10,300             10,300     10,700     11,400
       Canada                          8,240           8,242           8,986              6,787      8,027      8,100
       China                         102,000         101,500         102,000            106,000    102,500    102,000
       Egypt                          14,200          14,800          15,450             15,950     16,550     17,050
       EU-27                         123,220         127,525         125,500            116,536    127,500    127,000
       India                          72,838          69,980          73,371             76,422     70,770     76,120
       Iran                           14,550          14,800          15,300             15,500     15,900     16,200
       Kazakhstan                      7,400           7,400           7,500              7,500      7,525      7,550
       Morocco                         6,600           6,800           7,150              7,450      7,550      7,650
       Pakistan                       19,600          20,900          21,900             22,400     22,800     23,300
       Russia                         37,400          38,400          36,400             37,700     38,900     41,200
       Turkey                         16,800          16,100          16,650             16,800     16,900     17,400
       Ukraine                        11,700          12,500          11,700             12,300     11,900     12,100
       Uzbekistan                      5,700           6,118           6,500              6,800      7,050      7,250
       Others                        116,044         122,532         121,066            118,116    126,063    129,128
                 Subtotal            575,664         591,379         584,643            588,367    605,459    613,430
                 United States        31,783          31,320          30,940             28,614     34,291     32,168
                 World Total         607,447         622,699         615,583            616,981    639,750    645,598
                                                                                                                none
     Ending Stocks
       Canada                          7,922           9,698           6,865              4,406      6,556      6,856
       China                          38,821          34,387          38,450             38,963     48,685     60,785
       Egypt                           2,861           4,006           4,120              4,120      5,343      4,983
       EU-27                          27,496          23,384          14,075             12,343     18,345     17,063
       India                           4,100           2,000           4,500              5,800     13,510     18,020
       Iran                            3,419           3,257           3,507              3,157      3,907      4,157
       Russia                          3,386           3,454           2,231              1,819      8,429     11,129
       Others                         47,537          51,744          41,432             42,138     41,371     46,173
                 Subtotal            135,542         131,930         115,180            112,746    146,146    169,166
                 United States        14,699          15,545          12,414              8,323     17,867     26,690
                 World Total         150,241         147,475         127,594            121,069    164,013    195,856


Foreign Agricultural Service/USDA
Office of Global Analysis                                                                                    February 2010
Regional Wheat Imports, Production, Consumption, and Stocks
                                                                         Thousand Metric Tons

                                                                                                                                                             Feb
                                                 2004/05               2005/06               2006/07               2007/08               2008/09         2009/10

     TY Imports                                                                                                                                              none
       North America                                  5,915                 6,135                 7,325                 6,535                    7,188       6,750
       Central America                                1,510                 1,506                 1,582                 1,460                    1,482       1,550
       South America                                 10,526                12,304                13,979                13,143                12,746         12,890
       European Union                                 7,061                 6,758                 5,137                 6,942                    7,740       6,500
       Other Europe                                   1,464                 1,457                 1,480                 1,923                    1,690       1,675
       Former Soviet Union - 12                       4,910                 5,487                 5,958                 6,021                    6,544       5,500
       Middle East                                   10,209                13,447                12,143                11,726                28,296         20,800
       North Africa                                  18,347                18,650                16,402                21,734                23,467         19,050
       Sub-Saharan Africa                            12,086                13,174                11,735                10,371                13,363         13,395
       East Asia                                     18,357                12,852                11,886                11,278                11,322         11,950
       South Asia                                     5,655                 4,812                10,944                 8,270                10,713          6,215
       Southeast Asia                                11,429                11,923                12,437                11,405                12,328         12,500
       Others                                         2,779                 2,640                 2,636                 2,777                    2,637       2,865
         Total                                      110,248               111,145              113,644               113,585               139,516         121,640
     Production                                                                                                                                              none
       North America                                 85,914                86,011                77,722                79,468              100,627          91,114
       South America                                 25,336                22,572                21,022                24,835                18,523         17,928
       European Union                               146,886               132,356              124,870               120,133               151,080         138,218
       Other Europe                                   5,435                 4,196                 4,313                 4,405                    4,693       4,465
       Former Soviet Union - 12                      85,581                91,123                84,927                92,541              115,585         113,670
       Middle East                                   42,771                42,975                41,758                39,912                32,196         36,825
       North Africa                                  17,166                15,178                18,576                13,948                14,588         19,395
       Sub-Saharan Africa                             4,796                 5,219                 5,724                 5,547                    6,449       6,057
       East Asia                                     93,221                98,652              109,669               110,590               113,706         115,711
       South Asia                                    96,326                96,034                95,881              105,075               103,870         111,100
       Oceania                                       22,161                25,466                11,099                13,846                21,216         22,777
       Others                                           131                   151                   141                   156                     161         181
         Total                                      625,724               619,933              595,702               610,456               682,694         677,441
     Domestic Consumption                                                                                                                                    none
       North America                                 46,023                45,662                46,126                40,901                48,318         46,418
       South America                                 23,094                24,151                23,901                23,951                24,254         25,175
       European Union                               123,220               127,525              125,500               116,536               127,500         127,000
       Other Europe                                   6,018                 5,917                 5,495                 5,600                    5,544       5,830
       Former Soviet Union - 12                      72,231                75,041                72,627                75,002                76,570         79,500
       Middle East                                   49,690                50,423                51,308                50,519                53,260         53,665
       North Africa                                  32,538                33,847                34,205                36,042                37,352         38,325
       Sub-Saharan Africa                            16,390                17,782                16,752                15,870                18,873         19,143
       East Asia                                    114,117               114,116              113,938               117,556               114,118         114,170
       South Asia                                   100,951               100,310              105,160               109,487               104,405         111,280
       Southeast Asia                                10,900                11,515                11,693                10,990                12,111         12,340
       Oceania                                        6,916                 7,484                 8,545                 7,394                    7,699       8,025
       Others                                         3,437                 3,344                 3,313                 3,377                    3,372       3,495
         Total                                      605,525               617,117              618,563               613,225               633,376         644,366
     Ending Stocks                                                                                                                                           none
       North America                                 22,997                25,555                19,693                13,111                24,740         33,913
       South America                                  4,062                 4,752                 5,132                 5,801                    3,293       3,616
       European Union                                27,496                23,384                14,075                12,343                18,345         17,063
       Other Europe                                   1,770                 1,333                 1,067                 1,037                    1,442       1,237
       Former Soviet Union - 12                      12,746                13,338                 9,263                10,609                18,510         23,155
       Middle East                                   12,600                13,520                12,041                10,648                12,221         13,919
       North Africa                                   9,492                 9,233                 9,749                 9,127                    9,600       9,485
       Sub-Saharan Africa                             1,243                 1,458                 1,731                 1,563                    2,074       2,033
       East Asia                                     41,220                36,606                40,838                41,781                51,519         63,395
       South Asia                                     7,393                 6,285                 7,057                 8,487                16,363         21,698
       Southeast Asia                                 2,152                 2,251                 2,605                 2,549                    2,432       2,347
       Oceania                                        6,848                 9,544                 4,159                 3,841                    3,301       3,818
       Others                                           222                   216                   184                   172                     173         177
         Total                                      150,241               147,475              127,594               121,069               164,013         195,856


     NOTES: Regional definitions appear on last page of this circular. Imports are reported on a trade year basis. All other data are reported
     using local marketing years.


Foreign Agricultural Service/USDA
Office of Global Analysis                                                                                                                                 February 2010
RICE: WORLD MARKETS AND TRADE

                PRICES:
                                                                      $/MT      Recent Price Spreads Becoming
                For most of this decade, the spread between                              Less Volatile
                U.S. #2/4 quotes and Thai 100B quotes was              250
                positive and moved rather slowly. Likewise,
                                                                       200
                the difference between Thai 100B quotes
                and Vietnamese 5% quotes was mostly                    150
                positive and fairly small. This pattern                100
                changed in 2008 when Thai quotes fell
                below U.S. quotes, and the gap between                  50
                Thai and Vietnamese quotes ballooned. At                 0
                the same time, prices at all origins were
                changing quickly and not always in the same            -50

                direction, creating volatility in the spread.         -100
                In the past few months, however, it seems
                that this volatility has diminished as quotes         -150

                have tended to move in the same direction.            -200
                In addition, the U.S.-Thai spread has been
                shrinking and is near zero. With the                  -250

                completion of the Philippine tenders, there                0    1    2    3    4    5    6    7    8    9    0
                                                                        b-0 eb-0 eb-0 eb-0 eb-0 eb-0 eb-0 eb-0 eb-0 eb-0 eb-1
                                                                      Fe    F     F    F    F    F    F    F    F    F    F
                may be more stability in the Thai-Viet
                spread, as well.
                                                                             US-Thai Price Spread        Thai-Viet Price Spread

                TRADE CHANGES

                Selected Exporters:

                     •    Burma is down 200,000 tons to 800,000 in 2010 due to depleted stocks after 2009
                          exports reached the highest level in over 40 years.

                     •    Egypt is up 150,000 tons to 600,000 in 2010 on the government announcement that
                          additional export licenses will be granted due to sufficient domestic supplies.

                     •    Uruguay is raised 126,000 tons to a record 926,000 for 2009 and raised 108,000 tons to
                          742,000 for 2008 based on new trade data.

                Selected Importers:

                     •    South Africa is boosted 150,000 tons to 800,000 for 2009 on near-final trade data.

                     •    Venezuela is doubled to 300,000 tons for 2010 on weather-related crop shortages.


                                                                Grain: World Markets and Trade, February 2010

                                                                  8
Foreign Agricultural Service/USDA
Office of Global Analysis                                                                                                         February 2010
World Rice Trade
                                                       January/December Year, Thousand Metric Tons
                                                  2004/05              2005/06              2006/07        2007/08    2008/09    2009/10
                                                                                                                                     Feb

                                                                                                                                    none
     TY Exports
       Argentina                                        348                  487                    436        408        600        550
       Brazil                                           272                  291                    201        511        650        300
       Burma                                            190                   47                     31        541       1,052       800
       Cambodia                                         200                  350                    450        500        800        800
       China                                            656                1,216                   1,340       969        760       1,500
       Egypt                                          1,095                  958                   1,209       750        500        600
       EU-27                                            201                  144                    139        157        140        135
       Guyana                                           182                  250                    210        210        250        220
       India                                          4,687                4,537                   6,301      3,383      2,000      2,000
       Japan                                            200                  200                    200        200        200        200
       Pakistan                                       3,032                3,579                   2,696      3,000      3,000      3,800
       Peru                                                5                  10                     20         17         90         90
       Thailand                                       7,274                7,376                   9,557     10,011      8,570     10,000
       Uruguay                                          762                  812                    734        742        926        750
       Vietnam                                        5,174                4,705                   4,522      4,649      5,950      5,500
       Others                                           815                  876                    809        430        441        450
                 Subtotal                            25,093               25,838               28,855        26,478     25,929     27,695
                 United States                        3,863                3,307                   3,029      3,273      3,100      3,150
                 World Total                         28,956               29,145               31,884        29,751     29,029     30,845
                                                                                                                                    none
     TY Imports
       Bangladesh                                       785                  531                   1,570      1,658       150        500
       Brazil                                           548                  691                    684        417        630        750
       Canada                                           321                  333                    341        365        345        340
       China                                            609                  654                    472        295        330        350
       Cote d'Ivoire                                    850                  750                    980        800        800        860
       Cuba                                             736                  594                    574        558        425        575
       EU-27                                          1,089                1,221                   1,342      1,520      1,350      1,350
       Ghana                                            450                  440                    340        300        350        350
       Guinea                                           221                  200                    240        150        150        330
       Haiti                                            328                  399                    292        320        300        325
       Hong Kong                                        347                  309                    348        399        395        400
       Iran                                           1,200                1,500                   1,500      1,500      1,700      1,700
       Iraq                                             786                1,306                    613        975       1,000      1,100
       Japan                                            787                  681                    642        546        700        700
       Malaysia                                         751                  886                    799       1,020       830        850
       Mexico                                           553                  586                    609        578        610        600
       Mozambique                                       350                  330                    410        300        350        350
       Nigeria                                        1,777                1,600                   1,550      1,600      1,900      1,600
       Philippines                                    1,890                1,791                   1,900      2,500      2,000      2,600
       Saudi Arabia                                   1,357                  958                    961       1,360      1,370      1,400
       Senegal                                          850                  600                    700        860        715        700
       Singapore                                        375                  350                    393        320        300        350
       South Africa                                     764                  800                    960        665        800        800
       Vietnam                                          320                  350                    450        300        500        500
       Yemen                                            250                  250                    338        325        325        325
       Others                                         8,195                7,680                   9,649      7,958      7,790      8,419
                 Subtotal                            26,489               25,790               28,657        27,589     26,115     28,124
                 Unaccounted                          2,048                2,722                   2,532      1,511      2,214      1,986
                 United States                          419                  633                    695        651        700        735
                 World Total                         28,956               29,145               31,884        29,751     29,029     30,845


      TY=Trade Year, see Endnotes.

      Note about dates: 2009/10 is calendar year 2010, 2008/09 is calendar year 2009, and so on.


Foreign Agricultural Service/USDA
Office of Global Analysis                                                                                                        February 2010
World Rice Production, Consumption, and Stocks
                                                            Local Marketing Years, Thousand Metric Tons
                                                       2004/05         2005/06         2006/07            2007/08    2008/09    2009/10
                                                                                                                                    Feb

                                                                                                                                   none
     Milled Production
       Bangladesh                                        25,600          28,758          29,000             28,800     31,000     30,000
       Brazil                                             8,996           7,874           7,695              8,199      8,569      7,820
       Burma                                              9,570          10,440          10,600             10,730     10,150     10,730
       Cambodia                                           2,627           3,771           3,946              4,238      4,520      4,630
       China                                            125,363         126,414         127,200            130,224    134,330    137,000
       Egypt                                              4,128           4,135           4,383              4,385      4,387      4,374
       India                                             83,130          91,790          93,350             96,690     99,150     84,500
       Indonesia                                         34,830          34,959          35,300             37,000     38,300     38,800
       Japan                                              7,944           8,257           7,786              7,930      8,029      7,620
       Korea, South                                       5,000           4,768           4,680              4,408      4,843      4,910
       Nigeria                                            2,300           2,700           2,900              3,000      3,200      3,400
       Pakistan                                           5,025           5,547           5,450              5,700      6,700      6,200
       Philippines                                        9,425           9,821           9,775             10,479     10,753     10,200
       Thailand                                          17,360          18,200          18,250             19,800     19,850     20,400
       Vietnam                                           22,716          22,772          22,922             24,375     24,388     24,300
       Others                                            30,347          31,257          31,275             32,083     32,625     34,364
                 Subtotal                               394,361         411,463         414,512            428,041    440,794    429,248
                 United States                            7,462           7,105           6,267              6,344      6,515      7,030
                 World Total                            401,823         418,568         420,779            434,385    447,309    436,278
                                                                                                                                   none
     Consumption and Residual
       Bangladesh                                        26,900          29,000          29,764             30,747     31,000     31,100
       Brazil                                             9,074           8,460           7,925              8,254      8,529      8,600
       Burma                                             10,300          10,400          10,670             10,249      9,550      9,850
       Cambodia                                           2,777           3,571           3,646              3,788      3,770      3,880
       China                                            130,300         128,000         127,200            127,450    129,000    133,500
       Egypt                                              3,250           3,320           3,276              3,340      4,000      4,000
       India                                             80,861          85,088          86,700             90,466     93,150     86,700
       Indonesia                                         35,850          35,739          35,900             36,350     37,090     37,600
       Iran                                               2,986           3,274           3,550              3,575      3,550      3,600
       Japan                                              8,300           8,250           8,250              8,177      8,370      8,200
       Korea, South                                       4,951           4,766           4,887              4,670      4,972      4,978
       Nigeria                                            4,250           4,300           4,400              4,500      5,100      5,100
       Philippines                                       10,400          10,722          12,000             13,499     13,650     13,785
       Thailand                                           9,480           9,544           9,780              9,600      9,500      9,600
       Vietnam                                           17,595          18,392          18,775             19,400     19,000     19,150
       Others                                            46,043          46,032          47,545             48,327     49,375     50,727
                 Subtotal                               405,558         412,140         417,567            424,432    430,840    432,954
                 United States                            3,934           3,828           4,102              4,078      4,100      4,171
                 World Total                            409,492         415,968         421,669            428,510    434,940    437,125
                                                                                                                                   none
     Ending Stocks
       China                                             38,931          36,783          35,915             38,015     42,915     45,265
       India                                              8,500          10,520          11,430             13,000     17,000     13,000
       Indonesia                                          3,448           3,207           4,607              5,607      7,057      8,487
       Japan                                              1,919           2,395           2,406              2,556      2,715      2,635
       Philippines                                        4,572           5,293           4,868              4,418      4,121      3,136
       Thailand                                           2,312           3,594           2,510              2,707      4,787      5,887
       Vietnam                                            1,292           1,317           1,392              2,018      1,956      2,106
       Others                                            11,205          11,510          10,706             11,712     11,819     10,710
                 Subtotal                                72,179          74,619          73,834             80,033     92,370     91,226
                 United States                            1,211           1,371           1,266               942        974       1,271
                 World Total                             73,390          75,990          75,100             80,975     93,344     92,497


      Note: All data are reported on a milled basis.


Foreign Agricultural Service/USDA
Office of Global Analysis                                                                                                       February 2010
Regional Rice Imports, Production, Consumption, and Stocks
                                                                         Thousand Metric Tons

                                                                                                                                                             Feb
                                                 2004/05               2005/06               2006/07               2007/08               2008/09         2009/10

     TY Imports                                                                                                                                              none
       North America                                  1,293                 1,552                 1,645                 1,594                    1,655       1,675
       Caribbean                                      1,213                 1,111                   965                 1,028                     820        1,005
       South America                                    964                 1,095                 1,080                 1,119                    1,188       1,355
       Other Europe                                     114                   138                   137                    98                     125         120
       Former Soviet Union - 12                         526                   504                   361                   335                     355         325
       Middle East                                    4,879                 5,204                 4,778                 5,728                    5,785       5,910
       North Africa                                     261                   233                   355                   280                     160         145
       Sub-Saharan Africa                             8,225                 7,512                 7,804                 7,284                    7,897       8,045
       East Asia                                      2,119                 2,017                 2,318                 1,646                    1,825       1,926
       South Asia                                     1,202                   925                 1,962                 2,063                     490        1,110
       Southeast Asia                                 4,236                 4,122                 5,742                 4,637                    4,300       4,935
       Others                                         1,876                 2,010                 2,205                 2,428                    2,215       2,308
         Total                                       26,908                26,423                29,352                28,240                26,815         28,859
     Production                                                                                                                                              none
       North America                                  7,657                 7,286                 6,445                 6,522                    6,690       7,220
       Caribbean                                        760                   685                   798                   796                     882         932
       South America                                 16,217                14,557                14,292                15,649                16,014         15,072
       European Union                                 1,880                 1,731                 1,676                 1,757                    1,680       1,988
       Former Soviet Union - 12                         770                   871                 1,000                 1,005                     915        1,095
       Middle East                                    2,145                 2,372                 2,538                 2,738                    2,085       2,496
       North Africa                                   4,148                 4,170                 4,413                 4,406                    4,408       4,409
       Sub-Saharan Africa                             7,892                 8,804                 9,376                 9,557                10,468         11,016
       East Asia                                    141,118               142,492              142,661               145,044               150,104         152,250
       South Asia                                   119,009               131,367              133,111               136,535               142,095         126,598
       Southeast Asia                                99,462               102,944              103,778               109,823               111,292         112,536
       Others                                           765                 1,289                   691                   553                     676         666
         Total                                      401,823               418,568              420,779               434,385               447,309         436,278
     Domestic Consumption                                                                                                                                    none
       North America                                  5,005                 4,936                 5,231                 5,143                    5,225       5,291
       Central America                                1,079                 1,064                 1,102                 1,116                    1,108       1,073
       Caribbean                                      1,990                 1,732                 1,829                 1,863                    1,737       1,930
       South America                                 14,930                14,002                13,418                14,053                14,697         14,699
       European Union                                 2,636                 2,651                 2,911                 3,185                    2,970       3,108
       Former Soviet Union - 12                       1,332                 1,346                 1,342                 1,283                    1,241       1,330
       Middle East                                    6,756                 7,629                 7,586                 7,809                    7,976       8,235
       North Africa                                   3,531                 3,575                 3,546                 3,636                    4,146       4,170
       Sub-Saharan Africa                            16,100                16,581                17,050                17,503                17,943         18,920
       East Asia                                    147,014               144,371              144,289               143,315               145,800         149,920
       South Asia                                   115,884               121,673              124,366               129,650               133,215         126,645
       Southeast Asia                                90,387                92,459                94,986                97,250                97,048         98,596
       Others                                           607                   667                   714                   664                     600         624
         Total                                      407,251               412,686              418,370               426,470               433,706         434,541
     Ending Stocks                                                                                                                                           none
       North America                                  1,385                 1,530                 1,409                 1,135                    1,140       1,442
       Central America                                  297                   271                   299                   255                     207         213
       Caribbean                                        159                   225                   178                   134                     109         106
       South America                                  2,472                 2,199                 2,230                 2,488                    2,518       2,078
       European Union                                 1,138                 1,181                 1,138                 1,126                    1,020       1,115
       Middle East                                    1,728                 2,079                 1,697                 1,977                    1,826       1,902
       North Africa                                     502                   366                   370                   685                     792         576
       Sub-Saharan Africa                             1,494                 1,330                 1,021                 1,341                    1,000       1,001
       East Asia                                     41,916                40,329                39,317                41,537                46,657         49,157
       South Asia                                     9,038                11,317                12,636                14,306                19,193         14,286
       Southeast Asia                                12,648                14,469                14,426                15,780                18,732         20,465
       Oceania                                          431                   515                   230                    52                      26          22
       Others                                           182                   179                   149                   159                     124         134
         Total                                       73,390                75,990                75,100                80,975                93,344         92,497


     NOTES: Regional definitions appear on last page of this circular. Imports are reported on a trade year basis. All other data are reported
     using local marketing years.


Foreign Agricultural Service/USDA
Office of Global Analysis                                                                                                                                 February 2010
COARSE GRAINS: WORLD MARKETS AND TRADE

                PRICES:

                Throughout January, U.S. corn export                                Corn Weekly Export Bids
                quotes continued a nearly $30 per ton slide               200
                to about $165 following USDA data
                                                                          190
                indicating a record crop. Argentine and
                Brazilian quotes largely moved with U.S.,                 180


                                                                   $/MT
                but the normal pre-harvest discount ($20)
                has narrowed because of strong sales and                  170
                shipments.                                                160

                                                                          150


                                                                           22 n
                                                                           29 n
                                                                                  n
                                                                                eb
                                                                           20 v
                                                                                ov
                                                                                ov


                                                                           18 c
                                                                           25 c
                                                                                ec
                                                                                 ct
                                                                                ov


                                                                                ec


                                                                                an
                                                                                an
                                                                                o


                                                                                e
                                                                                e


                                                                              -Ja
                                                                              -Ja
                                                                              -Ja
                                                                              -O


                                                                             -N
                                                                             -N
                                                                             -N


                                                                             -D
                                                                             -D
                                                                             -D
                                                                            6-N


                                                                            4-D


                                                                            5-F
                                                                            1-J
                                                                            8-J
                                                                           30


                                                                           15
                                                                           13


                                                                           27


                                                                           11
                TRADE CHANGES IN 2009/10                                          U.S. Gulf               A rgentina Up River
                                                                                  B razil P aranagua
                Selected Exporters

                       •    U.S. corn is cut 2.0 million tons to 50.0 million based on the pace of shipments, despite
                            some improved sales in recent weeks.

                       •    Argentine corn is raised 2.0 million tons to 9.5 million because of strong shipments in
                            recent months and improved prospects for new crop corn.

                       •    EU barley is lowered 500,000 tons to 1.5 million, the lowest in 6 years, on the
                            continued slow pace of export licenses and large early-season intervention offers.

                       •    Turkey barley is raised 450,000 tons to 500,000 on large feed-barley export tenders by
                            the Turkish Grain Board.

                       •    U.S. sorghum is boosted 200,000 tons to 3.8 million with commitments running well
                            ahead of last year. (Japanese and Mexican sorghum imports are each boosted 100,000
                            tons.)

                Selected Importers

                       •    Vietnamese corn is boosted 200,000 tons to 900,000 based on strong trade with
                            Thailand.

                       •    Iran barley is lowered 200,000 tons based on a slow early-season import pace.


                                                                   Grain: World Markets and Trade, February 2010

Foreign Agricultural Service/USDA                                 12
Office of Global Analysis                                                                                                       February 2010
World Coarse Grain Trade
                                        October/September Year, Thousand Metric Tons
                                     2004/05        2005/06         2006/07        2007/08       2008/09    2009/10
                                                                                                                Feb

                                                                                                               none
     TY Exports
       Argentina                       14,371         11,243          17,191            17,786     10,241     11,405
       Australia                        4,996          5,614           1,993             3,895      4,874      5,060
       Brazil                           1,457          2,826           8,188             8,032      7,183      9,100
       Canada                           3,217          4,010           3,787             6,379      3,848      3,625
       EU-27                            5,952          3,652           5,463             4,679      4,338      3,280
       India                             505            501             721              5,539      2,400      1,025
       Russia                           1,534          1,452           1,836             1,419      4,943      2,450
       Serbia                              nr             nr            863               132       1,478      2,005
       South Africa                     1,553          1,429            462              1,145      2,159      2,540
       Ukraine                          6,465          7,439           3,942             5,909     11,380     11,015
       Others                          10,457          8,888          10,976             5,574      5,349      5,270
                 Subtotal              50,507         47,054          55,422            60,489     58,193     56,775
                 United States         50,692         61,443          59,157            68,289     51,718     53,950
                 World Total          101,199        108,497         114,579           128,778    109,911    110,725
                                                                                                               none
     TY Imports
       Algeria                          2,273          2,139           2,588             2,433      2,080      2,105
       Brazil                            745           1,107           1,472             1,258      1,494       950
       Canada                           2,339          2,029           2,285             3,187      1,900      2,070
       Chile                            1,189          1,678           1,766             1,969      1,261      1,625
       China                            2,073          2,306           1,156             1,157      1,651      1,635
       Colombia                         2,516          3,380           3,714             3,603      3,652      3,775
       Dominican Republic               1,031          1,068           1,212             1,074       900       1,000
       Egypt                            5,405          4,418           4,845             4,174      5,066      4,225
       EU-27                            2,906          2,883           8,738            19,892      2,996      2,830
       Iran                             3,858          3,000           3,600             3,900      5,000      3,700
       Israel                           1,700          1,588           1,684             1,776      1,461      1,425
       Japan                           19,709         19,765          19,668            19,210     19,611     19,460
       Jordan                            938           1,234           1,186              889        825        850
       Kenya                             269            115               6               210       1,304      1,060
       Korea, South                     8,710          8,545           8,797             9,358      7,254      7,570
       Malaysia                         2,406          2,517           2,363             3,181      2,400      2,600
       Mexico                           8,977          9,928          11,040            11,011     10,467     12,450
       Morocco                          1,989          1,975           2,150             2,185      1,784      1,735
       Peru                             1,366          1,548           1,646             1,592      1,399      1,620
       Saudi Arabia                     7,724          8,575           7,578             9,968      9,185      9,305
       Syria                            2,281          2,006           2,079             2,511      2,850      2,900
       Taiwan                           4,757          4,743           4,403             4,684      4,672      4,725
       Tunisia                          1,228          1,230           1,519             1,183       900       1,100
       Venezuela                         107            152             534              1,103      1,341      1,300
       Vietnam                           291            475             650               700       1,100       900
       Others                          11,444         14,193          13,899            14,367     12,243     12,060
                 Subtotal              98,231        102,597         110,578           126,575    104,796    104,975
                 Unaccounted             726           3,605           1,396            -1,407      2,308      3,125
                 United States          2,242          2,295           2,605             3,610      2,807      2,625
                 World Total          101,199        108,497         114,579           128,778    109,911    110,725


      TY=Trade Year, see Endnotes.


Foreign Agricultural Service/USDA
Office of Global Analysis                                                                                   February 2010
World Coarse Grains Production, Consumption, and Stocks
                                             Local Marketing Years, Thousand Metric Tons
                                       2004/05          2005/06         2006/07            2007/08     2008/09     2009/10
                                                                                                                       Feb

                                                                                                                       none
     Production
       Argentina                         24,899           19,351          27,034             26,974      16,223      22,673
       Australia                         11,409           13,527           6,583             12,895      11,970      11,817
       Brazil                            37,874           44,167          53,184             61,344      53,624      53,614
       Canada                            25,602           24,939          23,145             27,841      27,167      22,373
       China                            138,252          147,696         159,098            159,105     172,700     162,000
       Ethiopia                           5,763            7,179           7,928              8,302       9,236       8,825
       EU-27                            166,579          146,267         137,421            136,123     161,579     152,580
       India                             33,560           34,040          33,810             40,630      39,170      33,600
       Indonesia                          7,200            6,800           7,850              8,500       8,700       9,000
       Mexico                            28,975           25,887          29,181             30,577      31,485      29,329
       Nigeria                           23,200           24,700          26,000             24,000      26,600      27,500
       Russia                            29,600           27,600          30,200             29,325      40,700      31,800
       South Africa                      12,209            7,311           7,760             13,690      13,084      12,003
       Turkey                            11,055           11,955          10,896              9,480      10,315      10,395
       Ukraine                           23,000           18,140          19,175             14,585      26,220      24,120
       Others                           116,221          120,485         126,891            124,632     126,938     133,597
                  Subtotal              695,398          680,044         706,156            728,003     775,711     745,226
                  United States         319,378          298,710         279,998            349,861     325,867     350,258
                  World Total          1,014,776         978,754         986,154           1,077,864   1,101,578   1,095,484
                                                                                                                       none
     Domestic Consumption
       Argentina                          9,055            9,471           9,519              9,897       6,673      10,073
       Brazil                            41,558           42,197          43,304             45,279      47,504      48,279
       Canada                            22,944           22,859          24,505             24,021      22,850      22,173
       China                            141,072          147,105         153,465            157,015     160,425     167,575
       Egypt                             12,364           11,163          11,800             11,477      11,863      11,980
       EU-27                            152,573          147,538         147,877            154,155     152,105     153,205
       India                             33,240           33,800          32,520             35,500      36,400      32,850
       Japan                             19,881           20,089          19,823             19,460      19,710      19,605
       Mexico                            38,335           37,600          39,970             40,310      42,135      42,550
       Nigeria                           22,950           24,450          25,750             24,000      26,450      27,550
       Russia                            29,400           27,700          28,600             28,875      32,650      31,450
       Saudi Arabia                       7,160            8,235           8,760              9,680       9,580      10,080
       South Africa                      10,283            8,768           9,153             10,158      10,573      10,803
       Turkey                            11,536           11,462          11,602             10,609      10,575      10,310
       Ukraine                           15,175           12,415          13,150             11,835      13,720      13,590
       Others                           168,703          181,547         184,822            188,797     191,614     194,417
                  Subtotal              737,569          747,731         769,337            781,499     796,776     808,842
                  United States         240,177          245,022         242,798            274,533     275,748     296,675
                  World Total           977,746          992,753        1,012,135          1,056,032   1,072,524   1,105,517
                                                                                                                       none
     Ending Stocks
       Australia                          2,153            2,804           1,205              2,666       3,330       3,400
       Brazil                             4,380            3,187           3,772             12,865      13,582      10,567
       Canada                             6,356            6,347           3,501              4,010       6,355       5,000
       China                             37,564           36,705          38,032             40,426      54,131      49,621
       EU-27                             25,128           22,275          15,138             12,768      20,102      18,977
       Mexico                             5,400            3,376           3,426              4,565       4,222       3,401
       South Africa                       3,435            2,443           1,776              3,251       3,382       3,172
       Others                            35,439           32,752          35,651             34,897      37,397      36,706
                  Subtotal              119,855          109,889         102,501            115,448     142,501     130,844
                  United States          58,800           54,767          36,174             45,059      47,060      48,684
                  World Total           178,655          164,656         138,675            160,507     189,561     179,528


Foreign Agricultural Service/USDA
Office of Global Analysis                                                                                          February 2010
Regional Coarse Grains Imports, Production, Consumption, and Stocks
                                                                          Thousand Metric Tons

                                                                                                                                                             Feb
                                                 2004/05                2005/06               2006/07               2007/08               2008/09        2009/10

     TY Imports                                                                                                                                              none
       North America                                 13,558                14,252                15,930                17,808                15,174         17,145
       Central America                                 2,405                 2,803                2,906                 2,681                    2,440       2,825
       Caribbean                                       1,913                 1,969                2,227                 2,239                    2,000       2,150
       South America                                   6,462                 8,791               10,181                10,672                10,149         10,150
       European Union                                  2,906                 2,883                8,738                19,892                    2,996       2,830
       Former Soviet Union - 12                        1,129                 1,052                  949                 1,027                     564         545
       Middle East                                   17,940                17,835                18,674                21,819                21,261         19,880
       North Africa                                  11,603                10,481                11,671                10,755                10,730         10,015
       Sub-Saharan Africa                              2,738                 3,540                2,387                 2,679                    3,244       2,845
       East Asia                                     35,661                35,613                34,135                34,662                33,438         33,640
       Southeast Asia                                  3,499                 4,897                4,394                 4,746                    4,739       4,550
       Others                                            659                   776                  991                 1,205                     868        1,025
         Total                                      100,473               104,892               113,183               130,185               107,603        107,600
     Production                                                                                                                                              none
       North America                                373,955               349,536               332,324               408,279               384,519        401,960
       South America                                 73,026                73,858                92,137               100,084                81,449         88,329
       European Union                               166,579               146,267               137,421               136,123               161,579        152,580
       Other Europe                                  12,781                12,659                11,568                 9,370                12,292         11,718
       Former Soviet Union - 12                      63,030                55,307                58,701                53,912                78,140         67,440
       Middle East                                   18,876                19,998                19,060                17,381                15,933         16,977
       North Africa                                  11,786                  9,371               11,211                 9,894                    9,871      13,932
       Sub-Saharan Africa                            77,479                81,425                87,260                90,587                94,703         95,036
       East Asia                                    140,518               149,899               161,399               161,295               174,874        164,141
       South Asia                                    39,291                40,395                40,020                46,925                45,128         39,908
       Southeast Asia                                21,583                22,000                23,838                26,062                26,153         26,840
       Oceania                                       12,034                14,174                 7,230                13,542                12,617         12,464
       Others                                          3,838                 3,865                3,985                 4,410                    4,320       4,159
         Total                                    1,014,776               978,754               986,154             1,077,864             1,101,578      1,095,484
     Domestic Consumption                                                                                                                                    none
       North America                                301,456               305,481               307,273               338,864               340,733        361,398
       South America                                 65,791                68,213                70,951                74,697                73,222         78,324
       European Union                               152,573               147,538               147,877               154,155               152,105        153,205
       Other Europe                                  12,174                12,044                11,533                10,456                10,604         10,775
       Former Soviet Union - 12                      54,628                50,113                51,260                50,444                57,441         55,795
       Middle East                                   35,041                37,188                37,607                37,827                37,890         37,516
       North Africa                                  21,816                20,820                22,029                21,161                20,748         22,710
       Sub-Saharan Africa                            77,459                84,638                88,391                88,359                94,560         95,497
       East Asia                                    177,081               182,819               188,963               191,868               194,920        201,809
       South Asia                                    38,890                40,067                38,801                42,052                42,416         39,233
       Southeast Asia                                23,814                26,093                26,834                28,740                29,598         30,315
       Oceania                                         7,478                 7,940                6,885                 7,666                    7,347       7,437
       Others                                          8,205                 8,467                9,014                 9,312                    8,991       9,151
         Total                                      976,406               991,421             1,007,418             1,055,601             1,070,575      1,103,165
     Ending Stocks                                                                                                                                           none
       North America                                 70,556                64,490                43,101                53,634                57,637         57,085
       South America                                   9,670                 7,676                9,060                18,476                16,789         15,027
       European Union                                25,128                22,275                15,138                12,768                20,102         18,977
       Other Europe                                    1,607                 1,491                1,520                 1,291                    1,821       1,589
       Former Soviet Union - 12                        7,393                 5,105                5,093                 4,301                    8,506       6,555
       Middle East                                     7,442                 7,951                8,167                 7,498                    7,882       6,973
       North Africa                                    3,640                 2,675                3,166                 2,419                    2,528       3,765
       Sub-Saharan Africa                              5,180                 5,120                5,240                 6,536                    6,886       7,125
       East Asia                                     41,705                40,586                41,793                44,954                58,125         53,527
       South Asia                                      1,543                 1,401                1,455                 1,580                    1,795       1,535
       Southeast Asia                                  1,743                 2,100                2,644                 3,282                    3,302       3,142
       Oceania                                         2,234                 2,883                1,293                 2,729                    3,390       3,457
       Others                                            814                   903                1,005                 1,039                     798         771
         Total                                      178,655               164,656               138,675               160,507               189,561        179,528


     NOTES: Regional definitions appear on last page of this circular. Imports are reported on a trade year basis. All other data are reported
     using local marketing years.


Foreign Agricultural Service/USDA
Office of Global Analysis                                                                                                                                 February 2010
Grains World Markets And Trade   February 2010

Más contenido relacionado

Destacado

Destacado (14)

Oil Seeds World Markets And Trade
Oil Seeds World Markets And TradeOil Seeds World Markets And Trade
Oil Seeds World Markets And Trade
 
Fao picture book on avian diseases
Fao picture book on avian diseasesFao picture book on avian diseases
Fao picture book on avian diseases
 
Manual of quality analysis - Soya products
Manual of quality analysis - Soya productsManual of quality analysis - Soya products
Manual of quality analysis - Soya products
 
Poultry Housing And Manure Management Systems
Poultry Housing And Manure Management SystemsPoultry Housing And Manure Management Systems
Poultry Housing And Manure Management Systems
 
Six sigma management students(p)
Six sigma   management students(p)Six sigma   management students(p)
Six sigma management students(p)
 
Ideal Amino Acid Profile For Poultry
Ideal Amino Acid Profile For PoultryIdeal Amino Acid Profile For Poultry
Ideal Amino Acid Profile For Poultry
 
Rutgers Green Belt
Rutgers Green BeltRutgers Green Belt
Rutgers Green Belt
 
Quality and safety of animal feed in india
Quality and safety of animal feed in indiaQuality and safety of animal feed in india
Quality and safety of animal feed in india
 
Six Sigma Green Belt for Beginners in a Nutshell
Six Sigma Green Belt for Beginners in a NutshellSix Sigma Green Belt for Beginners in a Nutshell
Six Sigma Green Belt for Beginners in a Nutshell
 
Supervisory Training
Supervisory TrainingSupervisory Training
Supervisory Training
 
Basic Supervisory Skills
Basic Supervisory SkillsBasic Supervisory Skills
Basic Supervisory Skills
 
Team Effectiveness
Team EffectivenessTeam Effectiveness
Team Effectiveness
 
Team Building
Team BuildingTeam Building
Team Building
 
Team management
Team managementTeam management
Team management
 

Similar a Grains World Markets And Trade February 2010

Fmi Pr08236anx
Fmi Pr08236anxFmi Pr08236anx
Fmi Pr08236anxG Garcia
 
Trends in wheat production and consumption in Sudan
Trends in wheat production and consumption in SudanTrends in wheat production and consumption in Sudan
Trends in wheat production and consumption in SudanCIMMYT
 
Soybean College - Gary Schnitkey, Ph.D.
Soybean College - Gary Schnitkey, Ph.D.Soybean College - Gary Schnitkey, Ph.D.
Soybean College - Gary Schnitkey, Ph.D.Clara Miles
 
Fact sheet industry facts iata
Fact sheet industry facts   iataFact sheet industry facts   iata
Fact sheet industry facts iataprinci05
 
Informe Estatistico do Cafe Dezembro 2009
Informe Estatistico do Cafe Dezembro 2009Informe Estatistico do Cafe Dezembro 2009
Informe Estatistico do Cafe Dezembro 2009Revista Cafeicultura
 
INFORME ESTATÍSTICO DO CAFÉ - Novembro 09
INFORME ESTATÍSTICO DO CAFÉ -  Novembro 09INFORME ESTATÍSTICO DO CAFÉ -  Novembro 09
INFORME ESTATÍSTICO DO CAFÉ - Novembro 09Revista Cafeicultura
 
Spatial Integration of Cereal markets in Ethiopia
Spatial Integration of Cereal markets in EthiopiaSpatial Integration of Cereal markets in Ethiopia
Spatial Integration of Cereal markets in Ethiopiaessp2
 
Global tea market review faitta presentation
Global tea market review   faitta presentationGlobal tea market review   faitta presentation
Global tea market review faitta presentationsachen
 
اثر اتفاقية اغادير على الميزان التجارى بين مصر ودول الاتفاقية
اثر اتفاقية اغادير على الميزان التجارى بين مصر ودول الاتفاقيةاثر اتفاقية اغادير على الميزان التجارى بين مصر ودول الاتفاقية
اثر اتفاقية اغادير على الميزان التجارى بين مصر ودول الاتفاقيةخالد سمير الهلالي
 
World Agricultural Outlook Board Interagency Commodity Estimates Committee Fo...
World Agricultural Outlook Board Interagency Commodity Estimates Committee Fo...World Agricultural Outlook Board Interagency Commodity Estimates Committee Fo...
World Agricultural Outlook Board Interagency Commodity Estimates Committee Fo...MedfordCooperative
 
enterpriseSeattle Forecast 2012 - Ken Goldstein
enterpriseSeattle Forecast 2012 - Ken GoldsteinenterpriseSeattle Forecast 2012 - Ken Goldstein
enterpriseSeattle Forecast 2012 - Ken GoldsteinenterpriseSeattle
 
Sweetener Colloquium.Grains & Oilseeds
Sweetener Colloquium.Grains & OilseedsSweetener Colloquium.Grains & Oilseeds
Sweetener Colloquium.Grains & OilseedsIntlFood
 
Foreign Exchange Rationing and Food Security in Ethiopia
Foreign Exchange Rationing and Food Security in EthiopiaForeign Exchange Rationing and Food Security in Ethiopia
Foreign Exchange Rationing and Food Security in Ethiopiaessp2
 
Dr. Michael Swanson's Slides from the 2014 Minnesota AgriGrowth Council Annua...
Dr. Michael Swanson's Slides from the 2014 Minnesota AgriGrowth Council Annua...Dr. Michael Swanson's Slides from the 2014 Minnesota AgriGrowth Council Annua...
Dr. Michael Swanson's Slides from the 2014 Minnesota AgriGrowth Council Annua...Minnesota AgriGrowth Council
 

Similar a Grains World Markets And Trade February 2010 (20)

Fmi Pr08236anx
Fmi Pr08236anxFmi Pr08236anx
Fmi Pr08236anx
 
Survey 1
Survey 1Survey 1
Survey 1
 
02 agriculture
02 agriculture02 agriculture
02 agriculture
 
4 q2014stats
4 q2014stats4 q2014stats
4 q2014stats
 
Trends in wheat production and consumption in Sudan
Trends in wheat production and consumption in SudanTrends in wheat production and consumption in Sudan
Trends in wheat production and consumption in Sudan
 
Soybean College - Gary Schnitkey, Ph.D.
Soybean College - Gary Schnitkey, Ph.D.Soybean College - Gary Schnitkey, Ph.D.
Soybean College - Gary Schnitkey, Ph.D.
 
Fact sheet industry facts iata
Fact sheet industry facts   iataFact sheet industry facts   iata
Fact sheet industry facts iata
 
Informe Estatistico do Cafe Dezembro 2009
Informe Estatistico do Cafe Dezembro 2009Informe Estatistico do Cafe Dezembro 2009
Informe Estatistico do Cafe Dezembro 2009
 
INFORME ESTATÍSTICO DO CAFÉ - Novembro 09
INFORME ESTATÍSTICO DO CAFÉ -  Novembro 09INFORME ESTATÍSTICO DO CAFÉ -  Novembro 09
INFORME ESTATÍSTICO DO CAFÉ - Novembro 09
 
EU agricultural trade policy and agricultural trade with developing countries
EU agricultural trade policy and agricultural trade with developing countriesEU agricultural trade policy and agricultural trade with developing countries
EU agricultural trade policy and agricultural trade with developing countries
 
Spatial Integration of Cereal markets in Ethiopia
Spatial Integration of Cereal markets in EthiopiaSpatial Integration of Cereal markets in Ethiopia
Spatial Integration of Cereal markets in Ethiopia
 
Global tea market review faitta presentation
Global tea market review   faitta presentationGlobal tea market review   faitta presentation
Global tea market review faitta presentation
 
اثر اتفاقية اغادير على الميزان التجارى بين مصر ودول الاتفاقية
اثر اتفاقية اغادير على الميزان التجارى بين مصر ودول الاتفاقيةاثر اتفاقية اغادير على الميزان التجارى بين مصر ودول الاتفاقية
اثر اتفاقية اغادير على الميزان التجارى بين مصر ودول الاتفاقية
 
World Agricultural Outlook Board Interagency Commodity Estimates Committee Fo...
World Agricultural Outlook Board Interagency Commodity Estimates Committee Fo...World Agricultural Outlook Board Interagency Commodity Estimates Committee Fo...
World Agricultural Outlook Board Interagency Commodity Estimates Committee Fo...
 
OCDE, Previsiones
OCDE, PrevisionesOCDE, Previsiones
OCDE, Previsiones
 
enterpriseSeattle Forecast 2012 - Ken Goldstein
enterpriseSeattle Forecast 2012 - Ken GoldsteinenterpriseSeattle Forecast 2012 - Ken Goldstein
enterpriseSeattle Forecast 2012 - Ken Goldstein
 
Sweetener Colloquium.Grains & Oilseeds
Sweetener Colloquium.Grains & OilseedsSweetener Colloquium.Grains & Oilseeds
Sweetener Colloquium.Grains & Oilseeds
 
Foreign Exchange Rationing and Food Security in Ethiopia
Foreign Exchange Rationing and Food Security in EthiopiaForeign Exchange Rationing and Food Security in Ethiopia
Foreign Exchange Rationing and Food Security in Ethiopia
 
Dr. Michael Swanson's Slides from the 2014 Minnesota AgriGrowth Council Annua...
Dr. Michael Swanson's Slides from the 2014 Minnesota AgriGrowth Council Annua...Dr. Michael Swanson's Slides from the 2014 Minnesota AgriGrowth Council Annua...
Dr. Michael Swanson's Slides from the 2014 Minnesota AgriGrowth Council Annua...
 
S
SS
S
 

Último

Kenya’s Coconut Value Chain by Gatsby Africa
Kenya’s Coconut Value Chain by Gatsby AfricaKenya’s Coconut Value Chain by Gatsby Africa
Kenya’s Coconut Value Chain by Gatsby Africaictsugar
 
8447779800, Low rate Call girls in Uttam Nagar Delhi NCR
8447779800, Low rate Call girls in Uttam Nagar Delhi NCR8447779800, Low rate Call girls in Uttam Nagar Delhi NCR
8447779800, Low rate Call girls in Uttam Nagar Delhi NCRashishs7044
 
Marketplace and Quality Assurance Presentation - Vincent Chirchir
Marketplace and Quality Assurance Presentation - Vincent ChirchirMarketplace and Quality Assurance Presentation - Vincent Chirchir
Marketplace and Quality Assurance Presentation - Vincent Chirchirictsugar
 
/:Call Girls In Indirapuram Ghaziabad ➥9990211544 Independent Best Escorts In...
/:Call Girls In Indirapuram Ghaziabad ➥9990211544 Independent Best Escorts In.../:Call Girls In Indirapuram Ghaziabad ➥9990211544 Independent Best Escorts In...
/:Call Girls In Indirapuram Ghaziabad ➥9990211544 Independent Best Escorts In...lizamodels9
 
Investment in The Coconut Industry by Nancy Cheruiyot
Investment in The Coconut Industry by Nancy CheruiyotInvestment in The Coconut Industry by Nancy Cheruiyot
Investment in The Coconut Industry by Nancy Cheruiyotictsugar
 
Organizational Structure Running A Successful Business
Organizational Structure Running A Successful BusinessOrganizational Structure Running A Successful Business
Organizational Structure Running A Successful BusinessSeta Wicaksana
 
Flow Your Strategy at Flight Levels Day 2024
Flow Your Strategy at Flight Levels Day 2024Flow Your Strategy at Flight Levels Day 2024
Flow Your Strategy at Flight Levels Day 2024Kirill Klimov
 
Case study on tata clothing brand zudio in detail
Case study on tata clothing brand zudio in detailCase study on tata clothing brand zudio in detail
Case study on tata clothing brand zudio in detailAriel592675
 
BEST Call Girls In Greater Noida ✨ 9773824855 ✨ Escorts Service In Delhi Ncr,
BEST Call Girls In Greater Noida ✨ 9773824855 ✨ Escorts Service In Delhi Ncr,BEST Call Girls In Greater Noida ✨ 9773824855 ✨ Escorts Service In Delhi Ncr,
BEST Call Girls In Greater Noida ✨ 9773824855 ✨ Escorts Service In Delhi Ncr,noida100girls
 
Buy gmail accounts.pdf Buy Old Gmail Accounts
Buy gmail accounts.pdf Buy Old Gmail AccountsBuy gmail accounts.pdf Buy Old Gmail Accounts
Buy gmail accounts.pdf Buy Old Gmail AccountsBuy Verified Accounts
 
Call Girls Miyapur 7001305949 all area service COD available Any Time
Call Girls Miyapur 7001305949 all area service COD available Any TimeCall Girls Miyapur 7001305949 all area service COD available Any Time
Call Girls Miyapur 7001305949 all area service COD available Any Timedelhimodelshub1
 
FULL ENJOY Call girls in Paharganj Delhi | 8377087607
FULL ENJOY Call girls in Paharganj Delhi | 8377087607FULL ENJOY Call girls in Paharganj Delhi | 8377087607
FULL ENJOY Call girls in Paharganj Delhi | 8377087607dollysharma2066
 
Market Sizes Sample Report - 2024 Edition
Market Sizes Sample Report - 2024 EditionMarket Sizes Sample Report - 2024 Edition
Market Sizes Sample Report - 2024 EditionMintel Group
 
8447779800, Low rate Call girls in Kotla Mubarakpur Delhi NCR
8447779800, Low rate Call girls in Kotla Mubarakpur Delhi NCR8447779800, Low rate Call girls in Kotla Mubarakpur Delhi NCR
8447779800, Low rate Call girls in Kotla Mubarakpur Delhi NCRashishs7044
 
8447779800, Low rate Call girls in Shivaji Enclave Delhi NCR
8447779800, Low rate Call girls in Shivaji Enclave Delhi NCR8447779800, Low rate Call girls in Shivaji Enclave Delhi NCR
8447779800, Low rate Call girls in Shivaji Enclave Delhi NCRashishs7044
 
Ten Organizational Design Models to align structure and operations to busines...
Ten Organizational Design Models to align structure and operations to busines...Ten Organizational Design Models to align structure and operations to busines...
Ten Organizational Design Models to align structure and operations to busines...Seta Wicaksana
 
8447779800, Low rate Call girls in New Ashok Nagar Delhi NCR
8447779800, Low rate Call girls in New Ashok Nagar Delhi NCR8447779800, Low rate Call girls in New Ashok Nagar Delhi NCR
8447779800, Low rate Call girls in New Ashok Nagar Delhi NCRashishs7044
 
Call Girls In Sikandarpur Gurgaon ❤️8860477959_Russian 100% Genuine Escorts I...
Call Girls In Sikandarpur Gurgaon ❤️8860477959_Russian 100% Genuine Escorts I...Call Girls In Sikandarpur Gurgaon ❤️8860477959_Russian 100% Genuine Escorts I...
Call Girls In Sikandarpur Gurgaon ❤️8860477959_Russian 100% Genuine Escorts I...lizamodels9
 
Future Of Sample Report 2024 | Redacted Version
Future Of Sample Report 2024 | Redacted VersionFuture Of Sample Report 2024 | Redacted Version
Future Of Sample Report 2024 | Redacted VersionMintel Group
 

Último (20)

Kenya’s Coconut Value Chain by Gatsby Africa
Kenya’s Coconut Value Chain by Gatsby AfricaKenya’s Coconut Value Chain by Gatsby Africa
Kenya’s Coconut Value Chain by Gatsby Africa
 
8447779800, Low rate Call girls in Uttam Nagar Delhi NCR
8447779800, Low rate Call girls in Uttam Nagar Delhi NCR8447779800, Low rate Call girls in Uttam Nagar Delhi NCR
8447779800, Low rate Call girls in Uttam Nagar Delhi NCR
 
Marketplace and Quality Assurance Presentation - Vincent Chirchir
Marketplace and Quality Assurance Presentation - Vincent ChirchirMarketplace and Quality Assurance Presentation - Vincent Chirchir
Marketplace and Quality Assurance Presentation - Vincent Chirchir
 
/:Call Girls In Indirapuram Ghaziabad ➥9990211544 Independent Best Escorts In...
/:Call Girls In Indirapuram Ghaziabad ➥9990211544 Independent Best Escorts In.../:Call Girls In Indirapuram Ghaziabad ➥9990211544 Independent Best Escorts In...
/:Call Girls In Indirapuram Ghaziabad ➥9990211544 Independent Best Escorts In...
 
Investment in The Coconut Industry by Nancy Cheruiyot
Investment in The Coconut Industry by Nancy CheruiyotInvestment in The Coconut Industry by Nancy Cheruiyot
Investment in The Coconut Industry by Nancy Cheruiyot
 
Organizational Structure Running A Successful Business
Organizational Structure Running A Successful BusinessOrganizational Structure Running A Successful Business
Organizational Structure Running A Successful Business
 
Flow Your Strategy at Flight Levels Day 2024
Flow Your Strategy at Flight Levels Day 2024Flow Your Strategy at Flight Levels Day 2024
Flow Your Strategy at Flight Levels Day 2024
 
Case study on tata clothing brand zudio in detail
Case study on tata clothing brand zudio in detailCase study on tata clothing brand zudio in detail
Case study on tata clothing brand zudio in detail
 
BEST Call Girls In Greater Noida ✨ 9773824855 ✨ Escorts Service In Delhi Ncr,
BEST Call Girls In Greater Noida ✨ 9773824855 ✨ Escorts Service In Delhi Ncr,BEST Call Girls In Greater Noida ✨ 9773824855 ✨ Escorts Service In Delhi Ncr,
BEST Call Girls In Greater Noida ✨ 9773824855 ✨ Escorts Service In Delhi Ncr,
 
Buy gmail accounts.pdf Buy Old Gmail Accounts
Buy gmail accounts.pdf Buy Old Gmail AccountsBuy gmail accounts.pdf Buy Old Gmail Accounts
Buy gmail accounts.pdf Buy Old Gmail Accounts
 
Call Girls Miyapur 7001305949 all area service COD available Any Time
Call Girls Miyapur 7001305949 all area service COD available Any TimeCall Girls Miyapur 7001305949 all area service COD available Any Time
Call Girls Miyapur 7001305949 all area service COD available Any Time
 
Japan IT Week 2024 Brochure by 47Billion (English)
Japan IT Week 2024 Brochure by 47Billion (English)Japan IT Week 2024 Brochure by 47Billion (English)
Japan IT Week 2024 Brochure by 47Billion (English)
 
FULL ENJOY Call girls in Paharganj Delhi | 8377087607
FULL ENJOY Call girls in Paharganj Delhi | 8377087607FULL ENJOY Call girls in Paharganj Delhi | 8377087607
FULL ENJOY Call girls in Paharganj Delhi | 8377087607
 
Market Sizes Sample Report - 2024 Edition
Market Sizes Sample Report - 2024 EditionMarket Sizes Sample Report - 2024 Edition
Market Sizes Sample Report - 2024 Edition
 
8447779800, Low rate Call girls in Kotla Mubarakpur Delhi NCR
8447779800, Low rate Call girls in Kotla Mubarakpur Delhi NCR8447779800, Low rate Call girls in Kotla Mubarakpur Delhi NCR
8447779800, Low rate Call girls in Kotla Mubarakpur Delhi NCR
 
8447779800, Low rate Call girls in Shivaji Enclave Delhi NCR
8447779800, Low rate Call girls in Shivaji Enclave Delhi NCR8447779800, Low rate Call girls in Shivaji Enclave Delhi NCR
8447779800, Low rate Call girls in Shivaji Enclave Delhi NCR
 
Ten Organizational Design Models to align structure and operations to busines...
Ten Organizational Design Models to align structure and operations to busines...Ten Organizational Design Models to align structure and operations to busines...
Ten Organizational Design Models to align structure and operations to busines...
 
8447779800, Low rate Call girls in New Ashok Nagar Delhi NCR
8447779800, Low rate Call girls in New Ashok Nagar Delhi NCR8447779800, Low rate Call girls in New Ashok Nagar Delhi NCR
8447779800, Low rate Call girls in New Ashok Nagar Delhi NCR
 
Call Girls In Sikandarpur Gurgaon ❤️8860477959_Russian 100% Genuine Escorts I...
Call Girls In Sikandarpur Gurgaon ❤️8860477959_Russian 100% Genuine Escorts I...Call Girls In Sikandarpur Gurgaon ❤️8860477959_Russian 100% Genuine Escorts I...
Call Girls In Sikandarpur Gurgaon ❤️8860477959_Russian 100% Genuine Escorts I...
 
Future Of Sample Report 2024 | Redacted Version
Future Of Sample Report 2024 | Redacted VersionFuture Of Sample Report 2024 | Redacted Version
Future Of Sample Report 2024 | Redacted Version
 

Grains World Markets And Trade February 2010

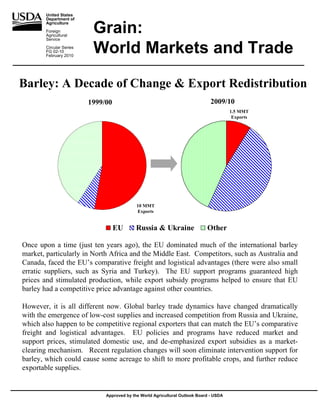
  • 1. United States Department of Grain: Agriculture Foreign Agricultural Service Circular Series FG 02-10 February 2010 World Markets and Trade Barley: A Decade of Change & Export Redistribution 1999/00 2009/10 1.5 MMT Exports 10 MMT Exports EU Russia & Ukraine Other Once upon a time (just ten years ago), the EU dominated much of the international barley market, particularly in North Africa and the Middle East. Competitors, such as Australia and Canada, faced the EU’s comparative freight and logistical advantages (there were also small erratic suppliers, such as Syria and Turkey). The EU support programs guaranteed high prices and stimulated production, while export subsidy programs helped to ensure that EU barley had a competitive price advantage against other countries. However, it is all different now. Global barley trade dynamics have changed dramatically with the emergence of low-cost supplies and increased competition from Russia and Ukraine, which also happen to be competitive regional exporters that can match the EU’s comparative freight and logistical advantages. EU policies and programs have reduced market and support prices, stimulated domestic use, and de-emphasized export subsidies as a market- clearing mechanism. Recent regulation changes will soon eliminate intervention support for barley, which could cause some acreage to shift to more profitable crops, and further reduce exportable supplies. Approved by the World Agricultural Outlook Board - USDA
  • 2. TABLE OF CONTENTS World Markets and Trade: Commentary and Current Data Wheat ................................................................................................................. 4 Rice .................................................................................................................... 8 Coarse Grains................................................................................................... 12 Historical Data Series for Selected Regions and Countries ............................ 31 Endnotes to Grain: World Markets and Trade ............................................... 50 The Foreign Agricultural Service (FAS) updates its production, supply and distribution database for cotton, oilseeds, and grains at 9 a.m. on the day the World Agricultural Supply and Demand Estimates (WASDE) report is released. It is available on the FAS website (http://www.fas.usda.gov/psdonline/). This circular is released at 10:00 a.m. on the same day, together with its downloadable data set. Grain: World Markets and Trade, February 2010 Foreign Agricultural Service/USDA 2 Office of Global Analysis February 2010
  • 3. All Grain Summary Comparison Wheat Rice, Milled Corn Marketing Year 2007/08 2008/09 2009/10 2007/08 2008/09 2009/10 2007/08 2008/09 2009/10 Production United States (Jun-May) 55.8 68.0 60.3 6.3 6.5 7.0 331.2 307.1 334.1 Other 554.6 614.7 617.1 428.0 440.8 429.2 460.7 484.4 463.8 World Total 610.5 682.7 677.4 434.4 447.3 436.3 791.9 791.5 797.8 Domestic Consumption United States (Jun-May) 28.6 34.3 32.2 4.1 4.1 4.2 261.6 259.1 282.3 Other 584.6 599.1 612.2 422.4 429.6 430.4 509.2 514.7 525.1 World Total 613.2 633.4 644.4 426.5 433.7 434.5 770.9 773.7 807.4 Ending Stocks United States (Jun-May) 8.3 17.9 26.7 0.9 1.0 1.3 41.3 42.5 43.7 Other 112.7 146.1 169.2 80.0 92.4 91.2 88.4 103.4 90.4 World Total 121.1 164.0 195.9 81.0 93.3 92.5 129.6 145.9 134.0 TY Imports United States (Jun-May) 3.0 3.5 3.3 0.7 0.7 0.7 0.5 0.3 0.3 Other 110.6 136.1 118.4 27.6 26.1 28.1 99.4 81.2 82.3 World Total 113.6 139.5 121.6 28.2 26.8 28.9 99.9 81.5 82.6 TY Exports United States (Jun-May) 34.3 27.3 22.5 3.3 3.1 3.2 60.7 47.9 50.0 Other 82.1 115.2 101.8 26.5 25.9 27.7 37.6 35.3 34.9 World Total 116.4 142.5 124.3 29.8 29.0 30.8 98.2 83.2 84.9 Note: Consumption in this table has not been adjusted for differences in marketing year imports and exports and therefore differs from global totals shown elsewhere. Marketing years for U.S. grains are: Wheat (Jun-May), Rice (Aug-Jul), Corn (Sep-Aug). 'Marketing Year' column is germane for U.S. wheat only. Foreign Agricultural Service/USDA Office of Global Analysis February 2010
  • 4. WHEAT: WORLD MARKETS AND TRADE PRICES: U.S. Weekly FOB Export Bids 300 Domestic: Prices for all classes of wheat fell through the first week in February, except for Hard Red Spring (HRS) which was unchanged. Growing global 250 supplies more than offset a slight uptick $/MT in U.S. export sales. Soft and Hard Red Winter showed the largest declines, of $24 and $18/ton, respectively, while 200 Soft White fell $10/ton. TRADE CHANGES IN 2009/10 150 Selected Exporters: 1 8 5 15 22 29 /6 3 7 /4 0 1 8 5 /2 /1 /2 /1 /1 /2 1/ 1/ 2/ 12 11 1/ 1/ 1/ 11 11 11 12 12 12 HRS HRW SRW SWW • Argentina is raised 1.0 million tons to 4.0 million on higher production and increased exportable supplies. • Pakistan is halved to 500,000 tons based on reduced exports to Afghanistan. • Turkey is up 300,000 tons to 2.6 million due to higher expected flour shipments to Iraq and Indonesia. Selected Importers: • Afghanistan is raised 700,000 tons to 2.0 million as the pace of wheat flour shipments from Kazakhstan remains brisk. • Iran is cut 1.0 million to 3.5 million based on the slow pace of imports. • Pakistan is halved to 500,000 due to increased domestic supplies and minimal imports to date. • Turkey is up 500,000 tons to 2.5 million based on the strong pace of trade, particularly from Russia. • Uzbekistan is increased 400,000 tons to 1.4 million on the strong pace of flour shipments from Kazakhstan. • United States is up 150,000 tons to 3.3 million because of expected feed-quality wheat imports from Brazil and Europe. Grain: World Markets and Trade, February 2010 4 Foreign Agricultural Service/USDA Office of Global Analysis February 2010
  • 5. World Wheat, Flour, and Products Trade July/June Year, Thousand Metric Tons 2004/05 2005/06 2006/07 2007/08 2008/09 2009/10 Feb none TY Exports Argentina 13,426 8,216 12,168 10,228 8,598 4,000 Australia 15,826 15,211 11,241 7,449 13,452 15,000 Canada 15,109 15,633 19,278 16,561 18,583 18,500 China 1,171 1,397 2,783 2,835 723 1,000 EU-27 14,745 15,701 13,816 12,271 25,318 19,000 Kazakhstan 3,039 3,817 8,089 8,181 5,701 7,500 Mexico 504 533 548 1,261 1,406 1,200 Russia 8,456 10,514 10,584 12,552 18,393 18,000 Turkey 2,235 3,208 2,200 1,763 2,342 2,600 Ukraine 4,403 6,461 3,366 1,236 13,037 9,000 Others 6,360 5,886 6,482 7,782 7,632 6,049 Subtotal 85,274 86,577 90,555 82,119 115,185 101,849 United States 28,552 27,252 25,041 34,328 27,295 22,500 World Total 113,826 113,829 115,596 116,447 142,480 124,349 none TY Imports Afghanistan 1,000 500 1,400 2,300 3,800 2,000 Algeria 5,358 5,476 4,874 5,904 6,359 5,300 Bangladesh 2,058 2,034 1,731 1,555 2,882 2,600 Brazil 5,009 5,823 7,704 7,136 6,367 6,500 Egypt 8,150 7,771 7,300 7,700 9,900 8,800 EU-27 7,061 6,758 5,137 6,942 7,740 6,500 Indonesia 4,661 4,981 5,596 5,224 5,423 5,500 Iran 200 1,105 700 200 9,300 3,500 Iraq 3,010 4,996 2,912 3,424 3,868 3,800 Israel 1,549 1,663 1,458 1,186 2,060 2,100 Japan 5,744 5,469 5,747 5,701 5,156 5,300 Korea, South 3,591 3,884 3,439 3,092 3,371 3,700 Libya 1,488 1,722 994 1,567 1,677 1,650 Mexico 3,717 3,549 3,610 3,136 3,341 3,100 Morocco 2,272 2,418 1,801 4,191 3,759 1,800 Nigeria 3,014 3,678 3,265 2,677 3,550 3,500 Peru 1,449 1,644 1,367 1,452 1,385 1,500 Philippines 2,593 2,954 2,754 2,266 3,201 3,000 Saudi Arabia 50 77 91 48 1,400 1,600 South Africa 1,407 1,242 885 1,333 1,500 1,500 Sudan 1,522 1,659 1,323 1,060 1,712 1,500 Syria 200 231 200 200 1,700 1,800 Turkey 372 64 1,778 2,192 3,577 2,500 Venezuela 1,504 1,691 1,765 1,498 1,500 1,525 Yemen 1,860 2,187 2,420 1,861 2,786 2,300 Others 39,463 35,270 39,999 36,728 38,742 35,515 Subtotal 108,302 108,846 110,250 110,573 136,056 118,390 Unaccounted 3,578 2,684 1,952 2,862 2,964 2,709 United States 1,946 2,299 3,394 3,012 3,460 3,250 World Total 113,826 113,829 115,596 116,447 142,480 124,349 TY=Trade Year, see Endnotes. Foreign Agricultural Service/USDA Office of Global Analysis February 2010
  • 6. World Wheat Production, Consumption, and Stocks Local Marketing Years, Thousand Metric Tons 2004/05 2005/06 2006/07 2007/08 2008/09 2009/10 Feb none Production Argentina 16,100 14,600 16,100 18,000 9,000 9,000 Australia 21,905 25,173 10,822 13,569 20,939 22,500 Canada 24,796 25,748 25,265 20,054 28,611 26,500 China 91,952 97,445 108,466 109,298 112,464 114,500 Egypt 7,177 8,184 8,274 8,275 7,883 7,900 EU-27 146,886 132,356 124,870 120,133 151,080 138,218 India 72,150 68,640 69,350 75,810 78,570 80,580 Iran 14,568 14,308 14,500 15,000 10,000 12,000 Kazakhstan 9,950 11,200 13,450 16,450 12,550 17,000 Morocco 5,540 3,043 6,327 1,583 3,730 6,370 Pakistan 19,500 21,612 21,277 23,300 21,500 24,000 Russia 45,400 47,700 44,900 49,400 63,700 61,700 Turkey 18,500 18,500 17,500 15,500 16,800 17,800 Ukraine 17,500 18,700 14,000 13,900 25,900 20,900 Uzbekistan 5,250 5,800 5,850 6,200 6,000 6,200 Others 49,852 49,681 45,534 48,163 45,951 51,959 Subtotal 567,026 562,690 546,485 554,635 614,678 617,127 United States 58,698 57,243 49,217 55,821 68,016 60,314 World Total 625,724 619,933 595,702 610,456 682,694 677,441 none Total Consumption Algeria 7,550 7,750 7,850 8,050 8,450 8,750 Brazil 9,900 10,450 10,300 10,300 10,700 11,400 Canada 8,240 8,242 8,986 6,787 8,027 8,100 China 102,000 101,500 102,000 106,000 102,500 102,000 Egypt 14,200 14,800 15,450 15,950 16,550 17,050 EU-27 123,220 127,525 125,500 116,536 127,500 127,000 India 72,838 69,980 73,371 76,422 70,770 76,120 Iran 14,550 14,800 15,300 15,500 15,900 16,200 Kazakhstan 7,400 7,400 7,500 7,500 7,525 7,550 Morocco 6,600 6,800 7,150 7,450 7,550 7,650 Pakistan 19,600 20,900 21,900 22,400 22,800 23,300 Russia 37,400 38,400 36,400 37,700 38,900 41,200 Turkey 16,800 16,100 16,650 16,800 16,900 17,400 Ukraine 11,700 12,500 11,700 12,300 11,900 12,100 Uzbekistan 5,700 6,118 6,500 6,800 7,050 7,250 Others 116,044 122,532 121,066 118,116 126,063 129,128 Subtotal 575,664 591,379 584,643 588,367 605,459 613,430 United States 31,783 31,320 30,940 28,614 34,291 32,168 World Total 607,447 622,699 615,583 616,981 639,750 645,598 none Ending Stocks Canada 7,922 9,698 6,865 4,406 6,556 6,856 China 38,821 34,387 38,450 38,963 48,685 60,785 Egypt 2,861 4,006 4,120 4,120 5,343 4,983 EU-27 27,496 23,384 14,075 12,343 18,345 17,063 India 4,100 2,000 4,500 5,800 13,510 18,020 Iran 3,419 3,257 3,507 3,157 3,907 4,157 Russia 3,386 3,454 2,231 1,819 8,429 11,129 Others 47,537 51,744 41,432 42,138 41,371 46,173 Subtotal 135,542 131,930 115,180 112,746 146,146 169,166 United States 14,699 15,545 12,414 8,323 17,867 26,690 World Total 150,241 147,475 127,594 121,069 164,013 195,856 Foreign Agricultural Service/USDA Office of Global Analysis February 2010
  • 7. Regional Wheat Imports, Production, Consumption, and Stocks Thousand Metric Tons Feb 2004/05 2005/06 2006/07 2007/08 2008/09 2009/10 TY Imports none North America 5,915 6,135 7,325 6,535 7,188 6,750 Central America 1,510 1,506 1,582 1,460 1,482 1,550 South America 10,526 12,304 13,979 13,143 12,746 12,890 European Union 7,061 6,758 5,137 6,942 7,740 6,500 Other Europe 1,464 1,457 1,480 1,923 1,690 1,675 Former Soviet Union - 12 4,910 5,487 5,958 6,021 6,544 5,500 Middle East 10,209 13,447 12,143 11,726 28,296 20,800 North Africa 18,347 18,650 16,402 21,734 23,467 19,050 Sub-Saharan Africa 12,086 13,174 11,735 10,371 13,363 13,395 East Asia 18,357 12,852 11,886 11,278 11,322 11,950 South Asia 5,655 4,812 10,944 8,270 10,713 6,215 Southeast Asia 11,429 11,923 12,437 11,405 12,328 12,500 Others 2,779 2,640 2,636 2,777 2,637 2,865 Total 110,248 111,145 113,644 113,585 139,516 121,640 Production none North America 85,914 86,011 77,722 79,468 100,627 91,114 South America 25,336 22,572 21,022 24,835 18,523 17,928 European Union 146,886 132,356 124,870 120,133 151,080 138,218 Other Europe 5,435 4,196 4,313 4,405 4,693 4,465 Former Soviet Union - 12 85,581 91,123 84,927 92,541 115,585 113,670 Middle East 42,771 42,975 41,758 39,912 32,196 36,825 North Africa 17,166 15,178 18,576 13,948 14,588 19,395 Sub-Saharan Africa 4,796 5,219 5,724 5,547 6,449 6,057 East Asia 93,221 98,652 109,669 110,590 113,706 115,711 South Asia 96,326 96,034 95,881 105,075 103,870 111,100 Oceania 22,161 25,466 11,099 13,846 21,216 22,777 Others 131 151 141 156 161 181 Total 625,724 619,933 595,702 610,456 682,694 677,441 Domestic Consumption none North America 46,023 45,662 46,126 40,901 48,318 46,418 South America 23,094 24,151 23,901 23,951 24,254 25,175 European Union 123,220 127,525 125,500 116,536 127,500 127,000 Other Europe 6,018 5,917 5,495 5,600 5,544 5,830 Former Soviet Union - 12 72,231 75,041 72,627 75,002 76,570 79,500 Middle East 49,690 50,423 51,308 50,519 53,260 53,665 North Africa 32,538 33,847 34,205 36,042 37,352 38,325 Sub-Saharan Africa 16,390 17,782 16,752 15,870 18,873 19,143 East Asia 114,117 114,116 113,938 117,556 114,118 114,170 South Asia 100,951 100,310 105,160 109,487 104,405 111,280 Southeast Asia 10,900 11,515 11,693 10,990 12,111 12,340 Oceania 6,916 7,484 8,545 7,394 7,699 8,025 Others 3,437 3,344 3,313 3,377 3,372 3,495 Total 605,525 617,117 618,563 613,225 633,376 644,366 Ending Stocks none North America 22,997 25,555 19,693 13,111 24,740 33,913 South America 4,062 4,752 5,132 5,801 3,293 3,616 European Union 27,496 23,384 14,075 12,343 18,345 17,063 Other Europe 1,770 1,333 1,067 1,037 1,442 1,237 Former Soviet Union - 12 12,746 13,338 9,263 10,609 18,510 23,155 Middle East 12,600 13,520 12,041 10,648 12,221 13,919 North Africa 9,492 9,233 9,749 9,127 9,600 9,485 Sub-Saharan Africa 1,243 1,458 1,731 1,563 2,074 2,033 East Asia 41,220 36,606 40,838 41,781 51,519 63,395 South Asia 7,393 6,285 7,057 8,487 16,363 21,698 Southeast Asia 2,152 2,251 2,605 2,549 2,432 2,347 Oceania 6,848 9,544 4,159 3,841 3,301 3,818 Others 222 216 184 172 173 177 Total 150,241 147,475 127,594 121,069 164,013 195,856 NOTES: Regional definitions appear on last page of this circular. Imports are reported on a trade year basis. All other data are reported using local marketing years. Foreign Agricultural Service/USDA Office of Global Analysis February 2010
  • 8. RICE: WORLD MARKETS AND TRADE PRICES: $/MT Recent Price Spreads Becoming For most of this decade, the spread between Less Volatile U.S. #2/4 quotes and Thai 100B quotes was 250 positive and moved rather slowly. Likewise, 200 the difference between Thai 100B quotes and Vietnamese 5% quotes was mostly 150 positive and fairly small. This pattern 100 changed in 2008 when Thai quotes fell below U.S. quotes, and the gap between 50 Thai and Vietnamese quotes ballooned. At 0 the same time, prices at all origins were changing quickly and not always in the same -50 direction, creating volatility in the spread. -100 In the past few months, however, it seems that this volatility has diminished as quotes -150 have tended to move in the same direction. -200 In addition, the U.S.-Thai spread has been shrinking and is near zero. With the -250 completion of the Philippine tenders, there 0 1 2 3 4 5 6 7 8 9 0 b-0 eb-0 eb-0 eb-0 eb-0 eb-0 eb-0 eb-0 eb-0 eb-0 eb-1 Fe F F F F F F F F F F may be more stability in the Thai-Viet spread, as well. US-Thai Price Spread Thai-Viet Price Spread TRADE CHANGES Selected Exporters: • Burma is down 200,000 tons to 800,000 in 2010 due to depleted stocks after 2009 exports reached the highest level in over 40 years. • Egypt is up 150,000 tons to 600,000 in 2010 on the government announcement that additional export licenses will be granted due to sufficient domestic supplies. • Uruguay is raised 126,000 tons to a record 926,000 for 2009 and raised 108,000 tons to 742,000 for 2008 based on new trade data. Selected Importers: • South Africa is boosted 150,000 tons to 800,000 for 2009 on near-final trade data. • Venezuela is doubled to 300,000 tons for 2010 on weather-related crop shortages. Grain: World Markets and Trade, February 2010 8 Foreign Agricultural Service/USDA Office of Global Analysis February 2010
  • 9. World Rice Trade January/December Year, Thousand Metric Tons 2004/05 2005/06 2006/07 2007/08 2008/09 2009/10 Feb none TY Exports Argentina 348 487 436 408 600 550 Brazil 272 291 201 511 650 300 Burma 190 47 31 541 1,052 800 Cambodia 200 350 450 500 800 800 China 656 1,216 1,340 969 760 1,500 Egypt 1,095 958 1,209 750 500 600 EU-27 201 144 139 157 140 135 Guyana 182 250 210 210 250 220 India 4,687 4,537 6,301 3,383 2,000 2,000 Japan 200 200 200 200 200 200 Pakistan 3,032 3,579 2,696 3,000 3,000 3,800 Peru 5 10 20 17 90 90 Thailand 7,274 7,376 9,557 10,011 8,570 10,000 Uruguay 762 812 734 742 926 750 Vietnam 5,174 4,705 4,522 4,649 5,950 5,500 Others 815 876 809 430 441 450 Subtotal 25,093 25,838 28,855 26,478 25,929 27,695 United States 3,863 3,307 3,029 3,273 3,100 3,150 World Total 28,956 29,145 31,884 29,751 29,029 30,845 none TY Imports Bangladesh 785 531 1,570 1,658 150 500 Brazil 548 691 684 417 630 750 Canada 321 333 341 365 345 340 China 609 654 472 295 330 350 Cote d'Ivoire 850 750 980 800 800 860 Cuba 736 594 574 558 425 575 EU-27 1,089 1,221 1,342 1,520 1,350 1,350 Ghana 450 440 340 300 350 350 Guinea 221 200 240 150 150 330 Haiti 328 399 292 320 300 325 Hong Kong 347 309 348 399 395 400 Iran 1,200 1,500 1,500 1,500 1,700 1,700 Iraq 786 1,306 613 975 1,000 1,100 Japan 787 681 642 546 700 700 Malaysia 751 886 799 1,020 830 850 Mexico 553 586 609 578 610 600 Mozambique 350 330 410 300 350 350 Nigeria 1,777 1,600 1,550 1,600 1,900 1,600 Philippines 1,890 1,791 1,900 2,500 2,000 2,600 Saudi Arabia 1,357 958 961 1,360 1,370 1,400 Senegal 850 600 700 860 715 700 Singapore 375 350 393 320 300 350 South Africa 764 800 960 665 800 800 Vietnam 320 350 450 300 500 500 Yemen 250 250 338 325 325 325 Others 8,195 7,680 9,649 7,958 7,790 8,419 Subtotal 26,489 25,790 28,657 27,589 26,115 28,124 Unaccounted 2,048 2,722 2,532 1,511 2,214 1,986 United States 419 633 695 651 700 735 World Total 28,956 29,145 31,884 29,751 29,029 30,845 TY=Trade Year, see Endnotes. Note about dates: 2009/10 is calendar year 2010, 2008/09 is calendar year 2009, and so on. Foreign Agricultural Service/USDA Office of Global Analysis February 2010
  • 10. World Rice Production, Consumption, and Stocks Local Marketing Years, Thousand Metric Tons 2004/05 2005/06 2006/07 2007/08 2008/09 2009/10 Feb none Milled Production Bangladesh 25,600 28,758 29,000 28,800 31,000 30,000 Brazil 8,996 7,874 7,695 8,199 8,569 7,820 Burma 9,570 10,440 10,600 10,730 10,150 10,730 Cambodia 2,627 3,771 3,946 4,238 4,520 4,630 China 125,363 126,414 127,200 130,224 134,330 137,000 Egypt 4,128 4,135 4,383 4,385 4,387 4,374 India 83,130 91,790 93,350 96,690 99,150 84,500 Indonesia 34,830 34,959 35,300 37,000 38,300 38,800 Japan 7,944 8,257 7,786 7,930 8,029 7,620 Korea, South 5,000 4,768 4,680 4,408 4,843 4,910 Nigeria 2,300 2,700 2,900 3,000 3,200 3,400 Pakistan 5,025 5,547 5,450 5,700 6,700 6,200 Philippines 9,425 9,821 9,775 10,479 10,753 10,200 Thailand 17,360 18,200 18,250 19,800 19,850 20,400 Vietnam 22,716 22,772 22,922 24,375 24,388 24,300 Others 30,347 31,257 31,275 32,083 32,625 34,364 Subtotal 394,361 411,463 414,512 428,041 440,794 429,248 United States 7,462 7,105 6,267 6,344 6,515 7,030 World Total 401,823 418,568 420,779 434,385 447,309 436,278 none Consumption and Residual Bangladesh 26,900 29,000 29,764 30,747 31,000 31,100 Brazil 9,074 8,460 7,925 8,254 8,529 8,600 Burma 10,300 10,400 10,670 10,249 9,550 9,850 Cambodia 2,777 3,571 3,646 3,788 3,770 3,880 China 130,300 128,000 127,200 127,450 129,000 133,500 Egypt 3,250 3,320 3,276 3,340 4,000 4,000 India 80,861 85,088 86,700 90,466 93,150 86,700 Indonesia 35,850 35,739 35,900 36,350 37,090 37,600 Iran 2,986 3,274 3,550 3,575 3,550 3,600 Japan 8,300 8,250 8,250 8,177 8,370 8,200 Korea, South 4,951 4,766 4,887 4,670 4,972 4,978 Nigeria 4,250 4,300 4,400 4,500 5,100 5,100 Philippines 10,400 10,722 12,000 13,499 13,650 13,785 Thailand 9,480 9,544 9,780 9,600 9,500 9,600 Vietnam 17,595 18,392 18,775 19,400 19,000 19,150 Others 46,043 46,032 47,545 48,327 49,375 50,727 Subtotal 405,558 412,140 417,567 424,432 430,840 432,954 United States 3,934 3,828 4,102 4,078 4,100 4,171 World Total 409,492 415,968 421,669 428,510 434,940 437,125 none Ending Stocks China 38,931 36,783 35,915 38,015 42,915 45,265 India 8,500 10,520 11,430 13,000 17,000 13,000 Indonesia 3,448 3,207 4,607 5,607 7,057 8,487 Japan 1,919 2,395 2,406 2,556 2,715 2,635 Philippines 4,572 5,293 4,868 4,418 4,121 3,136 Thailand 2,312 3,594 2,510 2,707 4,787 5,887 Vietnam 1,292 1,317 1,392 2,018 1,956 2,106 Others 11,205 11,510 10,706 11,712 11,819 10,710 Subtotal 72,179 74,619 73,834 80,033 92,370 91,226 United States 1,211 1,371 1,266 942 974 1,271 World Total 73,390 75,990 75,100 80,975 93,344 92,497 Note: All data are reported on a milled basis. Foreign Agricultural Service/USDA Office of Global Analysis February 2010
  • 11. Regional Rice Imports, Production, Consumption, and Stocks Thousand Metric Tons Feb 2004/05 2005/06 2006/07 2007/08 2008/09 2009/10 TY Imports none North America 1,293 1,552 1,645 1,594 1,655 1,675 Caribbean 1,213 1,111 965 1,028 820 1,005 South America 964 1,095 1,080 1,119 1,188 1,355 Other Europe 114 138 137 98 125 120 Former Soviet Union - 12 526 504 361 335 355 325 Middle East 4,879 5,204 4,778 5,728 5,785 5,910 North Africa 261 233 355 280 160 145 Sub-Saharan Africa 8,225 7,512 7,804 7,284 7,897 8,045 East Asia 2,119 2,017 2,318 1,646 1,825 1,926 South Asia 1,202 925 1,962 2,063 490 1,110 Southeast Asia 4,236 4,122 5,742 4,637 4,300 4,935 Others 1,876 2,010 2,205 2,428 2,215 2,308 Total 26,908 26,423 29,352 28,240 26,815 28,859 Production none North America 7,657 7,286 6,445 6,522 6,690 7,220 Caribbean 760 685 798 796 882 932 South America 16,217 14,557 14,292 15,649 16,014 15,072 European Union 1,880 1,731 1,676 1,757 1,680 1,988 Former Soviet Union - 12 770 871 1,000 1,005 915 1,095 Middle East 2,145 2,372 2,538 2,738 2,085 2,496 North Africa 4,148 4,170 4,413 4,406 4,408 4,409 Sub-Saharan Africa 7,892 8,804 9,376 9,557 10,468 11,016 East Asia 141,118 142,492 142,661 145,044 150,104 152,250 South Asia 119,009 131,367 133,111 136,535 142,095 126,598 Southeast Asia 99,462 102,944 103,778 109,823 111,292 112,536 Others 765 1,289 691 553 676 666 Total 401,823 418,568 420,779 434,385 447,309 436,278 Domestic Consumption none North America 5,005 4,936 5,231 5,143 5,225 5,291 Central America 1,079 1,064 1,102 1,116 1,108 1,073 Caribbean 1,990 1,732 1,829 1,863 1,737 1,930 South America 14,930 14,002 13,418 14,053 14,697 14,699 European Union 2,636 2,651 2,911 3,185 2,970 3,108 Former Soviet Union - 12 1,332 1,346 1,342 1,283 1,241 1,330 Middle East 6,756 7,629 7,586 7,809 7,976 8,235 North Africa 3,531 3,575 3,546 3,636 4,146 4,170 Sub-Saharan Africa 16,100 16,581 17,050 17,503 17,943 18,920 East Asia 147,014 144,371 144,289 143,315 145,800 149,920 South Asia 115,884 121,673 124,366 129,650 133,215 126,645 Southeast Asia 90,387 92,459 94,986 97,250 97,048 98,596 Others 607 667 714 664 600 624 Total 407,251 412,686 418,370 426,470 433,706 434,541 Ending Stocks none North America 1,385 1,530 1,409 1,135 1,140 1,442 Central America 297 271 299 255 207 213 Caribbean 159 225 178 134 109 106 South America 2,472 2,199 2,230 2,488 2,518 2,078 European Union 1,138 1,181 1,138 1,126 1,020 1,115 Middle East 1,728 2,079 1,697 1,977 1,826 1,902 North Africa 502 366 370 685 792 576 Sub-Saharan Africa 1,494 1,330 1,021 1,341 1,000 1,001 East Asia 41,916 40,329 39,317 41,537 46,657 49,157 South Asia 9,038 11,317 12,636 14,306 19,193 14,286 Southeast Asia 12,648 14,469 14,426 15,780 18,732 20,465 Oceania 431 515 230 52 26 22 Others 182 179 149 159 124 134 Total 73,390 75,990 75,100 80,975 93,344 92,497 NOTES: Regional definitions appear on last page of this circular. Imports are reported on a trade year basis. All other data are reported using local marketing years. Foreign Agricultural Service/USDA Office of Global Analysis February 2010
  • 12. COARSE GRAINS: WORLD MARKETS AND TRADE PRICES: Throughout January, U.S. corn export Corn Weekly Export Bids quotes continued a nearly $30 per ton slide 200 to about $165 following USDA data 190 indicating a record crop. Argentine and Brazilian quotes largely moved with U.S., 180 $/MT but the normal pre-harvest discount ($20) has narrowed because of strong sales and 170 shipments. 160 150 22 n 29 n n eb 20 v ov ov 18 c 25 c ec ct ov ec an an o e e -Ja -Ja -Ja -O -N -N -N -D -D -D 6-N 4-D 5-F 1-J 8-J 30 15 13 27 11 TRADE CHANGES IN 2009/10 U.S. Gulf A rgentina Up River B razil P aranagua Selected Exporters • U.S. corn is cut 2.0 million tons to 50.0 million based on the pace of shipments, despite some improved sales in recent weeks. • Argentine corn is raised 2.0 million tons to 9.5 million because of strong shipments in recent months and improved prospects for new crop corn. • EU barley is lowered 500,000 tons to 1.5 million, the lowest in 6 years, on the continued slow pace of export licenses and large early-season intervention offers. • Turkey barley is raised 450,000 tons to 500,000 on large feed-barley export tenders by the Turkish Grain Board. • U.S. sorghum is boosted 200,000 tons to 3.8 million with commitments running well ahead of last year. (Japanese and Mexican sorghum imports are each boosted 100,000 tons.) Selected Importers • Vietnamese corn is boosted 200,000 tons to 900,000 based on strong trade with Thailand. • Iran barley is lowered 200,000 tons based on a slow early-season import pace. Grain: World Markets and Trade, February 2010 Foreign Agricultural Service/USDA 12 Office of Global Analysis February 2010
  • 13. World Coarse Grain Trade October/September Year, Thousand Metric Tons 2004/05 2005/06 2006/07 2007/08 2008/09 2009/10 Feb none TY Exports Argentina 14,371 11,243 17,191 17,786 10,241 11,405 Australia 4,996 5,614 1,993 3,895 4,874 5,060 Brazil 1,457 2,826 8,188 8,032 7,183 9,100 Canada 3,217 4,010 3,787 6,379 3,848 3,625 EU-27 5,952 3,652 5,463 4,679 4,338 3,280 India 505 501 721 5,539 2,400 1,025 Russia 1,534 1,452 1,836 1,419 4,943 2,450 Serbia nr nr 863 132 1,478 2,005 South Africa 1,553 1,429 462 1,145 2,159 2,540 Ukraine 6,465 7,439 3,942 5,909 11,380 11,015 Others 10,457 8,888 10,976 5,574 5,349 5,270 Subtotal 50,507 47,054 55,422 60,489 58,193 56,775 United States 50,692 61,443 59,157 68,289 51,718 53,950 World Total 101,199 108,497 114,579 128,778 109,911 110,725 none TY Imports Algeria 2,273 2,139 2,588 2,433 2,080 2,105 Brazil 745 1,107 1,472 1,258 1,494 950 Canada 2,339 2,029 2,285 3,187 1,900 2,070 Chile 1,189 1,678 1,766 1,969 1,261 1,625 China 2,073 2,306 1,156 1,157 1,651 1,635 Colombia 2,516 3,380 3,714 3,603 3,652 3,775 Dominican Republic 1,031 1,068 1,212 1,074 900 1,000 Egypt 5,405 4,418 4,845 4,174 5,066 4,225 EU-27 2,906 2,883 8,738 19,892 2,996 2,830 Iran 3,858 3,000 3,600 3,900 5,000 3,700 Israel 1,700 1,588 1,684 1,776 1,461 1,425 Japan 19,709 19,765 19,668 19,210 19,611 19,460 Jordan 938 1,234 1,186 889 825 850 Kenya 269 115 6 210 1,304 1,060 Korea, South 8,710 8,545 8,797 9,358 7,254 7,570 Malaysia 2,406 2,517 2,363 3,181 2,400 2,600 Mexico 8,977 9,928 11,040 11,011 10,467 12,450 Morocco 1,989 1,975 2,150 2,185 1,784 1,735 Peru 1,366 1,548 1,646 1,592 1,399 1,620 Saudi Arabia 7,724 8,575 7,578 9,968 9,185 9,305 Syria 2,281 2,006 2,079 2,511 2,850 2,900 Taiwan 4,757 4,743 4,403 4,684 4,672 4,725 Tunisia 1,228 1,230 1,519 1,183 900 1,100 Venezuela 107 152 534 1,103 1,341 1,300 Vietnam 291 475 650 700 1,100 900 Others 11,444 14,193 13,899 14,367 12,243 12,060 Subtotal 98,231 102,597 110,578 126,575 104,796 104,975 Unaccounted 726 3,605 1,396 -1,407 2,308 3,125 United States 2,242 2,295 2,605 3,610 2,807 2,625 World Total 101,199 108,497 114,579 128,778 109,911 110,725 TY=Trade Year, see Endnotes. Foreign Agricultural Service/USDA Office of Global Analysis February 2010
  • 14. World Coarse Grains Production, Consumption, and Stocks Local Marketing Years, Thousand Metric Tons 2004/05 2005/06 2006/07 2007/08 2008/09 2009/10 Feb none Production Argentina 24,899 19,351 27,034 26,974 16,223 22,673 Australia 11,409 13,527 6,583 12,895 11,970 11,817 Brazil 37,874 44,167 53,184 61,344 53,624 53,614 Canada 25,602 24,939 23,145 27,841 27,167 22,373 China 138,252 147,696 159,098 159,105 172,700 162,000 Ethiopia 5,763 7,179 7,928 8,302 9,236 8,825 EU-27 166,579 146,267 137,421 136,123 161,579 152,580 India 33,560 34,040 33,810 40,630 39,170 33,600 Indonesia 7,200 6,800 7,850 8,500 8,700 9,000 Mexico 28,975 25,887 29,181 30,577 31,485 29,329 Nigeria 23,200 24,700 26,000 24,000 26,600 27,500 Russia 29,600 27,600 30,200 29,325 40,700 31,800 South Africa 12,209 7,311 7,760 13,690 13,084 12,003 Turkey 11,055 11,955 10,896 9,480 10,315 10,395 Ukraine 23,000 18,140 19,175 14,585 26,220 24,120 Others 116,221 120,485 126,891 124,632 126,938 133,597 Subtotal 695,398 680,044 706,156 728,003 775,711 745,226 United States 319,378 298,710 279,998 349,861 325,867 350,258 World Total 1,014,776 978,754 986,154 1,077,864 1,101,578 1,095,484 none Domestic Consumption Argentina 9,055 9,471 9,519 9,897 6,673 10,073 Brazil 41,558 42,197 43,304 45,279 47,504 48,279 Canada 22,944 22,859 24,505 24,021 22,850 22,173 China 141,072 147,105 153,465 157,015 160,425 167,575 Egypt 12,364 11,163 11,800 11,477 11,863 11,980 EU-27 152,573 147,538 147,877 154,155 152,105 153,205 India 33,240 33,800 32,520 35,500 36,400 32,850 Japan 19,881 20,089 19,823 19,460 19,710 19,605 Mexico 38,335 37,600 39,970 40,310 42,135 42,550 Nigeria 22,950 24,450 25,750 24,000 26,450 27,550 Russia 29,400 27,700 28,600 28,875 32,650 31,450 Saudi Arabia 7,160 8,235 8,760 9,680 9,580 10,080 South Africa 10,283 8,768 9,153 10,158 10,573 10,803 Turkey 11,536 11,462 11,602 10,609 10,575 10,310 Ukraine 15,175 12,415 13,150 11,835 13,720 13,590 Others 168,703 181,547 184,822 188,797 191,614 194,417 Subtotal 737,569 747,731 769,337 781,499 796,776 808,842 United States 240,177 245,022 242,798 274,533 275,748 296,675 World Total 977,746 992,753 1,012,135 1,056,032 1,072,524 1,105,517 none Ending Stocks Australia 2,153 2,804 1,205 2,666 3,330 3,400 Brazil 4,380 3,187 3,772 12,865 13,582 10,567 Canada 6,356 6,347 3,501 4,010 6,355 5,000 China 37,564 36,705 38,032 40,426 54,131 49,621 EU-27 25,128 22,275 15,138 12,768 20,102 18,977 Mexico 5,400 3,376 3,426 4,565 4,222 3,401 South Africa 3,435 2,443 1,776 3,251 3,382 3,172 Others 35,439 32,752 35,651 34,897 37,397 36,706 Subtotal 119,855 109,889 102,501 115,448 142,501 130,844 United States 58,800 54,767 36,174 45,059 47,060 48,684 World Total 178,655 164,656 138,675 160,507 189,561 179,528 Foreign Agricultural Service/USDA Office of Global Analysis February 2010
  • 15. Regional Coarse Grains Imports, Production, Consumption, and Stocks Thousand Metric Tons Feb 2004/05 2005/06 2006/07 2007/08 2008/09 2009/10 TY Imports none North America 13,558 14,252 15,930 17,808 15,174 17,145 Central America 2,405 2,803 2,906 2,681 2,440 2,825 Caribbean 1,913 1,969 2,227 2,239 2,000 2,150 South America 6,462 8,791 10,181 10,672 10,149 10,150 European Union 2,906 2,883 8,738 19,892 2,996 2,830 Former Soviet Union - 12 1,129 1,052 949 1,027 564 545 Middle East 17,940 17,835 18,674 21,819 21,261 19,880 North Africa 11,603 10,481 11,671 10,755 10,730 10,015 Sub-Saharan Africa 2,738 3,540 2,387 2,679 3,244 2,845 East Asia 35,661 35,613 34,135 34,662 33,438 33,640 Southeast Asia 3,499 4,897 4,394 4,746 4,739 4,550 Others 659 776 991 1,205 868 1,025 Total 100,473 104,892 113,183 130,185 107,603 107,600 Production none North America 373,955 349,536 332,324 408,279 384,519 401,960 South America 73,026 73,858 92,137 100,084 81,449 88,329 European Union 166,579 146,267 137,421 136,123 161,579 152,580 Other Europe 12,781 12,659 11,568 9,370 12,292 11,718 Former Soviet Union - 12 63,030 55,307 58,701 53,912 78,140 67,440 Middle East 18,876 19,998 19,060 17,381 15,933 16,977 North Africa 11,786 9,371 11,211 9,894 9,871 13,932 Sub-Saharan Africa 77,479 81,425 87,260 90,587 94,703 95,036 East Asia 140,518 149,899 161,399 161,295 174,874 164,141 South Asia 39,291 40,395 40,020 46,925 45,128 39,908 Southeast Asia 21,583 22,000 23,838 26,062 26,153 26,840 Oceania 12,034 14,174 7,230 13,542 12,617 12,464 Others 3,838 3,865 3,985 4,410 4,320 4,159 Total 1,014,776 978,754 986,154 1,077,864 1,101,578 1,095,484 Domestic Consumption none North America 301,456 305,481 307,273 338,864 340,733 361,398 South America 65,791 68,213 70,951 74,697 73,222 78,324 European Union 152,573 147,538 147,877 154,155 152,105 153,205 Other Europe 12,174 12,044 11,533 10,456 10,604 10,775 Former Soviet Union - 12 54,628 50,113 51,260 50,444 57,441 55,795 Middle East 35,041 37,188 37,607 37,827 37,890 37,516 North Africa 21,816 20,820 22,029 21,161 20,748 22,710 Sub-Saharan Africa 77,459 84,638 88,391 88,359 94,560 95,497 East Asia 177,081 182,819 188,963 191,868 194,920 201,809 South Asia 38,890 40,067 38,801 42,052 42,416 39,233 Southeast Asia 23,814 26,093 26,834 28,740 29,598 30,315 Oceania 7,478 7,940 6,885 7,666 7,347 7,437 Others 8,205 8,467 9,014 9,312 8,991 9,151 Total 976,406 991,421 1,007,418 1,055,601 1,070,575 1,103,165 Ending Stocks none North America 70,556 64,490 43,101 53,634 57,637 57,085 South America 9,670 7,676 9,060 18,476 16,789 15,027 European Union 25,128 22,275 15,138 12,768 20,102 18,977 Other Europe 1,607 1,491 1,520 1,291 1,821 1,589 Former Soviet Union - 12 7,393 5,105 5,093 4,301 8,506 6,555 Middle East 7,442 7,951 8,167 7,498 7,882 6,973 North Africa 3,640 2,675 3,166 2,419 2,528 3,765 Sub-Saharan Africa 5,180 5,120 5,240 6,536 6,886 7,125 East Asia 41,705 40,586 41,793 44,954 58,125 53,527 South Asia 1,543 1,401 1,455 1,580 1,795 1,535 Southeast Asia 1,743 2,100 2,644 3,282 3,302 3,142 Oceania 2,234 2,883 1,293 2,729 3,390 3,457 Others 814 903 1,005 1,039 798 771 Total 178,655 164,656 138,675 160,507 189,561 179,528 NOTES: Regional definitions appear on last page of this circular. Imports are reported on a trade year basis. All other data are reported using local marketing years. Foreign Agricultural Service/USDA Office of Global Analysis February 2010