
Recomendados
Recomendados
Más contenido relacionado
Destacado
Destacado (14)
Similar a Communications & Brainstorming Slides
Similar a Communications & Brainstorming Slides (20)
Último
Último (20)
Communications & Brainstorming Slides
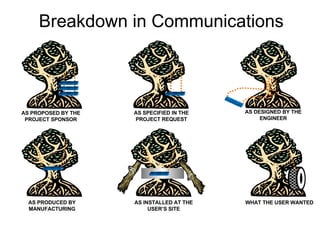
- 1. AS PROPOSED BY THE PROJECT SPONSOR AS SPECIFIED IN THE PROJECT REQUEST AS DESIGNED BY THE ENGINEER AS PRODUCED BY MANUFACTURING AS INSTALLED AT THE USER’S SITE WHAT THE USER WANTED Breakdown in Communications
- 2. Quality Management Tools TQM Process Step 1 - Establish TQM mgmt/cultural environment Step 2 - Define Mission of each component of org. Step 3 - Set performance improvement opportunities, goals, and priorities Step 4 -Establish improvement projects and action plans Step 5 - Implement projects using improvement methodologies Step 6 - Evaluate Step 7 - Review & Recycle Improved performance - reduced cycle time, lower cost, innovation Build or Upgrade Weak Strong Upgrade Existing Plant Build New Plant Strong Weak -120 -50 Product Demand Product Demand 65% 200 35% 90 65% 120 35% 60 80 -30 70 10 (Probability and Payoff Cost) (Probability and Payoff) (Cost of the Decision) (Decision Name) Net Path Value Chance Node Decision Node Decision Definition Time Environment Personnel Measurement Energy Material Method Machine Defect
- 3. Team Consensus Exercise The following list consists of 9 potential causes of accidental death. Your task is to rank order list from highest to lowest probability for an average American over the next 50 years (1 = highest probability of death, 9 = lowest probability). After you have ranked these 9 causes, meet with your teammates to develop a consensus ranking. Asteroid Impact Airplane Crash Firearms Accident Tornados Botulism Auto Accident Homicide Fireworks Electrocution Step 5 Difference Between Step 3 & 4 Step 4 Difference Between Step 1 & 2 Step 3 The Statistical Ranking Step 2 The Team’s Ranking Step 1 Your Individual Ranking CAUSES
- 4. Team Consensus Exercise (Solution) Statistical Ranking The following list consists of 9 potential causes of accidental death. Your task is to rank order list from highest to lowest probability for an average American over the next 50 years (1 = highest probability of death, 9 = lowest probability). After you have ranked these 9 causes, meet with your teammates to develop a consensus ranking. 5 (1/6,000) Asteroid Impact 6 (1/20,000) Airplane Crash 3 (1/2,000) Firearms Accident 7 (1/50,000) Tornados 9 (1/2 million) Botulism 1 (1/100) Auto Accident 2 (1/300) Homicide 8 (1/1 million) Fireworks 4 (1/5000) Electrocution Step 5 Difference Between Step 3 & 4 Step 4 Difference Between Step 1 & 2 Step 3 The Statistical Ranking Step 2 The Team’s Ranking Step 1 Your Individual Ranking CAUSES
- 5. Lamp Not Turning On Power Outage Blown Circuit Defective Chord Unplugged Chord Blown Light Bulb Unscrewed Light Bulb Defective Lamp Switch Lamp Plugged Into Turned Off Light Switch Description of Problem: After we returned from vacation, the lamp would not turn on. The following “Fishbone Diagram” depicts a cause & effect analysis where all of the bones represent potential causes. Next Step: Organize causes into groupings and have sub-branches off the bones such as: Power Related, Chord Related, Lamp Related, Bulb related are main branches and ideas above are sub-branches to one of these main branches. Actual Cause: Kitty chewed through chord – or “defective chord”.