September 2017, UK charity giving infographic
•
0 recomendaciones•106 vistas

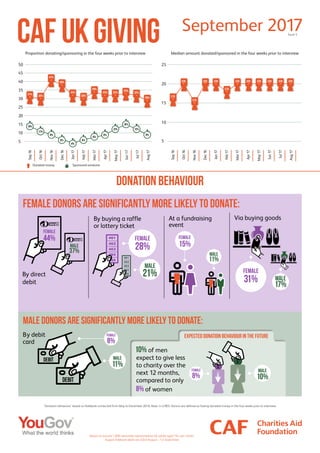
How people give to charity in the UK Our latest infographic provides some interesting insights into donor behaviours – particularly the preferences of men and women when it comes to supporting charities.
Denunciar
Compartir
Denunciar
Compartir
Descargar para leer sin conexión
Recomendados
Recomendados
(NEHA) Call Girls Katra Call Now: 8617697112 Katra Escorts Booking Contact Details WhatsApp Chat: +91-8617697112 Katra Escort Service includes providing maximum physical satisfaction to their clients as well as engaging conversation that keeps your time enjoyable and entertaining. Plus, they look fabulously elegant, making an impression. Independent Escorts Katra understands the value of confidentiality and discretion; they will go the extra mile to meet your needs. Simply contact them via text messaging or through their online profiles; they'd be more than delighted to accommodate any request or arrange a romantic date or fun-filled night together. We provide: (NEHA) Call Girls Katra Call Now 8617697112 Katra Escorts 24x7
(NEHA) Call Girls Katra Call Now 8617697112 Katra Escorts 24x7Call Girls in Nagpur High Profile Call Girls
Más contenido relacionado
Más de Dmytro Lysiuk
Más de Dmytro Lysiuk (20)
A comparative phylogenetic study of genetics and folk music
A comparative phylogenetic study of genetics and folk music
ЧИМ ЖИВУТЬ УКРАЇНСЬКІ НДО. 2018. Звіт за результатами комплексного дослідженн...
ЧИМ ЖИВУТЬ УКРАЇНСЬКІ НДО. 2018. Звіт за результатами комплексного дослідженн...
Происхождение артиллерийских ударов по позициям украинских военных в восточ...
Происхождение артиллерийских ударов по позициям украинских военных в восточ...
Ukrainian Municipal Survey, 20 January – 8 February, 2016
Ukrainian Municipal Survey, 20 January – 8 February, 2016
GLOBAL MARKET RESEARCH 2014. An ESOMAR Industry Report
GLOBAL MARKET RESEARCH 2014. An ESOMAR Industry Report
Internet trends 2015.05.27 | KPCB Internet trends 2015
Internet trends 2015.05.27 | KPCB Internet trends 2015
Último
(NEHA) Call Girls Katra Call Now: 8617697112 Katra Escorts Booking Contact Details WhatsApp Chat: +91-8617697112 Katra Escort Service includes providing maximum physical satisfaction to their clients as well as engaging conversation that keeps your time enjoyable and entertaining. Plus, they look fabulously elegant, making an impression. Independent Escorts Katra understands the value of confidentiality and discretion; they will go the extra mile to meet your needs. Simply contact them via text messaging or through their online profiles; they'd be more than delighted to accommodate any request or arrange a romantic date or fun-filled night together. We provide: (NEHA) Call Girls Katra Call Now 8617697112 Katra Escorts 24x7
(NEHA) Call Girls Katra Call Now 8617697112 Katra Escorts 24x7Call Girls in Nagpur High Profile Call Girls
Ashok Vihar Call Girls in Delhi (–9953330565) Escort Service In Delhi NCR PROVIDE 100% REAL GIRLS ALL ARE GIRLS LOOKING MODELS AND RAM MODELS ALL GIRLS” INDIAN , RUSSIAN ,KASMARI ,PUNJABI HOT GIRLS AND MATURED HOUSE WIFE BOOKING ONLY DECENT GUYS AND GENTLEMAN NO FAKE PERSON FREE HOME SERVICE IN CALL FULL AC ROOM SERVICE IN SOUTH DELHI Ultimate Destination for finding a High Profile Independent Escorts in Delhi.Gurgaon.Noida..!.Like You Feel 100% Real Girl Friend Experience. We are High Class Delhi Escort Agency offering quality services with discretion. We only offer services to gentlemen people. We have lots of girls working with us like students, Russian, models, house wife, and much More We Provide Short Time and Full Night Service Call ☎☎+91–9953330565 ❤꧂ • In Call and Out Call Service in Delhi NCR • 3* 5* 7* Hotels Service in Delhi NCR • 24 Hours Available in Delhi NCR • Indian, Russian, Punjabi, Kashmiri Escorts • Real Models, College Girls, House Wife, Also Available • Short Time and Full Time Service Available • Hygienic Full AC Neat and Clean Rooms Avail. In Hotel 24 hours • Daily New Escorts Staff Available • Minimum to Maximum Range Available. Location;- Delhi, Gurgaon, NCR, Noida, and All Over in Delhi Hotel and Home Services HOTEL SERVICE AVAILABLE :-REDDISSON BLU,ITC WELCOM DWARKA,HOTEL-JW MERRIOTT,HOLIDAY INN MAHIPALPUR AIROCTY,CROWNE PLAZA OKHALA,EROSH NEHRU PLACE,SURYAA KALKAJI,CROWEN PLAZA ROHINI,SHERATON PAHARGANJ,THE AMBIENC,VIVANTA,SURAJKUND,ASHOKA CONTINENTAL , LEELA CHANKYAPURI,_ALL 3* 5* 7* STARTS HOTEL SERVICE BOOKING CALL Call WHATSAPP Call ☎+91–9953330565❤꧂ NIGHT SHORT TIME BOTH ARE AVAILABLE
Call Girls In Shalimar Bagh ( Delhi) 9953330565 Escorts Service
Call Girls In Shalimar Bagh ( Delhi) 9953330565 Escorts Service9953056974 Low Rate Call Girls In Saket, Delhi NCR
Último (20)
(NEHA) Call Girls Katra Call Now 8617697112 Katra Escorts 24x7
(NEHA) Call Girls Katra Call Now 8617697112 Katra Escorts 24x7
➥🔝 7737669865 🔝▻ Mathura Call-girls in Women Seeking Men 🔝Mathura🔝 Escorts...
➥🔝 7737669865 🔝▻ Mathura Call-girls in Women Seeking Men 🔝Mathura🔝 Escorts...
Just Call Vip call girls kakinada Escorts ☎️9352988975 Two shot with one girl...
Just Call Vip call girls kakinada Escorts ☎️9352988975 Two shot with one girl...
Just Call Vip call girls roorkee Escorts ☎️9352988975 Two shot with one girl ...
Just Call Vip call girls roorkee Escorts ☎️9352988975 Two shot with one girl ...
Just Call Vip call girls Bellary Escorts ☎️9352988975 Two shot with one girl ...
Just Call Vip call girls Bellary Escorts ☎️9352988975 Two shot with one girl ...
Call Girls In Shivaji Nagar ☎ 7737669865 🥵 Book Your One night Stand
Call Girls In Shivaji Nagar ☎ 7737669865 🥵 Book Your One night Stand
➥🔝 7737669865 🔝▻ malwa Call-girls in Women Seeking Men 🔝malwa🔝 Escorts Ser...
➥🔝 7737669865 🔝▻ malwa Call-girls in Women Seeking Men 🔝malwa🔝 Escorts Ser...
VIP Model Call Girls Hinjewadi ( Pune ) Call ON 8005736733 Starting From 5K t...
VIP Model Call Girls Hinjewadi ( Pune ) Call ON 8005736733 Starting From 5K t...
➥🔝 7737669865 🔝▻ Ongole Call-girls in Women Seeking Men 🔝Ongole🔝 Escorts S...
➥🔝 7737669865 🔝▻ Ongole Call-girls in Women Seeking Men 🔝Ongole🔝 Escorts S...
SAC 25 Final National, Regional & Local Angel Group Investing Insights 2024 0...
SAC 25 Final National, Regional & Local Angel Group Investing Insights 2024 0...
Call Girls In Shalimar Bagh ( Delhi) 9953330565 Escorts Service
Call Girls In Shalimar Bagh ( Delhi) 9953330565 Escorts Service
Detecting Credit Card Fraud: A Machine Learning Approach
Detecting Credit Card Fraud: A Machine Learning Approach
Call Girls Begur Just Call 👗 7737669865 👗 Top Class Call Girl Service Bangalore
Call Girls Begur Just Call 👗 7737669865 👗 Top Class Call Girl Service Bangalore
Call Girls Bannerghatta Road Just Call 👗 7737669865 👗 Top Class Call Girl Ser...
Call Girls Bannerghatta Road Just Call 👗 7737669865 👗 Top Class Call Girl Ser...
Just Call Vip call girls Palakkad Escorts ☎️9352988975 Two shot with one girl...
Just Call Vip call girls Palakkad Escorts ☎️9352988975 Two shot with one girl...
➥🔝 7737669865 🔝▻ Bangalore Call-girls in Women Seeking Men 🔝Bangalore🔝 Esc...
➥🔝 7737669865 🔝▻ Bangalore Call-girls in Women Seeking Men 🔝Bangalore🔝 Esc...
Chintamani Call Girls: 🍓 7737669865 🍓 High Profile Model Escorts | Bangalore ...
Chintamani Call Girls: 🍓 7737669865 🍓 High Profile Model Escorts | Bangalore ...
DATA SUMMIT 24 Building Real-Time Pipelines With FLaNK
DATA SUMMIT 24 Building Real-Time Pipelines With FLaNK
September 2017, UK charity giving infographic
- 1. Female donors are significantly more likely to donate: Male donors are significantly more likely to donate: Expected donation behaviour in the future DONATION BEHAVIOUR By direct debit At a fundraising event Via buying goods By debit card of men expect to give less to charity over the next 12 months, compared to only of women Male FEMale 8% Male 37% FEMale 44% 11% Male 11% 15% FEMale 31% FEMale Male 17% By buying a raffle or lottery ticket 28% FEMale Male 21% Male 10% FEMale 8% 10% 8% Sep16 Oct16 Nov16 Dec16 Jan17 Feb17 Mar17 Apr17 May17 Jun17 Jul17 Aug17 5 10 15 20 25 30 35 40 45 50 Donated money Sponsored someone Proportion donating/sponsoring in the four weeks prior to interview Median amount donated/sponsored in the four weeks prior to interview 11% 9% 6% 4% 8% 9% 31% ● 41% ● 38% ● 32% ● 34% ● Sep16 Oct16 Nov16 Dec16 Jan17 Feb17 Mar17 Apr17 May17 Jun17 Jul17 Aug17 5 10 15 20 25 £16 ● £20 ● £15 ● £20● £18 ● £20 ● £20 ● £20 ● 14% 6% 30% ● 30% ● 32% ● £20 ● 32% ● 12% 33% ● 15% £20 ● 32% ● 12% £20 ● 29% ● 9% £20 ● Based on around 1,000 nationally representative UK adults aged 16+ per month. August fieldwork dates are 22nd August – 1st September CAF UKGIVING September 2017Issue 5 ‘Donation behaviour’ based on fieldwork conducted from May to December 2016. Base: n=2,903. Donors are defined as having donated money in the four weeks prior to interview.