SlideShare una empresa de Scribd logo
1 de 12
Descargar para leer sin conexión
March 2023
SIPRI Fact Sheet
KEY FACTS
ș The volume of international
transfers of major arms in
2018–22 was 5.1 per cent lower
than in 2013–17 and 4.8 per cent
higher than in 2008–12.
ș Thefivelargestarms
exportersin2018–22werethe
UnitedStates,Russia,France,
ChinaandGermany.Together,
theysupplied76percentofthe
world’sarmsexportsin2018–22.
ș US arms exports accounted
for 40 per cent of the global total
in 2018–22 and were 14 per cent
higher than in 2013–17.
ș French arms exports
increased by 44 per cent
between 2013–17 and 2018–22,
while Russian (–31 per cent),
Chinese (–23 per cent) and
German (–35 per cent) arms
exports decreased.
ș The five largest arms
importers in 2018–22, India,
Saudi Arabia, Qatar, Australia
and China, together received
36 per cent of the world’s arms
imports.
ș The main recipient region in
2018–22 was Asia and Oceania
(accounting for 41 per cent of
global arms imports), followed
by the Middle East (31 per cent),
Europe (16 per cent), the
Americas (5.8 per cent) and
Africa (5.0 per cent).
ș Arms imports by European
states were 47 per cent higher in
2018–22 than in 2013–17. Those
by European NATO states were
65 per cent higher.
ș Ukraine became a major
importer of arms in 2018–22.
It was the 14th largest arms
importer globally in the period
and the 3rd largest in 2022.
TRENDS IN INTERNATIONAL
ARMS TRANSFERS, 2022
pieter d. wezeman, justine gadon and siemon t. wezeman
Imports of major arms by European states rose by 47 per cent between
2013–17 and 2018–22, while the global volume of international arms transfers
fell by 5.1 per cent (see figure 1).1 There were decreases in arms trans­
fers
to Africa (–40 per cent), the Americas (–21 per cent), Asia and Oceania
(–7.5 per cent) and the Middle East (–8.8 per cent) between the two periods.
The five largest arms importers in 2018–22 were India, Saudi Arabia, Qatar,
Australia and China. The five largest arms exporters were the United States,
Russia, France, China and Germany.
The war in Ukraine had only a limited impact on the total volume of arms
transfers in 2018–22, but Ukraine did become a major importer of arms in
2022. In addition, most European states substantially increased their arms
import orders and the war will have significant ramifi­
cations for future
supplier–recipient arms trade relations globally.
From 13 March 2023 the freely accessible SIPRI Arms Transfers Data­
base
includes updated data on transfers of major arms for 1950–2022, which
replaces all previous data on arms transfers published by SIPRI. Based on
the new data, this fact sheet presents global trends in arms exports and arms
imports, and highlights selected issues related to transfers of major arms.
1 In this fact sheet the terms ‘arms exports’ and ‘arms imports’ are used to refer to international
transfers of major arms, as defined by SIPRI.
Volume
of
arms
transfers
(billions
of
trend-indicator
values)
0
10
20
30
40
50
1983–87
1988–92
1993–97
1998–2002
2003–2007
2008–12
2013–17
2018–22
Figure 1. The trend in international transfers of major arms, 1983–2022
Note: The bar graph shows the average annual volume of arms transfers for 5-year periods
and the line graph shows the annual totals. The SIPRI trend-indicator value (TIV) is a
measure of the volume of inter­
national transfers of major arms. The method used for the
SIPRI TIV is described on the Arms Transfers Database web page.
Source: SIPRI Arms Transfers Database, Mar. 2023.
2 sipri fact sheet
THE EXPORTERS, 2018–22
SIPRI has identified 63 states as exporters of major arms in 2018–22. The five
largest exporters of arms during that period—the USA, Russia, France, China
and Germany—accounted for over three quarters (76 per cent) of all arms
exports (see figure 2 and table 1). US and French arms exports rose between
2013–17 and 2018–22, while Russian, Chinese and German arms exports fell
(see figure 3). The top 25 arms exporters accounted for 98 per cent of the
world’s arms exports in 2018–22 (see table 1). States in North America and
Europe together accounted for 87 per cent of all arms exports in the period.
The five largest exporters in Western Europe—France, Germany, Italy, the
United Kingdom and Spain—supplied around one quarter (24 per cent) of
total global arms exports in 2018–22 (see figure 2).
Table 1. The 25 largest exporters of major arms and their main recipients, 2018–22
Percentages below 10 are rounded to 1 decimal place; percentages over 10 are rounded to whole numbers.
Exporter
Share of global
arms exports (%)
Per cent
change from
2013–17 to
2018–22a
Main recipients and their share of exporter’s total exports (%),
2018–22
2018–22 2013–17 1st 2nd 3rd
1 United States 40 33 14 Saudi Arabia 19 Japan 8.6 Australia 8.4
2 Russia 16 22 –31 India 31 China 23 Egypt 9.3
3 France 11 7.1 44 India 30 Qatar 17 Egypt 8.0
4 China 5.2 6.3 –23 Pakistan 54 Bangladesh 12 Serbia 4.5
5 Germany 4.2 6.1 –35 Egypt 18 South Korea 17 Israel 9.5
6 Italy 3.8 2.5 45 Qatar 24 Egypt 23 Türkiye 12
7 United Kingdom 3.2 4.7 –35 USA 20 Qatar 16 Saudi Arabia 7.7
8 Spain 2.6 2.5 –4.4 Australia 35 Saudi Arabia 19 Belgium 12
9 South Korea 2.4 1.3 74 Philippines 16 India 13 Thailand 13
10 Israel 2.3 2.6 –15 India 37 Azerbaijan 9.1 Philippines 8.5
11 Netherlands 1.4 2.1 –39 USA 27 Mexico 11 Tunisia 7.4
12 Türkiye 1.1 0.6 69 Qatar 20 UAE 17 Oman 13
13 Sweden 0.8 0.9 –16 USA 25 Pakistan 24 Brazil 15
14 Switzerland 0.7 1.0 –34 Australia 21 Denmark 14 Spain 13
15 Australia 0.6 0.3 64 Canada 35 Chile 31 USA 13
16 Canada 0.5 0.6 –9.4 Saudi Arabia 49 UAE 22 USA 4.9
17 Ukraine 0.5 1.7 –70 China 48 Saudi Arabia 13 Thailand 7.5
18 UAE 0.4 0.4 –5.8 Egypt 28 Jordan 27 Algeria 15
19 Poland 0.4 0.1 168 Ukraine 95 Nepal 1.2 Ecuador 0.6
20 Belarus 0.3 0.5 –37 Serbia 33 Viet Nam 25 Uganda 14
21 South Africa 0.3 0.3 6.7 UAE 27 USA 21 India 15
22 Norway 0.3 0.6 –55 USA 27 Ukraine 15 Lithuania 14
23 Brazil 0.3 0.2 35 France 25 Nigeria 15 Chile 12
24 Belgium 0.2 0.1 212 Saudi Arabia 35 Canada 28 Pakistan 21
25 Jordan 0.2 0.2 14 USA 61 Egypt 26 Armenia 7.0
UAE = United Arab Emirates.
a Figures show the change in volume of the total arms exports per exporter between the two periods.
Source: SIPRI Arms Transfers Database, Mar. 2023.
trends in international arms transfers, 2022 3
Figure 2. Global share of exports of major arms by the 10 largest exporters,
2018–22
Source: SIPRI Arms Transfers Database, Mar. 2023.
Others
9.4%
Israel
2.3%
South Korea
2.4%
Spain
2.6%
United Kingdom
3.2%
Italy
3.8%
Germany
4.2%
China
5.2%
France
11%
United States
40%
Russia
16%
Figure 3. Changes in volume of exports of major arms since 2013–17 by the
10 largest exporters in 2018–22
Source: SIPRI Arms Transfers Database, Mar. 2023.
14
–31
44
–23
–35
45
–35
–4.4
74
–15
Change in volume of arms exports (%)
United States
Russia
France
China
Germany
Italy
United Kingdom
Spain
South Korea
Israel
–40 –30 –20 –10 0 10 20 30 40 50 60 70 80
The United States
The USA’s arms exports grew
by 14 per cent between 2013–17
and 2018–22 and its share of total
global arms exports rose from
33 per cent to 40 per cent. The
USA delivered major arms to
103 states in 2018–22, almost as
many as the next two biggest
exporters com­
bined. Its total
arms exports in 2018–22 were
148 per cent higher than those
of Russia—the second largest
exporter—compared with 50 per
cent higher in 2013–17.
A total of 41 per cent of US arms
exports went to the Middle East
in 2018–22, down from 49 per
cent in 2013–17. Partly related to
its policies aimed at con­
tain­
ing
Iranian influence, the USA exports
large volumes of advanced major
arms to states in the region. Four
Middle Eastern states were among
the top 10 importers of US arms in
2018–22: Saudi Arabia accounted
for 19 per cent of US arms exports,
Qatar for 6.7 per cent, Kuwait for
4.8 per cent and the United Arab
Emirates (UAE) for 4.4 per cent.
States in Asia and Oceania
received 32 per cent of total US
arms exports in 2018–22, roughly
the same proportion as in 2013–17
(33 per cent). Three major US
allies in the region were among
the 10 largest importers of US
arms in 2018–22: Japan accounted
for 8.6 per cent of total US arms
exports, Australia for 8.4 per
cent and South Korea for 6.5 per
cent. Taiwan was the 4th largest
importer of US arms in 2013–17,
but only the 19th largest in
2018–22. How­
ever, by the end of
2022, it had several large orders in
place for major arms from the USA, includ­ing for 66 combat aircraft.
A total of 23 per cent of US arms exports went to states in Europe in
2018–22, up from 11 per cent in 2013–17. Three of the USA’s North Atlantic
4 sipri fact sheet
Treaty Organization (NATO) partners in the region were among the 10 largest
importers of US arms in 2018–22: the UK accounted for 4.6 per cent of US
arms exports, the Netherlands for 4.4 per cent and Norway for 4.2 per cent.
ThevolumeofUSexportsofmajorarmstoUkraineincreasedsharplyin2022.
Nevertheless, as the supplies to Ukraine involved relatively less advanced
and mainly second-hand military equipment from US stocks, the level of US
exports to Ukraine in 2022 was still below the levels sent to four other states
that year—Kuwait, Saudi Arabia, Qatar and Japan—because they received
advanced new weapons, such as combat aircraft and air defence systems.
US arms exports to many NATO states rose between 2013–17 and 2018–22 as
they rearmed due to growing tensions with Russia. However, the USA’s arms
exports to its NATO ally Türkiye were at a low level in 2018–22 as a result of
increasinglystrainedbilateralrelations.Türkiyewasthe27thlargestrecipient
of US arms in 2018–22, down from 7th largest in 2013–17.
The USA has many pending arms export deliveries (see box 1). In 2022
alone 13 states ordered a total of 376 combat aircraft and combat helicopters
from the USA. The largest order that year came from Canada for 88 combat
aircraft.
Russia
In 2018–22 Russia delivered major arms to 47 states and accounted for
16 per cent of total global arms exports. Russian arms exports remained
stable between 2008–12 and 2013–17, but fell by 31 per cent between 2013–17
and 2018–22. The annual volumes of arms exports in 2018 and 2019 were at
similar levels to or higher than those in each of the previous 20 years, but
were at significantly lower levels in 2020, 2021 and 2022.
Box 1. Selected major arms on order or preselected for future orders from the 10 largest arms exporters, for delivery
after 2022
It is very difficult to make predictions about future trends in arms transfers. Nevertheless, data on orders and final negotiations of
orders can give a rough indication of which states will be among the largest exporters in coming years. The data on combat aircraft
and major warships, which have a notably high military value, is particularly telling. As the table below shows, the United States
will almost certainly continue to be by far the largest exporter of major arms beyond 2022, especially as around 60 per cent of all
combat aircraft currently on order will be supplied by the USA. Russia, which was the second largest arms exporter in the world in
2018–22, has a relatively low number of pending deliveries.
United
States Russia France China Germany Italy
United
Kingdom Spain
South
Korea Israel
Combat aircrafta 1 371 84 210 94 – 115 20 – 136 18
Major warshipsb 5 5 21 22 29 9 26 2 6 –
SAM systemsc 40 13 6 1 25 1 – – . . 26
Tanks 634 444 – 717 85 – 14 . . 990 19
Other armoured vehicles 2 658 55 552 – 1 389 1 703 2 608 23 69
Artillery 401 – 176 128 137 – 30 10 1 232 87
. . = data not available or not applicable; – nil or a negligible figure; SAM = surface-to-air missile.
a Combat aircraft here include combat helicopters, combat/trainer aircraft and anti-submarine warfare aircraft.
b Major warships here include aircraft carriers, corvettes, destroyers, frigates and submarines.
c SAM systems here include only land-based systems and exclude systems for portable/very short-range SAMs.
Source: SIPRI Arms Transfers Database, Mar. 2023.
trends in international arms transfers, 2022 5
StatesinAsiaandOceaniareceived65percentoftotalRussianarmsexports
in 2018–22, while Middle Eastern and African states received 17 per cent and
12 per cent respectively. Just under two thirds of Russian arms exports went
to three states in 2018–22: India (31 per cent), China (23 per cent) and Egypt
(9.3 per cent). India was also the largest recipi­ent of Russian arms in 2013–17,
but exports to India decreased by 37 per cent between the two periods. In
contrast, exports to China (+39 per cent) and Egypt (+44 per cent) increased
within the same time frame. However, Russia made no deliveries to Egypt
in 2021–22 and the volume of deliveries to China in 2020–22 was at a much
lower level than in 2018–19. It is likely that order volumes from these two
states will reduce in the coming years. Egypt, for example, cancelled a large
orderforcombataircraftin2022,probablyduetopressurefromtheUSA,and
China is becoming less reliant on Rus­
sian imports as it ramps up domestic
production of advanced major arms. Exports to the other 7 of the 10 largest
recipients of Russian arms in 2018–22 decreased, by 59 per cent on average.
The low volume of pending deliveries of major arms from Russia (see box 1)
indicates that its arms exports are likely to continue to drop in the coming
years. Combat aircraft and combat helicopters have been among Russia’s
main arms exports since 1992. It delivered a total of 328 of these in 2018–22,
which accounted for 40 per cent of Russian arms exports in the period.
However, by the end of 2022, it had pending deliveries for only 84 combat
air­
craft and combat helicopters. Russia’s invasion of Ukraine will probably
put additional constraints on Russia’s ability to export arms, as it is likely to
prioritize the production of arms for its own military over those for export.
The multilateral sanctions, including wide-ranging trade restrictions,
imposed on Russia, coupled with pressure from the USA and its allies on
states not to acquire Russian arms, will also hamper its efforts to export arms.
France
French arms exports accounted for 11 per cent of the global total in 2018–22
and were 44 per cent higher than in 2013–17. Most of France’s arms exports in
2018–22 went to states in Asia and Oceania (44 per cent) and the Middle East
(34 per cent). It delivered major arms to 62 states in 2018–22, but the three
largest recipients—India, Qatar and Egypt—together received 55 per cent of
French arms exports in that period. With a 30 per cent share of exports, India
was by far the largest recipient of French arms in 2018–22 (see below).
The most notable French arms export agreement signed in 2022 was with
Indonesia, for 42 combat aircraft. By the end of that year, France had far more
major arms on order for export than Russia (see box 1).
Other major exporters
China accounted for 5.2 per cent of total global arms exports in 2018–22. Its
arms exports decreased by 23 per cent between 2013–17 and 2018–22. The
vast majority of Chinese arms exports (80 per cent) went to states in Asia and
Oceania. China delivered major arms to 46 states in 2018–22, but over half of
its arms exports (54 per cent) went to just one state—Pakistan.
Arms exports by Germany made up 4.2 per cent of the global total in
2018–22. They were 35 per cent lower than in 2013–17. States in the Middle
6 sipri fact sheet
Table 2. The 40 largest importers of major arms and their main suppliers, 2018–22
Percentages below 10 are rounded to 1 decimal place; percentages over 10 are rounded to whole numbers.
Rank Importer
Share of global
arms imports (%)
Per cent
change from
2013–17 to
2018–22a
Main suppliers and their share of importer’s total imports (%),
2018–22
2018–22 2013–17 1st 2nd 3rd
1 India 11 12 –11 Russia 45 France 29 USA 11
2 Saudi Arabia 9.6 10 –8.7 USA 78 France 6.4 Spain 4.9
3 Qatar 6.4 1.5 311 USA 42 France 29 Italy 14
4 Australia 4.7 3.6 23 USA 73 Spain 19 Switzerland 3.0
5 China 4.6 4.2 4.1 Russia 83 France 8.1 Ukraine 5.6
6 Egypt 4.5 4.5 –5.3 Russia 34 Italy 19 France 19
7 South Korea 3.7 2.2 61 USA 71 Germany 19 France 7.9
8 Pakistan 3.7 3.0 14 China 77 Sweden 5.1 Russia 3.6
9 Japan 3.5 1.2 171 USA 97 UK 1.9 Sweden 0.3
10 United States 2.7 2.0 31 UK 24 Netherlands 13 France 11
11 UAE 2.7 4.1 –38 USA 66 Türkiye 7.4 Russia 5.4
12 Kuwait 2.4 0.9 146 USA 78 Italy 10 France 9.0
13 United Kingdom 2.3 1.7 31 USA 81 South Korea 13 Israel 2.8
14 Ukraine 2.0 <0.05 8 631 USA 34 Poland 17 Germany 11
15 Norway 2.0 0.5 285 USA 86 South Korea 8.2 Italy 3.5
16 Israel 1.9 1.8 2.9 USA 79 Germany 20 Italy 0.2
17 Netherlands 1.9 0.4 307 USA 95 Germany 3.9 Finland 0.6
18 Algeria 1.8 4.1 –58 Russia 73 Germany 10 France 5.2
19 Türkiye 1.3 2.4 –49 Italy 35 Spain 20 Russia 19
20 Singapore 1.3 1.4 –14 France 52 USA 26 UK 7.6
21 Thailand 1.0 0.9 –1.1 South Korea 33 China 14 USA 10
22 Brazil 0.9 0.6 48 France 39 UK 14 Sweden 13
23 Philippines 0.9 0.5 64 South Korea 42 Israel 22 USA 15
24 Indonesia 0.9 2.7 –69 South Korea 32 USA 26 France 12
25 Bangladesh 0.9 1.6 –48 China 74 UK 5.8 Türkiye 4.5
26 Poland 0.9 0.5 64 USA 56 South Korea 17 Germany 6.5
27 Viet Nam 0.8 2.8 –72 Russia 55 Israel 16 Belarus 10
28 Italy 0.8 1.3 –41 USA 92 Israel 4.4 France 2.0
29 Morocco 0.8 1.1 –30 USA 76 France 15 China 6.8
30 Myanmar 0.8 0.8 –3.0 Russia 42 China 29 India 14
31 NATOb 0.7 <0.05 2 700 France 66 USA 18 UK 15
32 Afghanistan 0.7 0.8 –11 USA 96 Brazil 2.6 Belarus 1.4
33 Canada 0.7 1.1 –36 USA 32 Australia 27 Spain 15
34 Greece 0.7 0.9 –26 France 48 USA 29 UK 12
35 Kazakhstan 0.6 0.8 –22 Russia 94 China 2.6 South Africa 1.8
36 Belarus 0.6 0.3 55 Russia 100 China 0.1 . . . .
37 Serbia 0.5 0.1 743 China 43 Russia 31 Belarus 20
38 Chile 0.5 0.3 56 UK 38 Australia 36 USA 10
39 Jordan 0.5 0.8 –39 USA 40 UAE 20 Russia 17
40 Bahrain 0.5 0.1 380 USA 83 UK 7.0 Italy 4.1
. . = data not available or not applicable; NATO = North Atlantic Treaty Organization; UAE = United Arab Emirates.
a Figures show the change in volume of the total arms imports per importer between the two periods.
b The data is for imports by the organization itself, not the total imports by NATO member states.
Source: SIPRI Arms Transfers Database, Mar. 2023.
trends in international arms transfers, 2022 7
East received the largest share
of total German arms exports in
2018–22 (36 per cent), followed by
states in Asia and Oceania (32 per
cent) and Europe (20 per cent).
Italy accounted for 3.8 per cent
of the world’s arms exports in
2018–22. Its arms exports were
45 per cent higher in 2018–22
than in 2013–17. Around two
thirds (67 per cent) of Italian arms
exports went to the Middle East.
The 4 other suppliers making
up the top 10 arms exporters in
2018–22 were the UK, Spain, South
Korea and Israel. Arms exports
by the UK (–35 per cent), Spain
(–4.4 per cent) and Israel (–15 per
cent) all decreased between
2013–17 and 2018–22. In contrast,
arms exports by South Korea
increased by 74 per cent, giving it
a 2.4 per cent share of the global
total. Most of its arms exports (63 per cent) went to states in Asia and Oceania
butinternationaldemandforSouthKoreanarmsisgrowing,asdemonstrated,
for example, by the large orders that Poland placed in 2022 (see below).
THE IMPORTERS, 2018–22
SIPRI has identified 167 states as importers of major arms in 2018–22. The
top five arms importers—India, Saudi Arabia, Qatar, Australia and China—
received 36 per cent of total global arms imports in the period (see figure 4
and table 2). States in Asia and Oceania accounted for 41 per cent of all arms
imports in 2018–22 (see figure 5), followed by the Middle East (31 per cent),
Europe (16 per cent), the Americas (5.8 per cent) and Africa (5.0 per cent).
Africa
Imports of major arms by African states fell by 40 per cent between 2013–17
and 2018–22, which was mainly due to decreases in the arms imports of the
two largest importers in the region, Algeria (–58 per cent) and Morocco
(–30 per cent). The main suppliers to Africa in 2018–22 were Russia, account­
ing for 40 per cent of African imports of major arms, the USA (16 per cent),
China (9.8 per cent) and France (7.6 per cent).
Sub-Saharan Africa
States in sub-Saharan Africa accounted for 2.0 per cent of total global imports
of major arms in 2018–22. Their combined arms imports were 23 per cent
lower than in 2013–17. The three largest arms importers in the sub­
region in
2018–22 were Angola, Nigeria and Mali.
Others
45%
United States
2.7%
Japan
3.5%
India
11%
Saudi Arabia
9.6%
Qatar
6.4%
Australia
4.7%
China
4.6%
Egypt
4.5%
South Korea
3.7%
Pakistan
3.7%
Figure 4. Global share of imports of major arms by the 10 largest importers,
2018–22
Source: SIPRI Arms Transfers Database, Mar. 2023.
8 sipri fact sheet
Several arms-exporting states
are competing for influence in
sub-Saharan Africa. Russia over­
took China to become the largest
sup­
plier to the subregion in
2018–22. Its share of arms imports
to sub-Saharan Africa rose from
21 per cent in 2013–17 to 26 per
cent in 2018–22, while China’s fell
from 29 per cent to 18 per cent.
France increased its share from
4.8 per cent to 8.3 per cent, making
it the third largest arms supplier to
sub-Saharan Africa in 2018–22.
Arms import volumes vary
signifi­
cantly over time for most
states in sub-Saharan Africa and
these states often have a diverse
range of suppliers. For example,
Mali’s imports increased by
210 per cent between 2013–17 and
2018–22. Russia was its main sup­
plier in both periods, but Mali also
received major arms from Brazil,
China, France, South Africa, Spain,
Türkiye, the UAE and the USA.
After the coups in Mali in 2020 and 2021, France and the USA became far
more reluctant to supply it with arms. Russia, in contrast, increased its arms
exports to Mali in 2021–22.
The Americas
Arms imports by states in the Americas decreased by 21 per cent between
2013–17 and 2018–22. The USA and Brazil were the largest importers of major
arms in the region in 2018–22, accounting for 47 per cent and 16 per cent of
the regional total respectively.
Arms imports by South American states decreased by 34 per cent between
2013–17 and 2018–22. Despite the fact that there are few interstate tensions
in South America, some states, including Brazil and Chile, have significant
ongoing arms import programmes. Brazil’s arms imports were 48 per cent
higher than in 2013–17 and accounted for 44 per cent of the subregional total
in 2018–22. Chile’s arms imports rose by 56 per cent between the two periods,
giving it a 24 per cent share of total South American arms imports.
Asia and Oceania
Arms imports by states in Asia and Oceania decreased by 7.5 per cent between
2013–17 and 2018–22. Six of the world’s 10 largest arms importers in 2018–22
were in Asia and Oceania: India, Australia, China, South Korea, Pakistan
and Japan. The USA (31 per cent) accounted for the largest share of arms
2018–22
2013–17
0 25 50 75 100 125 150
Asia and Oceania, 42% Middle East, 32%
Europe, 11% Americas,
7.0%
Asia and Oceania, 41% Middle East, 31%
Europe, 16% Americas, 5.8%
Africa, 5.0%
Africa, 8.0%
Volume of arms transfers
(billions of trend-indicator values)
Figure 5. The importers of major arms, by region, 2018–22 and 2013–17, per cent
of global share
Note: The SIPRI trend-indicator value (TIV) is a measure of the volume of international
transfers of major arms. The method used for the SIPRI TIV is described on the Arms
Transfers Database web page.
Source: SIPRI Arms Transfers Database, Mar. 2023.
trends in international arms transfers, 2022 9
imports to states in the region, followed by Russia (26 per cent) and France
(12 per cent).
India and Pakistan
India’s tensions with Pakistan and China largely drive its demand for arms
imports. With an 11 per cent share of total global arms imports, India was
the world’s biggest importer of major arms in 2018–22, a position it has held
for the period 1993–2022. It retained this position even though its arms
imports dropped by 11 per cent between 2013–17 and 2018–22. The decrease
can be attributed to several factors including India’s slow and complex
arms procurement process, efforts to diversify its arms suppliers, and
attempts to replace imports with major arms that are designed and produced
domestically.
Russia was the largest supplier of arms to India in both 2013–17 and
2018–22, but its share of total Indian arms imports fell from 64 per cent to
45 per cent. Russia’s position as India’s main arms supplier is under pressure
due to strong competition from other supplier states, increased Indian arms
production and, since 2022, the above-mentioned constraints on Russia’s
arms exports related to its invasion of Ukraine.
India’s arms imports from France, which included 62 combat aircraft
and 4 submarines, increased by 489 per cent between 2013–17 and 2018–22.
France therefore displaced the USA to become the second largest supplier to
India in 2018–22.
Arms imports by Pakistan increased by 14 per cent between 2013–17 and
2018–22 and accounted for 3.7 per cent of the global total. China supplied
over three quarters (77 per cent) of Pakistan’s arms imports in 2018–22.
East Asia, Oceania and South East Asia
Arms imports by states in East Asia (+21 per cent) and Oceania (+25 per cent)
increased between 2013–17 and 2018–22, while those by states in South East
Asia (–42 per cent) decreased.
China’s arms imports grew by 4.1 per cent and accounted for 4.6 per cent
of the global total in 2018–22. The vast majority of Chinese arms imports
(83 per cent) came from Russia. Russian deliveries in the last three years of
the period (2020–22) consisted almost entirely of helicopters and engines
for aircraft, which are the last few types of major arms that China has had
difficulties in developing.
Both Japan (+171 per cent) and South Korea (+61 per cent) increased their
arms imports between 2013–17 and 2018–22. The USA is a treaty ally of both
states and has been their largest arms supplier since 1950. Japan and South
Korea are expanding their military capabilities in a move that is largely
driven by tensions with North Korea and, in the case of Japan, with China.
Both Japan and South Korea have well-developed arms industries, but they
remain reliant on arms imports in some key categories, especially long-range
strike capabilities such as advanced combat aircraft and missiles. The USA
delivered 40 combat aircraft to South Korea in 2018–22, which accounted
for 43 per cent of South Korean arms imports in the period. It also delivered
29 combat aircraft to Japan, amounting to one third (33 per cent) of Japan­ese
arms imports. Both countries have pending deliveries of combat aircraft from
10 sipri fact sheet
the USA, and Japan ordered long-range land-attack missiles from the USA in
2022.
Australia, by far the largest arms importer in Oceania, is another key ally
of the USA and is also building up its long-range strike capabilities based
on a perceived heightened threat from China. Australia increased its arms
imports by 23 per cent between 2013–17 and 2018–22. With a 4.7 per cent
share of total global arms imports, it was the fourth largest arms importer
in the world in 2018–22. The delivery of 64 combat aircraft from the USA
accounted for 62 per cent of Australian arms imports in the period.
Although most South East Asian states continued to be affected by tensions
in the South China Sea, mainly with China, arms imports by states in the
subregion fell by 42 per cent between 2013–17 and 2018–22. The decrease
is at least partly because many arms-importing states are still in the process
of incorporating equipment delivered before 2018 into their armed forces.
Nevertheless, states in the subregion are continuing to build up their military
capabilities. The Philippines, for example, increased its arms imports by
64 per cent between 2013–17 and 2018–22, and Singapore expects to take
delivery of 4 submarines from Germany within the next few years. During
the period 2018–22, Indonesia placed orders for 42 combat aircraft from
France, doubling its current inventory, as well as for 3 submarines from South
Korea and for 6 frigates from Italy and 2 from the UK.
Europe
Arms imports by European states were 47 per cent higher in 2018–22 than in
2013–17. The biggest European arms importer in 2018–22 was the UK, which
was the 13th largest arms importer in the world, followed by Ukraine (see
box 2) and Norway, ranking 14th and 15th respectively. The USA accounted
for 56 per cent of the region’s arms imports in 2018–22, Russia for 5.8 per cent
(mainly to Belarus) and Germany for 5.1 per cent.
Box 2. The war in Ukraine as a driver of arms transfers in 2022
Ukraine imported very few major arms in the period from its independence in 1991 until the end of 2021. This changed after
the Russian invasion of Ukraine in February 2022, as the United States and many European states began to send large quantities
of military aid to Ukraine. As a result, it became the 3rd largest importer of major arms in 2022, after Qatar and India, and the
14th largest for the five-year period 2018–22, accounting for 2.0 per cent of total global arms imports. Of the 29 states that supplied
major arms to Ukraine in 2022, the main suppliers were the USA, which accounted for 35 per cent of total Ukrainian arms imports
during the year, Poland (17 per cent), Germany (11 per cent), the United Kingdom (10 per cent) and Czechia (4.4 per cent). Many
of the arms supplied in 2022 were second-hand items from existing stocks, including 228 artillery pieces and an estimated
5000 guided artil­
lery rockets from the USA, 280 tanks from Poland and over 7000 anti-tank missiles from the UK. Some newly
produced arms were also supplied, such as air defence systems from Germany, Poland, the UK and the USA. In many cases, the
supply of arms by one state was financed by other states or by the European Union (EU) through the European Peace Facility. For
example, by the end of 2022, the EU had made €3.1 billion available for military equipment for Ukraine.
Ukraine did not receive all the types of arms it asked its supporters to provide and, at different stages during 2022, there was
divergence between states about what they were willing to supply. For example, while Poland and Czechia delivered tanks to
Ukraine in the first half of 2022, Germany, the UK and the USA decided to do so only in late 2022 or early 2023. Despite a growing
willingness among states to send a wider variety of arms to Ukraine, as of the end of 2022, suppliers were still not prepared to
deliver arms with a long-range strike capability, such as combat aircraft and long-range land-attack missiles.
The arms supplies to Ukraine in 2022 were vital for the Ukrainian effort to halt the Russian offensive. Russia, in contrast, relied
almost exclusively on domestically produced arms—although it did import uncrewed aerial vehicles (UAVs) and flying bombs from
Iran in 2022.
trends in international arms transfers, 2022 11
European NATO states
Largely in response to the deteriorating security environment in the region,
NATO states in Europe increased their arms imports by 65 per cent between
2013–17and2018–22.TheUSAaccountedfor65percentoftotalarmsimports
by Euro­
pean NATO states and the NATO organization itself (see table 2) in
2018–22. The next biggest suppliers were France (8.6 per cent) and South
Korea(4.9percent).ThearmsimportsofEuropeanNATOstatesareexpected
to continue to rise in the coming years, based on existing programmes for
arms imports. These include orders placed before the February 2022 Rus­sian
invasion of Ukraine and several large orders announced afterwards. Some of
the orders placed in 2022 were the result of accelerated pro­
cure­
ment pro­
cesses implemented in response to the war in Ukraine. For example, in the
first four years of the period (2018–21), Poland’s most notable arms import
orders included 32 combat aircraft and 4 missile and air defence systems
from the USA; however, in 2022 Poland announced new orders for 394 tanks,
96 combat helicopters and 12 missile and air defence systems from the USA;
48 combat aircraft, 1000 tanks, 672 self-propelled guns and 288 multiple
rocket launchers from South Korea; and 3 frigates from the UK. After an
accelerated procurement process, Germany ordered 35 combat aircraft from
the USA in late 2022. These are specifically for carrying nuclear weapons
owned by the USA and will replace existing aircraft that have this task.
The Middle East
Arms imports by states in the Middle East were 8.8 per cent lower in 2018–22
than in 2013–17. Three of the top 10 arms-importing states in 2018–22 were
in the Middle East: Saudi Arabia, Qatar and Egypt. The USA accounted for
54 per cent of Middle Eastern arms imports. The next largest suppliers were
France (12 per cent), Russia (8.6 per cent) and Italy (8.4 per cent).
The Gulf region
Against the backdrop of various tensions in the region, arms transfers con­
tinued to play a major role in security developments in the Gulf in 2018–22.
Saudi Arabia was the world’s second largest arms importer in 2018–22
and received 9.6 per cent of all arms imports. The USA supplied 78 per cent
of Saudi Arabian arms imports in the period, which included the deliv­
ery of 91 combat aircraft with hundreds of land-attack missiles and over
20 000 guided bombs.
Qatar became the third largest arms importer in the world as its arms
imports increased by 311 per cent between 2013–17 and 2018–22. Its main
suppliers in 2018–22 were the USA, which accounted for 42 per cent of
Qatari arms imports, France (29 per cent) and Italy (14 per cent). Qatar’s
arms imports in 2018–22 included 36 combat aircraft from France, 36 from
the USA and 8 from the UK, as well as 3 frigates from Italy.
The UAE’s arms imports in 2018–22 were 38 per cent lower than in 2013–17,
and it was the 11th largest arms importer globally. Notable arms imports in
2018–22 included hundreds of air defence missiles and over 20 000 guided
bombs from the USA.
SIPRI is an independent
international institute
dedicated to research into
conflict, armaments, arms
control and disarmament.
Established in 1966, SIPRI
provides data, analysis and
recommendations, based on
open sources, to policymakers,
researchers, media and the
interested public.
GOVERNING BOARD
Stefan Löfven, Chair (Sweden)
Dr Mohamed Ibn Chambas
(Ghana)
Ambassador Chan Heng Chee
(Singapore)
Jean-Marie Guéhenno (France)
Dr Radha Kumar (India)
Dr Patricia Lewis (Ireland/
United Kingdom)
Dr Jessica Tuchman Mathews
(United States)
Dr Feodor Voitolovsky (Russia)
DIRECTOR
Dan Smith (United Kingdom)
© SIPRI 2023
Signalistgatan 9
SE-169 72 Solna, Sweden
Telephone: +46 8 655 97 00
Email: sipri@sipri.org
Internet: www.sipri.org
ABOUT THE AUTHORS
Pieter D. Wezeman (Netherlands/Sweden) is a Senior Researcher with SIPRI’s
Arms Transfers Programme. Justine Gadon (France) is a Research Assistant with
SIPRI’s Military Expenditure and Arms Production Programme. Siemon T. Wezeman
(Netherlands) is a Senior Researcher with SIPRI’s Arms Transfers Programme.
About SIPRI’s data on arms transfers
SIPRI’s statistical data on arms transfers relates to actual deliveries of major arms,
as defined by SIPRI. SIPRI measures the volume of international transfers of major
arms using a common unit—the trend-indicator value (TIV). The methodology for the
SIPRI TIV is described on the Arms Transfers Database web page.
As the volume of deliveries can fluctuate significantly year-on-year, SIPRI presents
data for five-year periods, giving a more stable measure of trends. Percentage shares
presented in this SIPRI Fact Sheet do not always add up to 100 per cent or to stated
totals because of the conventions of rounding.
TheSIPRIArmsTransfersDatabase,accessibleontheSIPRIwebsite,istheonlypublic
resource that provides consistent information, often estimates, on all international
transfers of major arms (including sales, gifts and production under licence) to states,
international organizations and non-state groups since 1950. The database aims to
contribute to an understanding of the effects of arms flows on peace, stability and
violent conflict. This fact sheet is intended to encourage the use of the database for
further research, investigations, policymaking and public debate.
Kuwait’s arms imports increased by 146 per cent between 2013–17 and
2018–22, mainly due to the delivery of 28 combat aircraft and 218 tanks from
the USA and 6 combat aircraft from Italy.
Iran’s arms imports have been at a very low level relative to those of
other arms importers in the Gulf region since around 1993. Its imports of
major arms in 2018–22 were close to zero. In 2022 Iran placed an order for
24 combat aircraft from Russia, its first significant procurement of combat
aircraft since the early 1990s. By the end of 2022, Saudi Arabia had 41 combat
aircraft on order from the USA, while Qatar had 22 on order from the USA
and 16 from the UK, the UAE had 80 on order from France, and Kuwait had
22 on order from Italy.
Arms imports and naval build-ups in the eastern Mediterranean
Amid ongoing maritime disputes in the eastern Mediterranean, several
states in the region continued to increase their naval capabilities in 2018–22.
For example, Egypt received four submarines and the first of four frigates
on order from Germany; two of three frigates on order from France; and two
frigates from Italy. In 2022 Israel received the first two of four frigates on
orderfromGermany.IsraelistoreceiveonesubmarinefromGermanyin2023
and placed an order for three more in 2022. Greece ordered three frigates
from France in 2022. Türkiye is able to produce most types of warships, but
has six submarines on order from Germany for delivery in 2023–27 and an
amphibious assault ship on order from Spain for delivery in 2023.

Más contenido relacionado

La actualidad más candente (20)

Reading skill & writing skill
Reading skill & writing skillReading skill & writing skill
Reading skill & writing skill
 
Html Basic Tags
Html Basic TagsHtml Basic Tags
Html Basic Tags
 
Reading Comprehension
Reading ComprehensionReading Comprehension
Reading Comprehension
 
Java Swing
Java SwingJava Swing
Java Swing
 
Java DataBase Connectivity API (JDBC API)
Java DataBase Connectivity API (JDBC API)Java DataBase Connectivity API (JDBC API)
Java DataBase Connectivity API (JDBC API)
 
Java awt
Java awtJava awt
Java awt
 
Javascript variables and datatypes
Javascript variables and datatypesJavascript variables and datatypes
Javascript variables and datatypes
 
Looping statements
Looping statementsLooping statements
Looping statements
 
Html Form Controls
Html Form ControlsHtml Form Controls
Html Form Controls
 
Python GUI Programming
Python GUI ProgrammingPython GUI Programming
Python GUI Programming
 
Object-oriented programming
Object-oriented programmingObject-oriented programming
Object-oriented programming
 
Javascript functions
Javascript functionsJavascript functions
Javascript functions
 
Php server variables
Php server variablesPhp server variables
Php server variables
 
Dynamic memory allocation
Dynamic memory allocationDynamic memory allocation
Dynamic memory allocation
 
ADO.NET
ADO.NETADO.NET
ADO.NET
 
Technical report writing
Technical report writingTechnical report writing
Technical report writing
 
Java Networking
Java NetworkingJava Networking
Java Networking
 
Elements of poetry
Elements of poetryElements of poetry
Elements of poetry
 
[OOP - Lec 16,17] Objects as Function Parameter and ReturnType
[OOP - Lec 16,17] Objects as Function Parameter and ReturnType[OOP - Lec 16,17] Objects as Function Parameter and ReturnType
[OOP - Lec 16,17] Objects as Function Parameter and ReturnType
 
Object Oriented Programming In .Net
Object Oriented Programming In .NetObject Oriented Programming In .Net
Object Oriented Programming In .Net
 

Más de dynamo777

Про затвердження Змін до Положення про військово-лікарську експертизу в Зброй...
Про затвердження Змін до Положення про військово-лікарську експертизу в Зброй...Про затвердження Змін до Положення про військово-лікарську експертизу в Зброй...
Про затвердження Змін до Положення про військово-лікарську експертизу в Зброй...dynamo777
 
The Henley Passport Index
The Henley Passport IndexThe Henley Passport Index
The Henley Passport Indexdynamo777
 
Journalists killed, detained, held hostage and missing
Journalists killed, detained,  held hostage and missingJournalists killed, detained,  held hostage and missing
Journalists killed, detained, held hostage and missingdynamo777
 
Проект Закону про внесення змін до Закону України "Про освіту" щодо запровадж...
Проект Закону про внесення змін до Закону України "Про освіту" щодо запровадж...Проект Закону про внесення змін до Закону України "Про освіту" щодо запровадж...
Проект Закону про внесення змін до Закону України "Про освіту" щодо запровадж...dynamo777
 
world-giving-index-2023.pdf
world-giving-index-2023.pdfworld-giving-index-2023.pdf
world-giving-index-2023.pdfdynamo777
 
Запровадження спеціального режиму оподаткування доходів, отриманих фізичними ...
Запровадження спеціального режиму оподаткування доходів, отриманих фізичними ...Запровадження спеціального режиму оподаткування доходів, отриманих фізичними ...
Запровадження спеціального режиму оподаткування доходів, отриманих фізичними ...dynamo777
 
The Post Disaster Needs Assessment report of the Kakhovka Dam Disaster
The Post Disaster Needs Assessment report of the Kakhovka Dam DisasterThe Post Disaster Needs Assessment report of the Kakhovka Dam Disaster
The Post Disaster Needs Assessment report of the Kakhovka Dam Disasterdynamo777
 
Проект Закону про внесення змін до статті 23 Закону України "Про мобілізаційн...
Проект Закону про внесення змін до статті 23 Закону України "Про мобілізаційн...Проект Закону про внесення змін до статті 23 Закону України "Про мобілізаційн...
Проект Закону про внесення змін до статті 23 Закону України "Про мобілізаційн...dynamo777
 
Пояснювальна_декриміналізація_порно.pdf
Пояснювальна_декриміналізація_порно.pdfПояснювальна_декриміналізація_порно.pdf
Пояснювальна_декриміналізація_порно.pdfdynamo777
 
Відновлення декларування
Відновлення декларуванняВідновлення декларування
Відновлення декларуванняdynamo777
 
INTERNATIONAL COURT OF JUSTICE
INTERNATIONAL COURT OF JUSTICEINTERNATIONAL COURT OF JUSTICE
INTERNATIONAL COURT OF JUSTICEdynamo777
 
Global Trends in Forced Displacement 2022
Global Trends in Forced Displacement 2022Global Trends in Forced Displacement 2022
Global Trends in Forced Displacement 2022dynamo777
 
Постановление Правительства Российской Федерации от 30.05.2023 № 873
Постановление Правительства Российской Федерации от 30.05.2023 № 873Постановление Правительства Российской Федерации от 30.05.2023 № 873
Постановление Правительства Российской Федерации от 30.05.2023 № 873dynamo777
 
Довідник військовослужбовця після поранення
Довідник військовослужбовця після пораненняДовідник військовослужбовця після поранення
Довідник військовослужбовця після пораненняdynamo777
 
G7 Japan 2023
G7 Japan 2023G7 Japan 2023
G7 Japan 2023dynamo777
 
Про внесення змін до деяких законодавчих актів України щодо використання та ...
Про внесення змін до деяких законодавчих актів України  щодо використання та ...Про внесення змін до деяких законодавчих актів України  щодо використання та ...
Про внесення змін до деяких законодавчих актів України щодо використання та ...dynamo777
 
Міноборони змінило договори із забезпечення військових харчуванням
Міноборони змінило договори із забезпечення військових харчуваннямМіноборони змінило договори із забезпечення військових харчуванням
Міноборони змінило договори із забезпечення військових харчуваннямdynamo777
 
Russia’s Systematic Program for the Re-education and Adoption of Ukraine's Ch...
Russia’s Systematic Program for the Re-education and Adoption of Ukraine's Ch...Russia’s Systematic Program for the Re-education and Adoption of Ukraine's Ch...
Russia’s Systematic Program for the Re-education and Adoption of Ukraine's Ch...dynamo777
 
WORLD ECONOMIC OUTLOOK INTERNATIONAL MONETARY FUND UPDATE
WORLD ECONOMIC OUTLOOK INTERNATIONAL MONETARY FUND UPDATEWORLD ECONOMIC OUTLOOK INTERNATIONAL MONETARY FUND UPDATE
WORLD ECONOMIC OUTLOOK INTERNATIONAL MONETARY FUND UPDATEdynamo777
 
Фінальний узгоджений механізм проведення НМТ - 2023
Фінальний узгоджений механізм проведення НМТ - 2023Фінальний узгоджений механізм проведення НМТ - 2023
Фінальний узгоджений механізм проведення НМТ - 2023dynamo777
 

Más de dynamo777 (20)

Про затвердження Змін до Положення про військово-лікарську експертизу в Зброй...
Про затвердження Змін до Положення про військово-лікарську експертизу в Зброй...Про затвердження Змін до Положення про військово-лікарську експертизу в Зброй...
Про затвердження Змін до Положення про військово-лікарську експертизу в Зброй...
 
The Henley Passport Index
The Henley Passport IndexThe Henley Passport Index
The Henley Passport Index
 
Journalists killed, detained, held hostage and missing
Journalists killed, detained,  held hostage and missingJournalists killed, detained,  held hostage and missing
Journalists killed, detained, held hostage and missing
 
Проект Закону про внесення змін до Закону України "Про освіту" щодо запровадж...
Проект Закону про внесення змін до Закону України "Про освіту" щодо запровадж...Проект Закону про внесення змін до Закону України "Про освіту" щодо запровадж...
Проект Закону про внесення змін до Закону України "Про освіту" щодо запровадж...
 
world-giving-index-2023.pdf
world-giving-index-2023.pdfworld-giving-index-2023.pdf
world-giving-index-2023.pdf
 
Запровадження спеціального режиму оподаткування доходів, отриманих фізичними ...
Запровадження спеціального режиму оподаткування доходів, отриманих фізичними ...Запровадження спеціального режиму оподаткування доходів, отриманих фізичними ...
Запровадження спеціального режиму оподаткування доходів, отриманих фізичними ...
 
The Post Disaster Needs Assessment report of the Kakhovka Dam Disaster
The Post Disaster Needs Assessment report of the Kakhovka Dam DisasterThe Post Disaster Needs Assessment report of the Kakhovka Dam Disaster
The Post Disaster Needs Assessment report of the Kakhovka Dam Disaster
 
Проект Закону про внесення змін до статті 23 Закону України "Про мобілізаційн...
Проект Закону про внесення змін до статті 23 Закону України "Про мобілізаційн...Проект Закону про внесення змін до статті 23 Закону України "Про мобілізаційн...
Проект Закону про внесення змін до статті 23 Закону України "Про мобілізаційн...
 
Пояснювальна_декриміналізація_порно.pdf
Пояснювальна_декриміналізація_порно.pdfПояснювальна_декриміналізація_порно.pdf
Пояснювальна_декриміналізація_порно.pdf
 
Відновлення декларування
Відновлення декларуванняВідновлення декларування
Відновлення декларування
 
INTERNATIONAL COURT OF JUSTICE
INTERNATIONAL COURT OF JUSTICEINTERNATIONAL COURT OF JUSTICE
INTERNATIONAL COURT OF JUSTICE
 
Global Trends in Forced Displacement 2022
Global Trends in Forced Displacement 2022Global Trends in Forced Displacement 2022
Global Trends in Forced Displacement 2022
 
Постановление Правительства Российской Федерации от 30.05.2023 № 873
Постановление Правительства Российской Федерации от 30.05.2023 № 873Постановление Правительства Российской Федерации от 30.05.2023 № 873
Постановление Правительства Российской Федерации от 30.05.2023 № 873
 
Довідник військовослужбовця після поранення
Довідник військовослужбовця після пораненняДовідник військовослужбовця після поранення
Довідник військовослужбовця після поранення
 
G7 Japan 2023
G7 Japan 2023G7 Japan 2023
G7 Japan 2023
 
Про внесення змін до деяких законодавчих актів України щодо використання та ...
Про внесення змін до деяких законодавчих актів України  щодо використання та ...Про внесення змін до деяких законодавчих актів України  щодо використання та ...
Про внесення змін до деяких законодавчих актів України щодо використання та ...
 
Міноборони змінило договори із забезпечення військових харчуванням
Міноборони змінило договори із забезпечення військових харчуваннямМіноборони змінило договори із забезпечення військових харчуванням
Міноборони змінило договори із забезпечення військових харчуванням
 
Russia’s Systematic Program for the Re-education and Adoption of Ukraine's Ch...
Russia’s Systematic Program for the Re-education and Adoption of Ukraine's Ch...Russia’s Systematic Program for the Re-education and Adoption of Ukraine's Ch...
Russia’s Systematic Program for the Re-education and Adoption of Ukraine's Ch...
 
WORLD ECONOMIC OUTLOOK INTERNATIONAL MONETARY FUND UPDATE
WORLD ECONOMIC OUTLOOK INTERNATIONAL MONETARY FUND UPDATEWORLD ECONOMIC OUTLOOK INTERNATIONAL MONETARY FUND UPDATE
WORLD ECONOMIC OUTLOOK INTERNATIONAL MONETARY FUND UPDATE
 
Фінальний узгоджений механізм проведення НМТ - 2023
Фінальний узгоджений механізм проведення НМТ - 2023Фінальний узгоджений механізм проведення НМТ - 2023
Фінальний узгоджений механізм проведення НМТ - 2023
 

Último

{Qatar{^🚀^(+971558539980**}})Abortion Pills for Sale in Dubai. .abu dhabi, sh...
{Qatar{^🚀^(+971558539980**}})Abortion Pills for Sale in Dubai. .abu dhabi, sh...{Qatar{^🚀^(+971558539980**}})Abortion Pills for Sale in Dubai. .abu dhabi, sh...
{Qatar{^🚀^(+971558539980**}})Abortion Pills for Sale in Dubai. .abu dhabi, sh...hyt3577
 
06052024_First India Newspaper Jaipur.pdf
06052024_First India Newspaper Jaipur.pdf06052024_First India Newspaper Jaipur.pdf
06052024_First India Newspaper Jaipur.pdfFIRST INDIA
 
Enjoy Night ≽ 8448380779 ≼ Call Girls In Gurgaon Sector 46 (Gurgaon)
Enjoy Night ≽ 8448380779 ≼ Call Girls In Gurgaon Sector 46 (Gurgaon)Enjoy Night ≽ 8448380779 ≼ Call Girls In Gurgaon Sector 46 (Gurgaon)
Enjoy Night ≽ 8448380779 ≼ Call Girls In Gurgaon Sector 46 (Gurgaon)Delhi Call girls
 
30042024_First India Newspaper Jaipur.pdf
30042024_First India Newspaper Jaipur.pdf30042024_First India Newspaper Jaipur.pdf
30042024_First India Newspaper Jaipur.pdfFIRST INDIA
 
05052024_First India Newspaper Jaipur.pdf
05052024_First India Newspaper Jaipur.pdf05052024_First India Newspaper Jaipur.pdf
05052024_First India Newspaper Jaipur.pdfFIRST INDIA
 
Pakistan PMLN Election Manifesto 2024.pdf
Pakistan PMLN Election Manifesto 2024.pdfPakistan PMLN Election Manifesto 2024.pdf
Pakistan PMLN Election Manifesto 2024.pdfFahimUddin61
 
BDSM⚡Call Girls in Indirapuram Escorts >༒8448380779 Escort Service
BDSM⚡Call Girls in Indirapuram Escorts >༒8448380779 Escort ServiceBDSM⚡Call Girls in Indirapuram Escorts >༒8448380779 Escort Service
BDSM⚡Call Girls in Indirapuram Escorts >༒8448380779 Escort ServiceDelhi Call girls
 
Defensa de JOH insiste que testimonio de analista de la DEA es falso y solici...
Defensa de JOH insiste que testimonio de analista de la DEA es falso y solici...Defensa de JOH insiste que testimonio de analista de la DEA es falso y solici...
Defensa de JOH insiste que testimonio de analista de la DEA es falso y solici...AlexisTorres963861
 
Nara Chandrababu Naidu's Visionary Policies For Andhra Pradesh's Development
Nara Chandrababu Naidu's Visionary Policies For Andhra Pradesh's DevelopmentNara Chandrababu Naidu's Visionary Policies For Andhra Pradesh's Development
Nara Chandrababu Naidu's Visionary Policies For Andhra Pradesh's Developmentnarsireddynannuri1
 
Embed-4.pdf lkdiinlajeklhndklheduhuekjdh
Embed-4.pdf lkdiinlajeklhndklheduhuekjdhEmbed-4.pdf lkdiinlajeklhndklheduhuekjdh
Embed-4.pdf lkdiinlajeklhndklheduhuekjdhbhavenpr
 
Enjoy Night⚡Call Girls Rajokri Delhi >༒8448380779 Escort Service
Enjoy Night⚡Call Girls Rajokri Delhi >༒8448380779 Escort ServiceEnjoy Night⚡Call Girls Rajokri Delhi >༒8448380779 Escort Service
Enjoy Night⚡Call Girls Rajokri Delhi >༒8448380779 Escort ServiceDelhi Call girls
 
1971 war india pakistan bangladesh liberation.ppt
1971 war india pakistan bangladesh liberation.ppt1971 war india pakistan bangladesh liberation.ppt
1971 war india pakistan bangladesh liberation.pptsammehtumblr
 
2024 04 03 AZ GOP LD4 Gen Meeting Minutes FINAL.docx
2024 04 03 AZ GOP LD4 Gen Meeting Minutes FINAL.docx2024 04 03 AZ GOP LD4 Gen Meeting Minutes FINAL.docx
2024 04 03 AZ GOP LD4 Gen Meeting Minutes FINAL.docxkfjstone13
 
BDSM⚡Call Girls in Sector 135 Noida Escorts >༒8448380779 Escort Service
BDSM⚡Call Girls in Sector 135 Noida Escorts >༒8448380779 Escort ServiceBDSM⚡Call Girls in Sector 135 Noida Escorts >༒8448380779 Escort Service
BDSM⚡Call Girls in Sector 135 Noida Escorts >༒8448380779 Escort ServiceDelhi Call girls
 
Enjoy Night⚡Call Girls Iffco Chowk Gurgaon >༒8448380779 Escort Service
Enjoy Night⚡Call Girls Iffco Chowk Gurgaon >༒8448380779 Escort ServiceEnjoy Night⚡Call Girls Iffco Chowk Gurgaon >༒8448380779 Escort Service
Enjoy Night⚡Call Girls Iffco Chowk Gurgaon >༒8448380779 Escort ServiceDelhi Call girls
 
KAHULUGAN AT KAHALAGAHAN NG GAWAING PANSIBIKO.pptx
KAHULUGAN AT KAHALAGAHAN NG GAWAING PANSIBIKO.pptxKAHULUGAN AT KAHALAGAHAN NG GAWAING PANSIBIKO.pptx
KAHULUGAN AT KAHALAGAHAN NG GAWAING PANSIBIKO.pptxjohnandrewcarlos
 
Group_5_US-China Trade War to understand the trade
Group_5_US-China Trade War to understand the tradeGroup_5_US-China Trade War to understand the trade
Group_5_US-China Trade War to understand the tradeRahatulAshafeen
 
2024 03 13 AZ GOP LD4 Gen Meeting Minutes_FINAL.docx
2024 03 13 AZ GOP LD4 Gen Meeting Minutes_FINAL.docx2024 03 13 AZ GOP LD4 Gen Meeting Minutes_FINAL.docx
2024 03 13 AZ GOP LD4 Gen Meeting Minutes_FINAL.docxkfjstone13
 
Nurturing Families, Empowering Lives: TDP's Vision for Family Welfare in Andh...
Nurturing Families, Empowering Lives: TDP's Vision for Family Welfare in Andh...Nurturing Families, Empowering Lives: TDP's Vision for Family Welfare in Andh...
Nurturing Families, Empowering Lives: TDP's Vision for Family Welfare in Andh...narsireddynannuri1
 
Enjoy Night ≽ 8448380779 ≼ Call Girls In Gurgaon Sector 48 (Gurgaon)
Enjoy Night ≽ 8448380779 ≼ Call Girls In Gurgaon Sector 48 (Gurgaon)Enjoy Night ≽ 8448380779 ≼ Call Girls In Gurgaon Sector 48 (Gurgaon)
Enjoy Night ≽ 8448380779 ≼ Call Girls In Gurgaon Sector 48 (Gurgaon)Delhi Call girls
 

Último (20)

{Qatar{^🚀^(+971558539980**}})Abortion Pills for Sale in Dubai. .abu dhabi, sh...
{Qatar{^🚀^(+971558539980**}})Abortion Pills for Sale in Dubai. .abu dhabi, sh...{Qatar{^🚀^(+971558539980**}})Abortion Pills for Sale in Dubai. .abu dhabi, sh...
{Qatar{^🚀^(+971558539980**}})Abortion Pills for Sale in Dubai. .abu dhabi, sh...
 
06052024_First India Newspaper Jaipur.pdf
06052024_First India Newspaper Jaipur.pdf06052024_First India Newspaper Jaipur.pdf
06052024_First India Newspaper Jaipur.pdf
 
Enjoy Night ≽ 8448380779 ≼ Call Girls In Gurgaon Sector 46 (Gurgaon)
Enjoy Night ≽ 8448380779 ≼ Call Girls In Gurgaon Sector 46 (Gurgaon)Enjoy Night ≽ 8448380779 ≼ Call Girls In Gurgaon Sector 46 (Gurgaon)
Enjoy Night ≽ 8448380779 ≼ Call Girls In Gurgaon Sector 46 (Gurgaon)
 
30042024_First India Newspaper Jaipur.pdf
30042024_First India Newspaper Jaipur.pdf30042024_First India Newspaper Jaipur.pdf
30042024_First India Newspaper Jaipur.pdf
 
05052024_First India Newspaper Jaipur.pdf
05052024_First India Newspaper Jaipur.pdf05052024_First India Newspaper Jaipur.pdf
05052024_First India Newspaper Jaipur.pdf
 
Pakistan PMLN Election Manifesto 2024.pdf
Pakistan PMLN Election Manifesto 2024.pdfPakistan PMLN Election Manifesto 2024.pdf
Pakistan PMLN Election Manifesto 2024.pdf
 
BDSM⚡Call Girls in Indirapuram Escorts >༒8448380779 Escort Service
BDSM⚡Call Girls in Indirapuram Escorts >༒8448380779 Escort ServiceBDSM⚡Call Girls in Indirapuram Escorts >༒8448380779 Escort Service
BDSM⚡Call Girls in Indirapuram Escorts >༒8448380779 Escort Service
 
Defensa de JOH insiste que testimonio de analista de la DEA es falso y solici...
Defensa de JOH insiste que testimonio de analista de la DEA es falso y solici...Defensa de JOH insiste que testimonio de analista de la DEA es falso y solici...
Defensa de JOH insiste que testimonio de analista de la DEA es falso y solici...
 
Nara Chandrababu Naidu's Visionary Policies For Andhra Pradesh's Development
Nara Chandrababu Naidu's Visionary Policies For Andhra Pradesh's DevelopmentNara Chandrababu Naidu's Visionary Policies For Andhra Pradesh's Development
Nara Chandrababu Naidu's Visionary Policies For Andhra Pradesh's Development
 
Embed-4.pdf lkdiinlajeklhndklheduhuekjdh
Embed-4.pdf lkdiinlajeklhndklheduhuekjdhEmbed-4.pdf lkdiinlajeklhndklheduhuekjdh
Embed-4.pdf lkdiinlajeklhndklheduhuekjdh
 
Enjoy Night⚡Call Girls Rajokri Delhi >༒8448380779 Escort Service
Enjoy Night⚡Call Girls Rajokri Delhi >༒8448380779 Escort ServiceEnjoy Night⚡Call Girls Rajokri Delhi >༒8448380779 Escort Service
Enjoy Night⚡Call Girls Rajokri Delhi >༒8448380779 Escort Service
 
1971 war india pakistan bangladesh liberation.ppt
1971 war india pakistan bangladesh liberation.ppt1971 war india pakistan bangladesh liberation.ppt
1971 war india pakistan bangladesh liberation.ppt
 
2024 04 03 AZ GOP LD4 Gen Meeting Minutes FINAL.docx
2024 04 03 AZ GOP LD4 Gen Meeting Minutes FINAL.docx2024 04 03 AZ GOP LD4 Gen Meeting Minutes FINAL.docx
2024 04 03 AZ GOP LD4 Gen Meeting Minutes FINAL.docx
 
BDSM⚡Call Girls in Sector 135 Noida Escorts >༒8448380779 Escort Service
BDSM⚡Call Girls in Sector 135 Noida Escorts >༒8448380779 Escort ServiceBDSM⚡Call Girls in Sector 135 Noida Escorts >༒8448380779 Escort Service
BDSM⚡Call Girls in Sector 135 Noida Escorts >༒8448380779 Escort Service
 
Enjoy Night⚡Call Girls Iffco Chowk Gurgaon >༒8448380779 Escort Service
Enjoy Night⚡Call Girls Iffco Chowk Gurgaon >༒8448380779 Escort ServiceEnjoy Night⚡Call Girls Iffco Chowk Gurgaon >༒8448380779 Escort Service
Enjoy Night⚡Call Girls Iffco Chowk Gurgaon >༒8448380779 Escort Service
 
KAHULUGAN AT KAHALAGAHAN NG GAWAING PANSIBIKO.pptx
KAHULUGAN AT KAHALAGAHAN NG GAWAING PANSIBIKO.pptxKAHULUGAN AT KAHALAGAHAN NG GAWAING PANSIBIKO.pptx
KAHULUGAN AT KAHALAGAHAN NG GAWAING PANSIBIKO.pptx
 
Group_5_US-China Trade War to understand the trade
Group_5_US-China Trade War to understand the tradeGroup_5_US-China Trade War to understand the trade
Group_5_US-China Trade War to understand the trade
 
2024 03 13 AZ GOP LD4 Gen Meeting Minutes_FINAL.docx
2024 03 13 AZ GOP LD4 Gen Meeting Minutes_FINAL.docx2024 03 13 AZ GOP LD4 Gen Meeting Minutes_FINAL.docx
2024 03 13 AZ GOP LD4 Gen Meeting Minutes_FINAL.docx
 
Nurturing Families, Empowering Lives: TDP's Vision for Family Welfare in Andh...
Nurturing Families, Empowering Lives: TDP's Vision for Family Welfare in Andh...Nurturing Families, Empowering Lives: TDP's Vision for Family Welfare in Andh...
Nurturing Families, Empowering Lives: TDP's Vision for Family Welfare in Andh...
 
Enjoy Night ≽ 8448380779 ≼ Call Girls In Gurgaon Sector 48 (Gurgaon)
Enjoy Night ≽ 8448380779 ≼ Call Girls In Gurgaon Sector 48 (Gurgaon)Enjoy Night ≽ 8448380779 ≼ Call Girls In Gurgaon Sector 48 (Gurgaon)
Enjoy Night ≽ 8448380779 ≼ Call Girls In Gurgaon Sector 48 (Gurgaon)
 

TRENDS IN INTERNATIONAL ARMS TRANSFERS, 2022

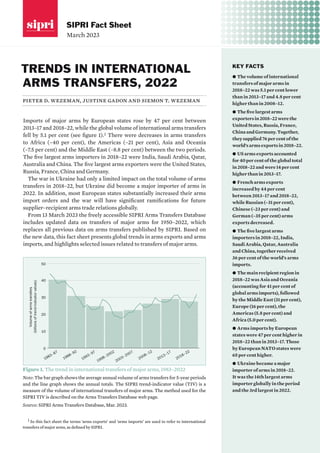
  • 1. March 2023 SIPRI Fact Sheet KEY FACTS ș The volume of international transfers of major arms in 2018–22 was 5.1 per cent lower than in 2013–17 and 4.8 per cent higher than in 2008–12. ș Thefivelargestarms exportersin2018–22werethe UnitedStates,Russia,France, ChinaandGermany.Together, theysupplied76percentofthe world’sarmsexportsin2018–22. ș US arms exports accounted for 40 per cent of the global total in 2018–22 and were 14 per cent higher than in 2013–17. ș French arms exports increased by 44 per cent between 2013–17 and 2018–22, while Russian (–31 per cent), Chinese (–23 per cent) and German (–35 per cent) arms exports decreased. ș The five largest arms importers in 2018–22, India, Saudi Arabia, Qatar, Australia and China, together received 36 per cent of the world’s arms imports. ș The main recipient region in 2018–22 was Asia and Oceania (accounting for 41 per cent of global arms imports), followed by the Middle East (31 per cent), Europe (16 per cent), the Americas (5.8 per cent) and Africa (5.0 per cent). ș Arms imports by European states were 47 per cent higher in 2018–22 than in 2013–17. Those by European NATO states were 65 per cent higher. ș Ukraine became a major importer of arms in 2018–22. It was the 14th largest arms importer globally in the period and the 3rd largest in 2022. TRENDS IN INTERNATIONAL ARMS TRANSFERS, 2022 pieter d. wezeman, justine gadon and siemon t. wezeman Imports of major arms by European states rose by 47 per cent between 2013–17 and 2018–22, while the global volume of international arms transfers fell by 5.1 per cent (see figure 1).1 There were decreases in arms trans­ fers to Africa (–40 per cent), the Americas (–21 per cent), Asia and Oceania (–7.5 per cent) and the Middle East (–8.8 per cent) between the two periods. The five largest arms importers in 2018–22 were India, Saudi Arabia, Qatar, Australia and China. The five largest arms exporters were the United States, Russia, France, China and Germany. The war in Ukraine had only a limited impact on the total volume of arms transfers in 2018–22, but Ukraine did become a major importer of arms in 2022. In addition, most European states substantially increased their arms import orders and the war will have significant ramifi­ cations for future supplier–recipient arms trade relations globally. From 13 March 2023 the freely accessible SIPRI Arms Transfers Data­ base includes updated data on transfers of major arms for 1950–2022, which replaces all previous data on arms transfers published by SIPRI. Based on the new data, this fact sheet presents global trends in arms exports and arms imports, and highlights selected issues related to transfers of major arms. 1 In this fact sheet the terms ‘arms exports’ and ‘arms imports’ are used to refer to international transfers of major arms, as defined by SIPRI. Volume of arms transfers (billions of trend-indicator values) 0 10 20 30 40 50 1983–87 1988–92 1993–97 1998–2002 2003–2007 2008–12 2013–17 2018–22 Figure 1. The trend in international transfers of major arms, 1983–2022 Note: The bar graph shows the average annual volume of arms transfers for 5-year periods and the line graph shows the annual totals. The SIPRI trend-indicator value (TIV) is a measure of the volume of inter­ national transfers of major arms. The method used for the SIPRI TIV is described on the Arms Transfers Database web page. Source: SIPRI Arms Transfers Database, Mar. 2023.
  • 2. 2 sipri fact sheet THE EXPORTERS, 2018–22 SIPRI has identified 63 states as exporters of major arms in 2018–22. The five largest exporters of arms during that period—the USA, Russia, France, China and Germany—accounted for over three quarters (76 per cent) of all arms exports (see figure 2 and table 1). US and French arms exports rose between 2013–17 and 2018–22, while Russian, Chinese and German arms exports fell (see figure 3). The top 25 arms exporters accounted for 98 per cent of the world’s arms exports in 2018–22 (see table 1). States in North America and Europe together accounted for 87 per cent of all arms exports in the period. The five largest exporters in Western Europe—France, Germany, Italy, the United Kingdom and Spain—supplied around one quarter (24 per cent) of total global arms exports in 2018–22 (see figure 2). Table 1. The 25 largest exporters of major arms and their main recipients, 2018–22 Percentages below 10 are rounded to 1 decimal place; percentages over 10 are rounded to whole numbers. Exporter Share of global arms exports (%) Per cent change from 2013–17 to 2018–22a Main recipients and their share of exporter’s total exports (%), 2018–22 2018–22 2013–17 1st 2nd 3rd 1 United States 40 33 14 Saudi Arabia 19 Japan 8.6 Australia 8.4 2 Russia 16 22 –31 India 31 China 23 Egypt 9.3 3 France 11 7.1 44 India 30 Qatar 17 Egypt 8.0 4 China 5.2 6.3 –23 Pakistan 54 Bangladesh 12 Serbia 4.5 5 Germany 4.2 6.1 –35 Egypt 18 South Korea 17 Israel 9.5 6 Italy 3.8 2.5 45 Qatar 24 Egypt 23 Türkiye 12 7 United Kingdom 3.2 4.7 –35 USA 20 Qatar 16 Saudi Arabia 7.7 8 Spain 2.6 2.5 –4.4 Australia 35 Saudi Arabia 19 Belgium 12 9 South Korea 2.4 1.3 74 Philippines 16 India 13 Thailand 13 10 Israel 2.3 2.6 –15 India 37 Azerbaijan 9.1 Philippines 8.5 11 Netherlands 1.4 2.1 –39 USA 27 Mexico 11 Tunisia 7.4 12 Türkiye 1.1 0.6 69 Qatar 20 UAE 17 Oman 13 13 Sweden 0.8 0.9 –16 USA 25 Pakistan 24 Brazil 15 14 Switzerland 0.7 1.0 –34 Australia 21 Denmark 14 Spain 13 15 Australia 0.6 0.3 64 Canada 35 Chile 31 USA 13 16 Canada 0.5 0.6 –9.4 Saudi Arabia 49 UAE 22 USA 4.9 17 Ukraine 0.5 1.7 –70 China 48 Saudi Arabia 13 Thailand 7.5 18 UAE 0.4 0.4 –5.8 Egypt 28 Jordan 27 Algeria 15 19 Poland 0.4 0.1 168 Ukraine 95 Nepal 1.2 Ecuador 0.6 20 Belarus 0.3 0.5 –37 Serbia 33 Viet Nam 25 Uganda 14 21 South Africa 0.3 0.3 6.7 UAE 27 USA 21 India 15 22 Norway 0.3 0.6 –55 USA 27 Ukraine 15 Lithuania 14 23 Brazil 0.3 0.2 35 France 25 Nigeria 15 Chile 12 24 Belgium 0.2 0.1 212 Saudi Arabia 35 Canada 28 Pakistan 21 25 Jordan 0.2 0.2 14 USA 61 Egypt 26 Armenia 7.0 UAE = United Arab Emirates. a Figures show the change in volume of the total arms exports per exporter between the two periods. Source: SIPRI Arms Transfers Database, Mar. 2023.
  • 3. trends in international arms transfers, 2022 3 Figure 2. Global share of exports of major arms by the 10 largest exporters, 2018–22 Source: SIPRI Arms Transfers Database, Mar. 2023. Others 9.4% Israel 2.3% South Korea 2.4% Spain 2.6% United Kingdom 3.2% Italy 3.8% Germany 4.2% China 5.2% France 11% United States 40% Russia 16% Figure 3. Changes in volume of exports of major arms since 2013–17 by the 10 largest exporters in 2018–22 Source: SIPRI Arms Transfers Database, Mar. 2023. 14 –31 44 –23 –35 45 –35 –4.4 74 –15 Change in volume of arms exports (%) United States Russia France China Germany Italy United Kingdom Spain South Korea Israel –40 –30 –20 –10 0 10 20 30 40 50 60 70 80 The United States The USA’s arms exports grew by 14 per cent between 2013–17 and 2018–22 and its share of total global arms exports rose from 33 per cent to 40 per cent. The USA delivered major arms to 103 states in 2018–22, almost as many as the next two biggest exporters com­ bined. Its total arms exports in 2018–22 were 148 per cent higher than those of Russia—the second largest exporter—compared with 50 per cent higher in 2013–17. A total of 41 per cent of US arms exports went to the Middle East in 2018–22, down from 49 per cent in 2013–17. Partly related to its policies aimed at con­ tain­ ing Iranian influence, the USA exports large volumes of advanced major arms to states in the region. Four Middle Eastern states were among the top 10 importers of US arms in 2018–22: Saudi Arabia accounted for 19 per cent of US arms exports, Qatar for 6.7 per cent, Kuwait for 4.8 per cent and the United Arab Emirates (UAE) for 4.4 per cent. States in Asia and Oceania received 32 per cent of total US arms exports in 2018–22, roughly the same proportion as in 2013–17 (33 per cent). Three major US allies in the region were among the 10 largest importers of US arms in 2018–22: Japan accounted for 8.6 per cent of total US arms exports, Australia for 8.4 per cent and South Korea for 6.5 per cent. Taiwan was the 4th largest importer of US arms in 2013–17, but only the 19th largest in 2018–22. How­ ever, by the end of 2022, it had several large orders in place for major arms from the USA, includ­ing for 66 combat aircraft. A total of 23 per cent of US arms exports went to states in Europe in 2018–22, up from 11 per cent in 2013–17. Three of the USA’s North Atlantic
  • 4. 4 sipri fact sheet Treaty Organization (NATO) partners in the region were among the 10 largest importers of US arms in 2018–22: the UK accounted for 4.6 per cent of US arms exports, the Netherlands for 4.4 per cent and Norway for 4.2 per cent. ThevolumeofUSexportsofmajorarmstoUkraineincreasedsharplyin2022. Nevertheless, as the supplies to Ukraine involved relatively less advanced and mainly second-hand military equipment from US stocks, the level of US exports to Ukraine in 2022 was still below the levels sent to four other states that year—Kuwait, Saudi Arabia, Qatar and Japan—because they received advanced new weapons, such as combat aircraft and air defence systems. US arms exports to many NATO states rose between 2013–17 and 2018–22 as they rearmed due to growing tensions with Russia. However, the USA’s arms exports to its NATO ally Türkiye were at a low level in 2018–22 as a result of increasinglystrainedbilateralrelations.Türkiyewasthe27thlargestrecipient of US arms in 2018–22, down from 7th largest in 2013–17. The USA has many pending arms export deliveries (see box 1). In 2022 alone 13 states ordered a total of 376 combat aircraft and combat helicopters from the USA. The largest order that year came from Canada for 88 combat aircraft. Russia In 2018–22 Russia delivered major arms to 47 states and accounted for 16 per cent of total global arms exports. Russian arms exports remained stable between 2008–12 and 2013–17, but fell by 31 per cent between 2013–17 and 2018–22. The annual volumes of arms exports in 2018 and 2019 were at similar levels to or higher than those in each of the previous 20 years, but were at significantly lower levels in 2020, 2021 and 2022. Box 1. Selected major arms on order or preselected for future orders from the 10 largest arms exporters, for delivery after 2022 It is very difficult to make predictions about future trends in arms transfers. Nevertheless, data on orders and final negotiations of orders can give a rough indication of which states will be among the largest exporters in coming years. The data on combat aircraft and major warships, which have a notably high military value, is particularly telling. As the table below shows, the United States will almost certainly continue to be by far the largest exporter of major arms beyond 2022, especially as around 60 per cent of all combat aircraft currently on order will be supplied by the USA. Russia, which was the second largest arms exporter in the world in 2018–22, has a relatively low number of pending deliveries. United States Russia France China Germany Italy United Kingdom Spain South Korea Israel Combat aircrafta 1 371 84 210 94 – 115 20 – 136 18 Major warshipsb 5 5 21 22 29 9 26 2 6 – SAM systemsc 40 13 6 1 25 1 – – . . 26 Tanks 634 444 – 717 85 – 14 . . 990 19 Other armoured vehicles 2 658 55 552 – 1 389 1 703 2 608 23 69 Artillery 401 – 176 128 137 – 30 10 1 232 87 . . = data not available or not applicable; – nil or a negligible figure; SAM = surface-to-air missile. a Combat aircraft here include combat helicopters, combat/trainer aircraft and anti-submarine warfare aircraft. b Major warships here include aircraft carriers, corvettes, destroyers, frigates and submarines. c SAM systems here include only land-based systems and exclude systems for portable/very short-range SAMs. Source: SIPRI Arms Transfers Database, Mar. 2023.
  • 5. trends in international arms transfers, 2022 5 StatesinAsiaandOceaniareceived65percentoftotalRussianarmsexports in 2018–22, while Middle Eastern and African states received 17 per cent and 12 per cent respectively. Just under two thirds of Russian arms exports went to three states in 2018–22: India (31 per cent), China (23 per cent) and Egypt (9.3 per cent). India was also the largest recipi­ent of Russian arms in 2013–17, but exports to India decreased by 37 per cent between the two periods. In contrast, exports to China (+39 per cent) and Egypt (+44 per cent) increased within the same time frame. However, Russia made no deliveries to Egypt in 2021–22 and the volume of deliveries to China in 2020–22 was at a much lower level than in 2018–19. It is likely that order volumes from these two states will reduce in the coming years. Egypt, for example, cancelled a large orderforcombataircraftin2022,probablyduetopressurefromtheUSA,and China is becoming less reliant on Rus­ sian imports as it ramps up domestic production of advanced major arms. Exports to the other 7 of the 10 largest recipients of Russian arms in 2018–22 decreased, by 59 per cent on average. The low volume of pending deliveries of major arms from Russia (see box 1) indicates that its arms exports are likely to continue to drop in the coming years. Combat aircraft and combat helicopters have been among Russia’s main arms exports since 1992. It delivered a total of 328 of these in 2018–22, which accounted for 40 per cent of Russian arms exports in the period. However, by the end of 2022, it had pending deliveries for only 84 combat air­ craft and combat helicopters. Russia’s invasion of Ukraine will probably put additional constraints on Russia’s ability to export arms, as it is likely to prioritize the production of arms for its own military over those for export. The multilateral sanctions, including wide-ranging trade restrictions, imposed on Russia, coupled with pressure from the USA and its allies on states not to acquire Russian arms, will also hamper its efforts to export arms. France French arms exports accounted for 11 per cent of the global total in 2018–22 and were 44 per cent higher than in 2013–17. Most of France’s arms exports in 2018–22 went to states in Asia and Oceania (44 per cent) and the Middle East (34 per cent). It delivered major arms to 62 states in 2018–22, but the three largest recipients—India, Qatar and Egypt—together received 55 per cent of French arms exports in that period. With a 30 per cent share of exports, India was by far the largest recipient of French arms in 2018–22 (see below). The most notable French arms export agreement signed in 2022 was with Indonesia, for 42 combat aircraft. By the end of that year, France had far more major arms on order for export than Russia (see box 1). Other major exporters China accounted for 5.2 per cent of total global arms exports in 2018–22. Its arms exports decreased by 23 per cent between 2013–17 and 2018–22. The vast majority of Chinese arms exports (80 per cent) went to states in Asia and Oceania. China delivered major arms to 46 states in 2018–22, but over half of its arms exports (54 per cent) went to just one state—Pakistan. Arms exports by Germany made up 4.2 per cent of the global total in 2018–22. They were 35 per cent lower than in 2013–17. States in the Middle
  • 6. 6 sipri fact sheet Table 2. The 40 largest importers of major arms and their main suppliers, 2018–22 Percentages below 10 are rounded to 1 decimal place; percentages over 10 are rounded to whole numbers. Rank Importer Share of global arms imports (%) Per cent change from 2013–17 to 2018–22a Main suppliers and their share of importer’s total imports (%), 2018–22 2018–22 2013–17 1st 2nd 3rd 1 India 11 12 –11 Russia 45 France 29 USA 11 2 Saudi Arabia 9.6 10 –8.7 USA 78 France 6.4 Spain 4.9 3 Qatar 6.4 1.5 311 USA 42 France 29 Italy 14 4 Australia 4.7 3.6 23 USA 73 Spain 19 Switzerland 3.0 5 China 4.6 4.2 4.1 Russia 83 France 8.1 Ukraine 5.6 6 Egypt 4.5 4.5 –5.3 Russia 34 Italy 19 France 19 7 South Korea 3.7 2.2 61 USA 71 Germany 19 France 7.9 8 Pakistan 3.7 3.0 14 China 77 Sweden 5.1 Russia 3.6 9 Japan 3.5 1.2 171 USA 97 UK 1.9 Sweden 0.3 10 United States 2.7 2.0 31 UK 24 Netherlands 13 France 11 11 UAE 2.7 4.1 –38 USA 66 Türkiye 7.4 Russia 5.4 12 Kuwait 2.4 0.9 146 USA 78 Italy 10 France 9.0 13 United Kingdom 2.3 1.7 31 USA 81 South Korea 13 Israel 2.8 14 Ukraine 2.0 <0.05 8 631 USA 34 Poland 17 Germany 11 15 Norway 2.0 0.5 285 USA 86 South Korea 8.2 Italy 3.5 16 Israel 1.9 1.8 2.9 USA 79 Germany 20 Italy 0.2 17 Netherlands 1.9 0.4 307 USA 95 Germany 3.9 Finland 0.6 18 Algeria 1.8 4.1 –58 Russia 73 Germany 10 France 5.2 19 Türkiye 1.3 2.4 –49 Italy 35 Spain 20 Russia 19 20 Singapore 1.3 1.4 –14 France 52 USA 26 UK 7.6 21 Thailand 1.0 0.9 –1.1 South Korea 33 China 14 USA 10 22 Brazil 0.9 0.6 48 France 39 UK 14 Sweden 13 23 Philippines 0.9 0.5 64 South Korea 42 Israel 22 USA 15 24 Indonesia 0.9 2.7 –69 South Korea 32 USA 26 France 12 25 Bangladesh 0.9 1.6 –48 China 74 UK 5.8 Türkiye 4.5 26 Poland 0.9 0.5 64 USA 56 South Korea 17 Germany 6.5 27 Viet Nam 0.8 2.8 –72 Russia 55 Israel 16 Belarus 10 28 Italy 0.8 1.3 –41 USA 92 Israel 4.4 France 2.0 29 Morocco 0.8 1.1 –30 USA 76 France 15 China 6.8 30 Myanmar 0.8 0.8 –3.0 Russia 42 China 29 India 14 31 NATOb 0.7 <0.05 2 700 France 66 USA 18 UK 15 32 Afghanistan 0.7 0.8 –11 USA 96 Brazil 2.6 Belarus 1.4 33 Canada 0.7 1.1 –36 USA 32 Australia 27 Spain 15 34 Greece 0.7 0.9 –26 France 48 USA 29 UK 12 35 Kazakhstan 0.6 0.8 –22 Russia 94 China 2.6 South Africa 1.8 36 Belarus 0.6 0.3 55 Russia 100 China 0.1 . . . . 37 Serbia 0.5 0.1 743 China 43 Russia 31 Belarus 20 38 Chile 0.5 0.3 56 UK 38 Australia 36 USA 10 39 Jordan 0.5 0.8 –39 USA 40 UAE 20 Russia 17 40 Bahrain 0.5 0.1 380 USA 83 UK 7.0 Italy 4.1 . . = data not available or not applicable; NATO = North Atlantic Treaty Organization; UAE = United Arab Emirates. a Figures show the change in volume of the total arms imports per importer between the two periods. b The data is for imports by the organization itself, not the total imports by NATO member states. Source: SIPRI Arms Transfers Database, Mar. 2023.
  • 7. trends in international arms transfers, 2022 7 East received the largest share of total German arms exports in 2018–22 (36 per cent), followed by states in Asia and Oceania (32 per cent) and Europe (20 per cent). Italy accounted for 3.8 per cent of the world’s arms exports in 2018–22. Its arms exports were 45 per cent higher in 2018–22 than in 2013–17. Around two thirds (67 per cent) of Italian arms exports went to the Middle East. The 4 other suppliers making up the top 10 arms exporters in 2018–22 were the UK, Spain, South Korea and Israel. Arms exports by the UK (–35 per cent), Spain (–4.4 per cent) and Israel (–15 per cent) all decreased between 2013–17 and 2018–22. In contrast, arms exports by South Korea increased by 74 per cent, giving it a 2.4 per cent share of the global total. Most of its arms exports (63 per cent) went to states in Asia and Oceania butinternationaldemandforSouthKoreanarmsisgrowing,asdemonstrated, for example, by the large orders that Poland placed in 2022 (see below). THE IMPORTERS, 2018–22 SIPRI has identified 167 states as importers of major arms in 2018–22. The top five arms importers—India, Saudi Arabia, Qatar, Australia and China— received 36 per cent of total global arms imports in the period (see figure 4 and table 2). States in Asia and Oceania accounted for 41 per cent of all arms imports in 2018–22 (see figure 5), followed by the Middle East (31 per cent), Europe (16 per cent), the Americas (5.8 per cent) and Africa (5.0 per cent). Africa Imports of major arms by African states fell by 40 per cent between 2013–17 and 2018–22, which was mainly due to decreases in the arms imports of the two largest importers in the region, Algeria (–58 per cent) and Morocco (–30 per cent). The main suppliers to Africa in 2018–22 were Russia, account­ ing for 40 per cent of African imports of major arms, the USA (16 per cent), China (9.8 per cent) and France (7.6 per cent). Sub-Saharan Africa States in sub-Saharan Africa accounted for 2.0 per cent of total global imports of major arms in 2018–22. Their combined arms imports were 23 per cent lower than in 2013–17. The three largest arms importers in the sub­ region in 2018–22 were Angola, Nigeria and Mali. Others 45% United States 2.7% Japan 3.5% India 11% Saudi Arabia 9.6% Qatar 6.4% Australia 4.7% China 4.6% Egypt 4.5% South Korea 3.7% Pakistan 3.7% Figure 4. Global share of imports of major arms by the 10 largest importers, 2018–22 Source: SIPRI Arms Transfers Database, Mar. 2023.
  • 8. 8 sipri fact sheet Several arms-exporting states are competing for influence in sub-Saharan Africa. Russia over­ took China to become the largest sup­ plier to the subregion in 2018–22. Its share of arms imports to sub-Saharan Africa rose from 21 per cent in 2013–17 to 26 per cent in 2018–22, while China’s fell from 29 per cent to 18 per cent. France increased its share from 4.8 per cent to 8.3 per cent, making it the third largest arms supplier to sub-Saharan Africa in 2018–22. Arms import volumes vary signifi­ cantly over time for most states in sub-Saharan Africa and these states often have a diverse range of suppliers. For example, Mali’s imports increased by 210 per cent between 2013–17 and 2018–22. Russia was its main sup­ plier in both periods, but Mali also received major arms from Brazil, China, France, South Africa, Spain, Türkiye, the UAE and the USA. After the coups in Mali in 2020 and 2021, France and the USA became far more reluctant to supply it with arms. Russia, in contrast, increased its arms exports to Mali in 2021–22. The Americas Arms imports by states in the Americas decreased by 21 per cent between 2013–17 and 2018–22. The USA and Brazil were the largest importers of major arms in the region in 2018–22, accounting for 47 per cent and 16 per cent of the regional total respectively. Arms imports by South American states decreased by 34 per cent between 2013–17 and 2018–22. Despite the fact that there are few interstate tensions in South America, some states, including Brazil and Chile, have significant ongoing arms import programmes. Brazil’s arms imports were 48 per cent higher than in 2013–17 and accounted for 44 per cent of the subregional total in 2018–22. Chile’s arms imports rose by 56 per cent between the two periods, giving it a 24 per cent share of total South American arms imports. Asia and Oceania Arms imports by states in Asia and Oceania decreased by 7.5 per cent between 2013–17 and 2018–22. Six of the world’s 10 largest arms importers in 2018–22 were in Asia and Oceania: India, Australia, China, South Korea, Pakistan and Japan. The USA (31 per cent) accounted for the largest share of arms 2018–22 2013–17 0 25 50 75 100 125 150 Asia and Oceania, 42% Middle East, 32% Europe, 11% Americas, 7.0% Asia and Oceania, 41% Middle East, 31% Europe, 16% Americas, 5.8% Africa, 5.0% Africa, 8.0% Volume of arms transfers (billions of trend-indicator values) Figure 5. The importers of major arms, by region, 2018–22 and 2013–17, per cent of global share Note: The SIPRI trend-indicator value (TIV) is a measure of the volume of international transfers of major arms. The method used for the SIPRI TIV is described on the Arms Transfers Database web page. Source: SIPRI Arms Transfers Database, Mar. 2023.
  • 9. trends in international arms transfers, 2022 9 imports to states in the region, followed by Russia (26 per cent) and France (12 per cent). India and Pakistan India’s tensions with Pakistan and China largely drive its demand for arms imports. With an 11 per cent share of total global arms imports, India was the world’s biggest importer of major arms in 2018–22, a position it has held for the period 1993–2022. It retained this position even though its arms imports dropped by 11 per cent between 2013–17 and 2018–22. The decrease can be attributed to several factors including India’s slow and complex arms procurement process, efforts to diversify its arms suppliers, and attempts to replace imports with major arms that are designed and produced domestically. Russia was the largest supplier of arms to India in both 2013–17 and 2018–22, but its share of total Indian arms imports fell from 64 per cent to 45 per cent. Russia’s position as India’s main arms supplier is under pressure due to strong competition from other supplier states, increased Indian arms production and, since 2022, the above-mentioned constraints on Russia’s arms exports related to its invasion of Ukraine. India’s arms imports from France, which included 62 combat aircraft and 4 submarines, increased by 489 per cent between 2013–17 and 2018–22. France therefore displaced the USA to become the second largest supplier to India in 2018–22. Arms imports by Pakistan increased by 14 per cent between 2013–17 and 2018–22 and accounted for 3.7 per cent of the global total. China supplied over three quarters (77 per cent) of Pakistan’s arms imports in 2018–22. East Asia, Oceania and South East Asia Arms imports by states in East Asia (+21 per cent) and Oceania (+25 per cent) increased between 2013–17 and 2018–22, while those by states in South East Asia (–42 per cent) decreased. China’s arms imports grew by 4.1 per cent and accounted for 4.6 per cent of the global total in 2018–22. The vast majority of Chinese arms imports (83 per cent) came from Russia. Russian deliveries in the last three years of the period (2020–22) consisted almost entirely of helicopters and engines for aircraft, which are the last few types of major arms that China has had difficulties in developing. Both Japan (+171 per cent) and South Korea (+61 per cent) increased their arms imports between 2013–17 and 2018–22. The USA is a treaty ally of both states and has been their largest arms supplier since 1950. Japan and South Korea are expanding their military capabilities in a move that is largely driven by tensions with North Korea and, in the case of Japan, with China. Both Japan and South Korea have well-developed arms industries, but they remain reliant on arms imports in some key categories, especially long-range strike capabilities such as advanced combat aircraft and missiles. The USA delivered 40 combat aircraft to South Korea in 2018–22, which accounted for 43 per cent of South Korean arms imports in the period. It also delivered 29 combat aircraft to Japan, amounting to one third (33 per cent) of Japan­ese arms imports. Both countries have pending deliveries of combat aircraft from
  • 10. 10 sipri fact sheet the USA, and Japan ordered long-range land-attack missiles from the USA in 2022. Australia, by far the largest arms importer in Oceania, is another key ally of the USA and is also building up its long-range strike capabilities based on a perceived heightened threat from China. Australia increased its arms imports by 23 per cent between 2013–17 and 2018–22. With a 4.7 per cent share of total global arms imports, it was the fourth largest arms importer in the world in 2018–22. The delivery of 64 combat aircraft from the USA accounted for 62 per cent of Australian arms imports in the period. Although most South East Asian states continued to be affected by tensions in the South China Sea, mainly with China, arms imports by states in the subregion fell by 42 per cent between 2013–17 and 2018–22. The decrease is at least partly because many arms-importing states are still in the process of incorporating equipment delivered before 2018 into their armed forces. Nevertheless, states in the subregion are continuing to build up their military capabilities. The Philippines, for example, increased its arms imports by 64 per cent between 2013–17 and 2018–22, and Singapore expects to take delivery of 4 submarines from Germany within the next few years. During the period 2018–22, Indonesia placed orders for 42 combat aircraft from France, doubling its current inventory, as well as for 3 submarines from South Korea and for 6 frigates from Italy and 2 from the UK. Europe Arms imports by European states were 47 per cent higher in 2018–22 than in 2013–17. The biggest European arms importer in 2018–22 was the UK, which was the 13th largest arms importer in the world, followed by Ukraine (see box 2) and Norway, ranking 14th and 15th respectively. The USA accounted for 56 per cent of the region’s arms imports in 2018–22, Russia for 5.8 per cent (mainly to Belarus) and Germany for 5.1 per cent. Box 2. The war in Ukraine as a driver of arms transfers in 2022 Ukraine imported very few major arms in the period from its independence in 1991 until the end of 2021. This changed after the Russian invasion of Ukraine in February 2022, as the United States and many European states began to send large quantities of military aid to Ukraine. As a result, it became the 3rd largest importer of major arms in 2022, after Qatar and India, and the 14th largest for the five-year period 2018–22, accounting for 2.0 per cent of total global arms imports. Of the 29 states that supplied major arms to Ukraine in 2022, the main suppliers were the USA, which accounted for 35 per cent of total Ukrainian arms imports during the year, Poland (17 per cent), Germany (11 per cent), the United Kingdom (10 per cent) and Czechia (4.4 per cent). Many of the arms supplied in 2022 were second-hand items from existing stocks, including 228 artillery pieces and an estimated 5000 guided artil­ lery rockets from the USA, 280 tanks from Poland and over 7000 anti-tank missiles from the UK. Some newly produced arms were also supplied, such as air defence systems from Germany, Poland, the UK and the USA. In many cases, the supply of arms by one state was financed by other states or by the European Union (EU) through the European Peace Facility. For example, by the end of 2022, the EU had made €3.1 billion available for military equipment for Ukraine. Ukraine did not receive all the types of arms it asked its supporters to provide and, at different stages during 2022, there was divergence between states about what they were willing to supply. For example, while Poland and Czechia delivered tanks to Ukraine in the first half of 2022, Germany, the UK and the USA decided to do so only in late 2022 or early 2023. Despite a growing willingness among states to send a wider variety of arms to Ukraine, as of the end of 2022, suppliers were still not prepared to deliver arms with a long-range strike capability, such as combat aircraft and long-range land-attack missiles. The arms supplies to Ukraine in 2022 were vital for the Ukrainian effort to halt the Russian offensive. Russia, in contrast, relied almost exclusively on domestically produced arms—although it did import uncrewed aerial vehicles (UAVs) and flying bombs from Iran in 2022.
  • 11. trends in international arms transfers, 2022 11 European NATO states Largely in response to the deteriorating security environment in the region, NATO states in Europe increased their arms imports by 65 per cent between 2013–17and2018–22.TheUSAaccountedfor65percentoftotalarmsimports by Euro­ pean NATO states and the NATO organization itself (see table 2) in 2018–22. The next biggest suppliers were France (8.6 per cent) and South Korea(4.9percent).ThearmsimportsofEuropeanNATOstatesareexpected to continue to rise in the coming years, based on existing programmes for arms imports. These include orders placed before the February 2022 Rus­sian invasion of Ukraine and several large orders announced afterwards. Some of the orders placed in 2022 were the result of accelerated pro­ cure­ ment pro­ cesses implemented in response to the war in Ukraine. For example, in the first four years of the period (2018–21), Poland’s most notable arms import orders included 32 combat aircraft and 4 missile and air defence systems from the USA; however, in 2022 Poland announced new orders for 394 tanks, 96 combat helicopters and 12 missile and air defence systems from the USA; 48 combat aircraft, 1000 tanks, 672 self-propelled guns and 288 multiple rocket launchers from South Korea; and 3 frigates from the UK. After an accelerated procurement process, Germany ordered 35 combat aircraft from the USA in late 2022. These are specifically for carrying nuclear weapons owned by the USA and will replace existing aircraft that have this task. The Middle East Arms imports by states in the Middle East were 8.8 per cent lower in 2018–22 than in 2013–17. Three of the top 10 arms-importing states in 2018–22 were in the Middle East: Saudi Arabia, Qatar and Egypt. The USA accounted for 54 per cent of Middle Eastern arms imports. The next largest suppliers were France (12 per cent), Russia (8.6 per cent) and Italy (8.4 per cent). The Gulf region Against the backdrop of various tensions in the region, arms transfers con­ tinued to play a major role in security developments in the Gulf in 2018–22. Saudi Arabia was the world’s second largest arms importer in 2018–22 and received 9.6 per cent of all arms imports. The USA supplied 78 per cent of Saudi Arabian arms imports in the period, which included the deliv­ ery of 91 combat aircraft with hundreds of land-attack missiles and over 20 000 guided bombs. Qatar became the third largest arms importer in the world as its arms imports increased by 311 per cent between 2013–17 and 2018–22. Its main suppliers in 2018–22 were the USA, which accounted for 42 per cent of Qatari arms imports, France (29 per cent) and Italy (14 per cent). Qatar’s arms imports in 2018–22 included 36 combat aircraft from France, 36 from the USA and 8 from the UK, as well as 3 frigates from Italy. The UAE’s arms imports in 2018–22 were 38 per cent lower than in 2013–17, and it was the 11th largest arms importer globally. Notable arms imports in 2018–22 included hundreds of air defence missiles and over 20 000 guided bombs from the USA.
  • 12. SIPRI is an independent international institute dedicated to research into conflict, armaments, arms control and disarmament. Established in 1966, SIPRI provides data, analysis and recommendations, based on open sources, to policymakers, researchers, media and the interested public. GOVERNING BOARD Stefan Löfven, Chair (Sweden) Dr Mohamed Ibn Chambas (Ghana) Ambassador Chan Heng Chee (Singapore) Jean-Marie Guéhenno (France) Dr Radha Kumar (India) Dr Patricia Lewis (Ireland/ United Kingdom) Dr Jessica Tuchman Mathews (United States) Dr Feodor Voitolovsky (Russia) DIRECTOR Dan Smith (United Kingdom) © SIPRI 2023 Signalistgatan 9 SE-169 72 Solna, Sweden Telephone: +46 8 655 97 00 Email: sipri@sipri.org Internet: www.sipri.org ABOUT THE AUTHORS Pieter D. Wezeman (Netherlands/Sweden) is a Senior Researcher with SIPRI’s Arms Transfers Programme. Justine Gadon (France) is a Research Assistant with SIPRI’s Military Expenditure and Arms Production Programme. Siemon T. Wezeman (Netherlands) is a Senior Researcher with SIPRI’s Arms Transfers Programme. About SIPRI’s data on arms transfers SIPRI’s statistical data on arms transfers relates to actual deliveries of major arms, as defined by SIPRI. SIPRI measures the volume of international transfers of major arms using a common unit—the trend-indicator value (TIV). The methodology for the SIPRI TIV is described on the Arms Transfers Database web page. As the volume of deliveries can fluctuate significantly year-on-year, SIPRI presents data for five-year periods, giving a more stable measure of trends. Percentage shares presented in this SIPRI Fact Sheet do not always add up to 100 per cent or to stated totals because of the conventions of rounding. TheSIPRIArmsTransfersDatabase,accessibleontheSIPRIwebsite,istheonlypublic resource that provides consistent information, often estimates, on all international transfers of major arms (including sales, gifts and production under licence) to states, international organizations and non-state groups since 1950. The database aims to contribute to an understanding of the effects of arms flows on peace, stability and violent conflict. This fact sheet is intended to encourage the use of the database for further research, investigations, policymaking and public debate. Kuwait’s arms imports increased by 146 per cent between 2013–17 and 2018–22, mainly due to the delivery of 28 combat aircraft and 218 tanks from the USA and 6 combat aircraft from Italy. Iran’s arms imports have been at a very low level relative to those of other arms importers in the Gulf region since around 1993. Its imports of major arms in 2018–22 were close to zero. In 2022 Iran placed an order for 24 combat aircraft from Russia, its first significant procurement of combat aircraft since the early 1990s. By the end of 2022, Saudi Arabia had 41 combat aircraft on order from the USA, while Qatar had 22 on order from the USA and 16 from the UK, the UAE had 80 on order from France, and Kuwait had 22 on order from Italy. Arms imports and naval build-ups in the eastern Mediterranean Amid ongoing maritime disputes in the eastern Mediterranean, several states in the region continued to increase their naval capabilities in 2018–22. For example, Egypt received four submarines and the first of four frigates on order from Germany; two of three frigates on order from France; and two frigates from Italy. In 2022 Israel received the first two of four frigates on orderfromGermany.IsraelistoreceiveonesubmarinefromGermanyin2023 and placed an order for three more in 2022. Greece ordered three frigates from France in 2022. Türkiye is able to produce most types of warships, but has six submarines on order from Germany for delivery in 2023–27 and an amphibious assault ship on order from Spain for delivery in 2023.