2. Mar Ecol Prog Ser 423: 83–93, 2011
material from cage culture are discharged into the
surrounding waters as soluble inorganic matter or
particulate organic matter (POM), deteriorating water
quality, reducing dissolved oxygen (DO) levels, in-
creasing sedimentation and turbidity, and changing
the abundance and composition of microbial commu-
nities in the water (Wu et al. 1994, La Rosa et al. 2002,
Paerl et al. 2003, Garren et al. 2008). As a conse-
quence, long-term waste inputs can modify sediment
physicochemical characteristics, increase the severity
of marine diseases, affect coral–larval settlement and
recruitment, and cause shifts in benthic assemblages
(Brown et al. 1987, Weston, 1990, Bruno et al. 2003,
Gao et al. 2005, Villanueva et al. 2006; reviewed in
Loya 2007, Holmer et al. 2008). Degradation of coral
reefs caused by eutrophication might also cause shifts
in the dominant coral communities. In summary,
nutrient enrichment stimulates macroalgal over-
growth enabling macroalgae to rapidly cover and
smother living coral (Lapointe 1997, Costa et al. 2008).
Furthermore, overgrowth of benthic filter feeders,
such as bryozoans, sponges, and zoanthids, may out-
compete corals for substrata, which results in a
decrease in both diversity and abundance of hard
corals and ultimately a phase shift from corals to
macroalgae (Done 1992, McCook 1999). Macroalgal
overgrowth of coral reefs is associated with a ‘top–
down’ mechanism, in a similar way as is overfishing,
that leads to a reduction in herbivory pressures and
‘bottom–up’ processes such as nutrient enrichment
and sedimentation, which result in eutrophication
(Jackson et al. 2001, Koop et al. 2001). Because
overfishing is seriously affecting the ‘top–down’
mechanism globally, many studies emphasized the
bottom–up process of macroalgal overgrowth due to
extra nutrient supplies (Lapointe 1997, Jackson et al.
2001, Costa et al. 2008). In recent years, some studies
reported that nutrient enrichment and particulate
matter derived from fish farms enhanced the growth
and reproductive potential of adjacent hard corals
(Bongiorni et al. 2003a,b, Shafir et al. 2006, Amar &
Rinkevich 2007, Shaish et al. 2008). This finding chal-
lenges the traditional concept that eutrophication is
generally harmful to coral reefs, and has led to
debates on the effects of fish farms on adjacent coral
reefs in the Gulf of Eilat, Red Sea (Loya & Kramarsky-
Winter 2003, Rinkevich et al. 2003, Wielgus 2003,
Loya et al. 2004, Abelson et al. 2005, Rinkevich
2005a,b, Loya 2007). Therefore, the role of deteriorat-
ing water quality on corals is controversial, and the
physiological and experimental support for reef
declines caused by elevated nutrients remains unclear
(Koop et al. 2001, Szmant 2002; referred to in Fabri-
cius 2005). Marine cage culture has developed and
expanded in Taiwan due to the over-harvesting of
natural populations and increasing demands for food
resources over the past 2 decades. In particular,
extensive development of marine cage culture in the
Penghu Islands (the Pescadores) was encouraged by
the government in semi-enclosed embayments, such
as Magongwan, where subtropical coral communities
were once abundant (Chen 1999, Hsieh et al. 2001,
2007) and flourished in the turbid waters (Hu et al.
1986). However, few studies have discussed the
effects of nutrients and particulate matter from marine
cage culture on coral and benthic communities in tur-
bid waters. Due to a lack of a long-term monitoring
program at Magongwan and based on information
from local fisheries units that claim that macroalgal
overgrowth only appeared after these fish cages were
installed, we sought to address the putative influences
of marine cage culture. Hence, this study was de-
signed to determine the correspondence between the
composition of benthic communities (including hard
corals, macroalgae, and sponges/zoanthids) and envi-
ronmental parameters in 2006–2007 at Magongwan.
The aims of this study were (1) to determine potential
environmental parameters responsible for possible
marine environmental deterioration caused by marine
cage culture, (2) to study the species compositions of
benthic organism communities at Magongwan, (3) to
disclose possible statistical relationships between these
environmental parameters and benthic communities,
and (4) to investigate the possibility of the deterio-
ration of suitable habitats for coral reef organisms
via benthic stress-tolerant organisms due to chronic
effluent inputs.
MATERIALS AND METHODS
Study site. This study was conducted at Magongwan
(23° 32’ N, 119° 33–36’ E), a semi-enclosed embayment
located in the south inner sea of the main island of
Penghu (Fig. 1a), in the Taiwan Strait. Magongwan is
surrounded by abundant subtropical coral communi-
ties, no river or industrial discharges are present, and
the current, <10 cm s–1
, flows in a predominantly west-
to-east direction (measured in 2005). Marine cage cul-
ture at Magongwan has been in operation since the
beginning of the 1990s and covers ~15 ha, with a maxi-
mum water depth of ~20 m. The cage culture consists
of traditional raft net cages constructed of Styrofoam,
which helps the cages float in the water and reduces
damage from typhoons and strong monsoon winds.
The cultivated species mainly include carnivorous fish
such as cobia and grouper, and the mean fish yield
over the past 4 yr (2005 to 2008) varied at 1400 to 2000 t
yr–1
. Along the southern shoreline of Magongwan, 3
zones were selected for a benthic community survey
84
3. Huang et al.: Marine cage culture effects on coral communities
and bottom-water sample collection: (1) Impact Zone 1
at Tiesianwei (TSW) located 10 m from the cages,
(2) Impact Zone 2 at Shamaoushan (SM) located at a
distance of 800 m from the cages, and (3) a reference
zone at Shertoushan (ST) located at the mouth of the
embayment, ~4.5 km away from TSW (Fig. 1b). In each
zone, surveys and sampling were done at depths of 3
and 6 m.
Environmental parameters. Total suspended solids
(TSS), particulate organic matter (POM), ammonium,
nitrate, nitrite, phosphate, dissolved oxygen (DO),
chlorophyll (chl) a, and the sedimentation rate were
examined as environmental parameters in this study.
These parameters were determined by sampling bot-
tom water at the 2 depths in each zone 5 times in
August and November 2006, and May, August, and
December 2007. Triplicate water samples were taken
at each site during every field sampling time. TSS were
determined by filtering 1 l of seawater through pre-
weighed GF/C glass microfiber filters (0.45 µm; What-
man) using a vacuum pump. Solids collected on the fil-
ters were washed twice to remove salts, then dried at
70°C until a constant weight was achieved, and
weighed. Then the filters were ignited in a furnace at
450°C for 4 h to combust the organic matter contained
in the solids. The resultant inorganic particulates on
the filter were weighed and used as the POM content.
A flow injection analyzer (FIA) and spectrophotometer
(Hitachi U-3000) were used to determine concentra-
tions of ammonia, nitrate, nitrite, and phosphate in the
water samples (Meng et al. 2008). The DO concen-
trations were measured with a multiparameter moni-
toring instrument (YSI 600XLM; average of 3 readings
at each sampling). Phytoplankton chl a was deter-
mined with a spectrophotometric method by filtering
water samples through a Whatman GF/C glass micro-
fiber and extraction in 90% aqueous acetone for 24 h at
4°C in the dark. The sedimentation rate was measured
using PVC cylindrical sediment traps (6 cm in diameter
and 16 cm in depth, mounted on a metal base) that
were deployed in each zone over a period of ~2 d to
cover a complete tidal cycle. The opening of the trap
was at ~30 to 40 cm above the sea bottom. After col-
lecting the traps, sediment in each trap was rinsed with
distilled water to remove salts, filtered through a
preweighed Whatman GF/C glass microfiber filter
using a vacuum pump, and weighed.
Benthic community survey. The coverage of benthic
organisms was surveyed using a belt transect (30 ×
0.25 m) at 2 depths (3 and 6 m) in the 3 zones in August
2006. A series of photographic images was taken along
a 30 m line using a 25 × 25 cm PVC quadrate with a
PVC rod that was fixed to an underwater digital cam-
era housing. Six replicate transects were randomly
placed at each depth site. Coverage of each replicate
transect was analyzed using 24 photographic images
chosen by simple random sampling. Coverage extents
of 3 categories of benthic organisms including macro-
algae, sponges/zoanthids, and coral in the images
were determined using the Coral Point Count with
Excel extensions (CPCe; v3.5) software (Kohler &
Shaun 2006), with 50 random points overlaid on each
photographic image. Corals were identified to species
level.
Composition of coral communities and conser-
vation values. The conservation value (Edinger &
Risk 2000) was used to evaluate and compare condi-
tions of reef coral communities at the 6 surveyed sites
(2 depths × 3 zones) at Magongwan. The proportion of
coral species with different categories of colony mor-
85
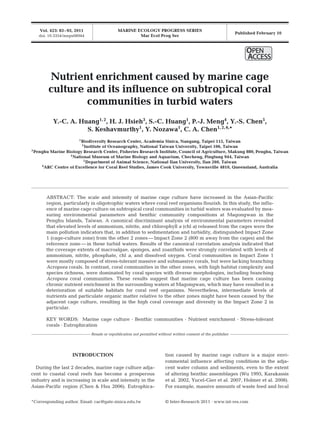
Fig. 1. (a) Penghu Islands. (b) Magong Island, southern coast.
Sampled sites (d): Tiesianwei (TSW) = Impact Zone 1 (IZ1),
Shamaoushan (SM) = Impact Zone 2 (IZ2), and Shertoushan
(ST = reference zone). Hatched boxes: cage-culture areas
4. Mar Ecol Prog Ser 423: 83–93, 2011
phologies representing r, K, and S strategists were
recorded based on the classification system proposed
by Edinger & Risk (2000). Each group represents its
own unique ecological characteristics: r comprises
weed-like ruderals, K represents competitors, and S
consists of stress-tolerators. The composition of each
coral community was then plotted on an r-K-S ternary
diagram, and its position in a conservation class (CC)
was determined. Among conservation classes, CC1
represents coral communities dominated by stress-
tolerators (S; mainly massive and submassive corals),
CC2 represents coral communities dominated by
competitors (K; mainly foliose and branching non-
Acropora corals), CC3 represents coral communities
dominated by ruderals (r; mainly branching and tabu-
lar Acropora), and CC4 represents coral communities
with mixed coral morphologies or functional groups.
Reefs with the highest conservation value (CC4) repre-
sent optimum communities for conservation. Reefs
with moderate conservation values (CC2 and CC3) are
also appropriate areas for conservation, while those
with a lower conservation value (CC1) indicate exten-
sive reef degradation and are not suitable for conser-
vation (Edinger & Risk 2000).
Statistical analysis. A 2-way analysis of variance
(ANOVA) followed by Fisher’s least significant differ-
ence (LSD) test was used to determine differences in
coverage of benthic organisms (corals, macroalgae,
and sponges/zoanthids) between the 2 depths (3 and
6 m) and among the 3 zones (TSW, SM, and ST). Nor-
mality and homogeneity of variance were tested using
a Kolmorogov–Smirnov test and Bartlett’s test. In
this study, a canonical discriminant analysis (CDA) was
used to distinguish the 6 sampling sites and determine
the discrimination power of the environmental para-
meters. CDA determines how a set of quantitative vari-
ables can differentiate among many known classes
and yields linear functions of quantitative variables
that maximally separate 2 or more groups of individu-
als while minimizing variations within groups. It also
allows relationships among groups to be graphically
represented by plotting the discriminant scores of
sample observations (Shrestha & Kazama, 2007). Be-
cause environmental parameters have various units,
the CDA was applied to the data that had been
standardized by z-scale transformation to prevent
misclassification. Relationships between the coverage
of benthic organisms and environmental parameters
were determined using a canonical correlation analy-
sis (CCA). The CCA was computed using square root-
transformed values in order to minimize differences in
variance produced by differences in the absolute size
and to adjust for nonhomogeneity of variance among
variables. All statistical analyses were done using
SPSS 12.0 for Windows.
RESULTS
Environmental parameters
Data of the environmental parameters are summa-
rized in Table 1. Ranges of nutrient concentrations
(µM) at Magongwan were 0.05–0.71 for phosphate,
0.70–4.32 for nitrate, 0.03–0.40 for nitrite, and
0.33–5.63 for ammonium. Maximum values of nutri-
ents were generally observed in Impact Zones 1 and 2,
while minimum concentrations were measured in the
reference zone. Although nutrient concentrations fluc-
tuated during the sampling period, results of 1-way
ANOVA indicated that levels of ammonium, nitrate,
and phosphate in Impact Zone 1 were significantly
higher than those of the other reef zones (p < 0.05).
Further, DO values ranged from 4.15 to 9.54 mg l–1
in
the impact zones, and 6.01 to 10.03 mg l–1
in the refer-
ence zone. Particular in Impact Zone 1, the lowest val-
ues were detected when compared with others zones
(1-way ANOVA, p < 0.05). The sedimentation rate at
Magongwan strongly fluctuated between 5.86 and
84.12 g m–2
d–1
, and represented the results that there
was no significant difference between these sampled
zones (1-way ANOVA, p = 0.17). The discriminant
potencies of environmental parameters in 2006 and
2007 in the CDA are shown in Fig. 2. Canonical corre-
lation coefficients were 0.86 (p < 0.01) for the first
canonical discriminant function (CDF1) and 0.56 (p <
0.05) for CDF2 (Table 2). The CDF1 explained 81.09%
of the variance and discriminated Impact Zone 1 from
the other zones, while CDF2 explained 12.45% of the
variance and efficiently separated the 2 depths of
Impact Zone 1. These 2 CDFs together explained
93.54% of the variance in the 6 sampled zones. The
CDF1 had the highest canonical correlation coefficient
(0.86), because it was defined by the 4 discriminant
variables of chl a, DO, ammonium, and nitrite, the
canonical coefficients of which had high absolute val-
ues (Table 2). Moreover, the canonical structure coeffi-
cients in CDF1 indicated that the variance of variables
with the highest discriminant power were nutrients
(nitrite, phosphate, and ammonium) and chl a. At
Magongwan, nutrients (ammonium and nitrite) can be
used to distinguish these 6 sampled reef zones and
explained 81.09% of the total variance of environmen-
tal parameters compared to other physical factors, such
as suspended solids and the sedimentation rate.
Coverage of benthic organism communities
Coverage extents of reef corals, macroalgae, and
sponges/zoanthids in 2006 are shown in Fig. 3. Results
of a 2-way ANOVA showed that there were significant
86
5. Huang et al.: Marine cage culture effects on coral communities
differences in coral coverage among the 3 zones (F =
23.62, p < 0.01) and 2 depths (F = 30.01, p < 0.01)
(Table 3). The highest coral coverage extent at
Magongwan was in Impact Zone 2 followed by Impact
Zone 1, and was lowest in the reference zone, while
the coverage extent at 3 m was higher than that at 6 m.
Mean values of macroalgal coverage in Impact Zone 1
were 59.4% (3 m) and 61.1% (6 m), and were signifi-
cantly higher than those in the other zones (F = 98.21,
p < 0.01, 2-way ANOVA) (Table 3). Moreover, macro-
algal coverage significantly differed by depth (F =
12.96, p < 0.01, 2-way ANOVA). The coverage extent
of sponges/zoanthids in Impact Zone 1 (3.19 ± 0.99% at
3 m and 4.52 ± 0.78% at 6 m) was significantly higher
than those in the other zones (<1.00%) (F = 29.16, p <
0.01, 2-way ANOVA). No significant difference was
detected in coverage extent between depths (F = 0.40,
p = 0.53, 2-way ANOVA) (Table 3).
Composition of coral communities and
conservation values
In total, 35 species in 24 genera from 13 families of
reef coral species were identified at Magongwan in
87
Table 1. Environmental parameters (range and mean ± SE; n = 15) for the 3 sampled reef zones at Magongwan (Impact Zone 1 =
Tiesianwei, TSW; Impact Zone 2 = Shamaoushan, SM; Reference zone = Shertoushan, ST) in 2006–2007, at 2 depths (3 and 6 m)
Environmental Impact Zone 1 (TSW) Impact Zone 2 (SM) Reference zone (ST)
parameter 3 m 6 m 3 m 6 m 3 m 6 m
NH4-N (µM)
Range 1.27–5.15 0.48–5.63 0.90–2.22 0.33–2.52 0.45–2.31 0.42–2.59
Mean ± SE 2.70 ± 0.36 2.66 ± 0.49 1.49 ± 0.12 1.32 ± 0.18 1.26 ± 0.16 1.10 ± 0.19
NO3-N (µM)
Range 0.88–3.48 1.10–3.63 0.86–6.03 0.70–3.69 1.10–3.33 0.92–4.32
Mean ± SE 1.85 ± 0.20 1.86 ± 0.24 2.47 ± 050 2.02 ± 0.28 1.80 ± 0.19 1.99 ± 0.31
NO2-N (µM)
Range 0.07–0.40 0.10–0.39 0.04–0.19 0.05–0.29 0.05–0.12 0.03–0.12
Mean ± SE 0.18 ± 0.03 0.20 ± 0.02 0.09 ± 0.01 0.09 ± 0.02 0.06 ± 0.01 0.07± 0.01
PO4-P (µM)
Range 0.06–0.71 0.07–0.60 0.05–0.30 0.05–0.32 0.05–0.12 0.05–0.18
Mean ± SE 0.29 ± 0.06 0.32 ± 0.06 0.16 ± 0.02 0.16 ± 0.02 0.08 ± 0.01 0.10 ± 0.01
Suspended solids (mg l–1
)
Range 10.55–30.45 11.56–30.31 9.19–27.64 9.96–28.26 9.79–27.11 11.58–28.65
Mean ± SE 21.94 ± 1.67 22.58 ± 1.52 18.48 ± 1.89 20.21 ± 1.94 19.04 ± 1.63 19.90 ± 1.63
Organic matter (mg l–1
)
Range 2.85–9.47 2.81–9.41 2.24–9.10 3.01–8.45 2.33–8.54 2.72–10.31
Mean ± SE 6.38 ± 0.56 6.30 ± 0.53 5.05 ± 0.58 5.43 ± 0.46 5.23 ± 0.51 5.61 ± 0.60
Chlorophyll a (µg l–1
)
Range 1.03–2.81 0.94–2.37 0.90–2.48 0.90–2.49 0.73–1.66 0.87–1.92
Mean ± SE 1.75 ± 014 1.74 ± 0.11 1.46 ± 0.14 1.60 ± 0.15 1.00 ± 0.07 1.37 ± 0.09
Dissolved oxygen (mg l–1
)
Range 4.32–8.79 4.15–8.92 5.79–9.54 5.71–9.43 6.17–10.03 6.01–9.66
Mean ± SE 6.56 ± 0.41 6.45 ± 0.43 7.44 ± 0.34 7.34 ± 0.35 7.80 ± 0.35 7.87 ± 0.34
Sedimentation rate (g m–2
d–1
)
Range 7.26–30.34 13.88–60.79 5.86–64.78 6.37–62.52 9.55–79.13 15.02–84.12
Mean ± SE 17.49 ± 1.99 39.62 ± 3.71 26.97 ± 5.68 35.03 ± 6.14 30.61 ± 5.98 48.16 ± 6.42
Fig. 2. Canonical discriminant analysis (CDA) of environmental
parameters for the 3 sampled zones at Magongwan from Au-
gust 2006 to December 2007. Impact Zone 1 = Tiesianwei
(TSW; black). Impact Zone 2 = Shamaoushan (SM; gray), Refer-
ence zone = Shertoushan (ST; white). Transects at depths: 3 m
(circles), 6 m (triangles). Data points: location + depth
6. Mar Ecol Prog Ser 423: 83–93, 2011
this study. Coral coverage of the 5 top-ranked species
in Impact Zone 2 accounted for >59.5% of all live coral
cover, and those in the other 2 zones accounted for
>81% of live coral cover (Table 4). Based on the mor-
phological categories of the r-K-S ternary diagram, the
5 dominant coral species were Montipora cactus (K;
K-strategist), Euphyllia paraancora (S; S-strategist),
Goniopora columna (S), Lithophyllon undulatum (K),
and Platygyra sinensis (S) in Impact Zone 1. Coral com-
munities at both 3 and 6 m in Impact Zone 1 lacked
branching Acropora corals (r; r-strategist) and were
mostly composed of stress tolerators (>60% of all cov-
erage); hence, their positions on the r-K-S ternary dia-
gram were assigned to CC1 (Fig. 4). Because of the
variety of coral morphologies and functional groups,
such as branching Acropora corals, the massive coral,
G. columna (S), the encrusting coral, L. undulatum (K),
and large monospecific stands of the foliose corals,
Pavona decussata (K) and Turbinaria mesenterina (K),
coral communities in Impact Zone 2 (3 and 6 m) were
assigned to CC4. Coral communities in the reference
zone (3 and 6 m) were assigned to CC3 due to a high
coverage of branching Acropora corals (>56.1% of all
coverage), such as A. muricata, A. valida, and Pocillo-
pora damicornis.
Canonical correlations between the coverage of
benthic organism communities and environmental
parameters
The CCA of benthic organism communities and
environmental parameters revealed one significant set
(F = 1.85, p < 0.05) of canonical variates, with a canon-
ical correlation coefficient of 0.86, which together
explained 81.35% of the total variation of the data. The
coefficients of correlation between the
original variable and the canonical
variate are shown in Table 5. The first
canonical variate of the benthic organ-
ism communities mainly represented
the macroalgae and sponges/zoan-
thids, and the canonical variate of envi-
ronmental parameters mainly repre-
sented nutrients (nitrite, phosphate,
and ammonium), chl a, and DO. These
findings helped narrow the relation-
ship between benthic organism com-
munities and environmental parame-
ters to a lower number of variables, and
indicated the coverage of macroalgae
and sponges/zoanthids was positively
related to nutrients, chl a, and DO.
DISCUSSION
Nutrient enrichment of the water
During the survey period, mean concentrations of
nitrogenous nutrients in the impact zones were signifi-
cantly higher, and their phosphate concentrations
(0.16–0.32 µm) were on average 2- to 4-fold higher
than the average in the reference zone. Moreover,
results of the CDA also showed that nutrients (ammo-
nium, nitrite, and phosphate) were the main para-
meters significantly distinguishing Impact Zone 1 from
the other zones. This finding is similar to those from
previous studies. Villanueva et al. (2005) showed
higher levels of ammonium (almost 7.00 µM) and phos-
phate (almost 0.85 µM) in coral-reef waters around a
fish farm in the Philippines, and La Rosa et al. (2002)
also found that concentrations of phosphate at a fish
farm site in the Tyrrhenian Sea (in the western
Mediterranean) were up to 6-fold higher than that of
the control.
Theoretically, the environmental impacts of marine
cage culture depend on the feed types and hydro-
graphy of the site (Wu 1995). High levels of ammonia
in the water are detrimental to marine organisms and
can be derived from the decomposition of nitrogenous
compounds, such as aquafeed (Wu et al. 1994). In the
Asian-Pacific region, low-priced trash fish with high
nitrogenous contents are commonly used as feed in
fish farming. Trash fish used as aquafeed sometimes
induce environmental risks due to high decomposition
rates that contribute to an overload of organic matter
(Chen & Hsu 2006, Xu et al. 2007). Nevertheless, water
quality in semi-closed embayments is mainly influ-
enced by local hydrologic conditions, including tidal
flushing, water residence times, and tidal-driven water
88
Table 2. Outcomes of total standardized canonical coefficients (TSCC) and total
canonical structure coefficients (TCSC) between canonical discriminant func-
tions (CDF1 and CDF2) and discriminant variables (environmental parameters)
at Magongwan in 2006–2007. Relatively high absolute values are given in bold
Discriminant CDF1 CDF2
variable TSCC TCSC TSCC TCSC
NH4-N (µM) 0.57 0.35 –1.07 –0.20
NO3-N (µM) –0.02 –0.02 0.15 0.10
NO2-N (µM) 0.50 0.47 –0.71 –0.04
PO4-P (µM) –0.03 0.40 1.62 0.03
Suspended solids (mg l–1
) –0.41 0.11 –0.09 0.03
Organic matter (mg l–1
) 0.30 0.12 –0.26 –0.02
Chlorophyll a (µg l–1
) 1.08 0.30 0.70 0.34
Dissolved oxygen (mg l–1
) –0.93 –0.23 –0.07 0.02
Sedimentation rate (g m–2
d–1
) –0.37 –0.12 0.88 0.52
Canonical correlation coefficient 0.86 0.56
Eigenvalues 2.86 0.44
Cumulative variance explained 0.81 0.94
7. Huang et al.: Marine cage culture effects on coral communities
currents (Grall & Chauvaud 2002, Mayor et al. 2010).
Piriou & Menesguen (1992) revealed that strong cur-
rents usually prevent eutrophication by flushing nutri-
ents out of an ecosystem. Wu et al. (1994) observed a
decrease in the DO and an increase in nutrient concen-
trations at a fish farm in Hong Kong with poor tidal
flushing, a low current velocity (<2 cm s–1
), and a high
stocking density. At Magongwan, elevated levels of
nutrients, TSS, and organic matter were also detected
in the impact zones (1 and 2) where the current veloc-
ity was <10 cm s–1
, suggesting that trash fish used as
aquafeed could affect the water quality, and hydro-
logic conditions might not easily flush excessive nutri-
ents out of Magongwan.
Overgrowth of macroalgae and
benthic filter feeders
Results of this study showed that nutrient enrich-
ment at Magongwan stimulated macroalgal over-
growth and increased primary production in the water.
Concentrations of dissolved inorganic nitrogen (DIN;
4.73 µm; including ammonium, nitrite, and nitrate) and
phosphate in the impact zones were all above nutrient
thresholds noted for macroalgal overgrowth (1.0 µm
DIN and <0.1 µm soluble reactive phosphorus) as
demonstrated by Lapointe (1997). Macroalgae and
phytoplankton can rapidly assimilate the higher
amounts of available nutrients and are adapted to
high-nutrient, eutrophic waters, and macroalgal cover
was shown to decrease after sewage dilution (Done
1992; referred to in Fabricius 2005). Moreover, Mc-
Cook (1999) expressed the concern that degradation of
inshore coral reefs of the Great Barrier Reef (GBR),
caused by terrestrial input of sediment and nutrients,
was always accompanied by abundant macroalgae.
Therefore, it is evident that macroalgal abundance
increased with extra nutrient supplies in the culture
zone, and thus that the nutrient enrichment and macro-
algal overgrowth at Magongwan represent warning
signs that the environment is undergoing degradation.
Fabricius (2005) stated that the consequences of nutri-
ent enrichment of coral reefs not only cause macro-
algal overgrowth, but also increase densities of benthic
89
Macroalgae
Coverage(%)
10
20
30
50
60
70
0
40
3 m
6 m
Impact Zone 1 Reference zoneImpact Zone 2
Site
Sponges and zoanthids
Coral
5
10
20
25
35
40
0
15
30
1
2
3
4
5
6
0
Fig. 3. Coverage + SE (n = 6) of coral, macroalgae (including
turf algae on dead corals), and sponges/zoanthids along 6
random photographic transects at 2 depths (3 and 6 m) in
Magongwan in August 2006
Table 3. Results of 2-way ANOVA of the coverage of coral, macroalgae, and sponges/zoanthids at Magongwan. *p < 0.05, **p <
0.01, ns: non-significant
Source of variation Coral Macroalgae Sponges and zoanthids
df MS F p df MS F p df MS F p
Zone 1 711.246 23.623 ** 1 5435.323 98.204 ** 1 50.624 29.159 **
Depth 2 903.644 30.013 ** 2 717.097 12.956 ** 2 0.695 0.400 ns
Zone × Depth 2 253.516 8.420 ** 2 523.646 9.461 ** 2 2.767 1.594 ns
8. Mar Ecol Prog Ser 423: 83–93, 2011
filter feeders, such as sponges, bivalves, ascidians,
bryozoans, and barnacles. Because excessive nutrients
enhance the phytoplankton biomass, primary produc-
tivity, and turbidity in the water, these benthic filter
feeders quickly grow and pullulate by taking up sur-
plus organic matter and particles from turbid waters
(Pastorok & Bilyard 1985). In this study, sponges and
zoanthids were flourishing in Impact Zone 1 (with
90
Table 4. Coverage (%) and morphological categories of the 5 top-ranked coral species at Impact Zones 1 (Tiesianwei, TSW) and
2 (Shamaoushan, SM), and the reference zone (Shertoushan, ST) in Magongwan, at 2 depths (3 and 6 m). Coral morphological
categories are identified as r-K-S coral groups (r: ruderals; K: competitors; S: stress-tolerators)
Impact Zone 1 (TSW) Impact Zone 2 (SM) Reference zone (ST)
Species (r-K-S group) Coral cover (%) Species (r-K-S group) Coral cover (%) Species (r-K-S group) Coral cover (%)
3 m
Montipora cactus (K) 5.89 ± 1.12 Acropora muricata (r) 6.85 ± 3.07 Montipora cactus (K) 5.27 ± 1.16
Goniopora columna (S) 4.63 ± 1.11 Pavona decussata (K) 4.76 ± 1.82 Acropora muricata (r) 5.24 ± 1.26
Platygyra sinensis (S) 2.43 ± 0.87 Acropora humilis (r) 4.00 ± 1.40 Porites lutea (S) 3.00 ± 0.98
Galaxea fascicularis (S) 1.33 ± 0.61 Goniopora columna (S) 3.67 ± 1.02 Acropora valida (r) 2.09 ± 0.95
Pavona decussata (K) 0.96 ± 0.41 Montipora cactus (K) 1.80 ± 0.74 Pavona decussata (K) 1.69 ± 0.61
% of total coral species 83.06 % of total coral species 67.00 % of total coral species 81.46
6 m
Euphyllia paraancora (S) 5.13 ± 1.65 Acropora muricata (r) 3.68 ± 1.19 Porites lutea (S) 1.83 ± 0.45
Lithophyllon undulatum (K) 3.03 ± 1.03 Pavona decussata (K) 3.14 ± 0.62 Acropora valida (r) 2.74 ± 0.30
Goniopora columna (S) 2.57 ± 0.57 Lithophyllon undulatum (K) 2.88 ± 0.56 Montipora cactus K) 1.06 ± 0.03
Turbinaria mesenterina (K) 1.60 ± 0.34 Acropora humilis (r) 1.79 ± 0.59 Pocillopora damicornis (r) 1.04 ± 0.02
Echinophyllia aspera (K) 1.58 ± 0.64 Turbinaria mesenterina (K) 1.66 ± 0.66 Acropora muricata (r) 1.03 ± 0.01
% of total coral species 80.98 % of total coral species 59.45 % of total coral species 100.00
K (competitors)
r (ruderals) S (stress-tolerators)
10/90
20/80
30/70
40/60
50/50
60/40
70/30
80/20
90/10 90/10
80/20
70/30
60/40
50/50
40/60
30/70
20/80
10/90
10/90 20/80 90/1080/2070/3060/4050/5040/6030/70
TSW6m
TSW3m
SM6m
SM3m
ST6m
ST3m
Class 1Class 3
Class 4
Class 2
Fig. 4. All study sites plotted on an r-K-S ternary diagram (n = 6), and the conservation classes in the Penghu Islands. Impact
Zones 1 and 2: TSW (black) and SM (gray), respectively; Reference zone: ST (white). Depths: 3 m (triangles), 6 m (circles). See
Fig. 2 for definitions
9. Huang et al.: Marine cage culture effects on coral communities
>3.19% coverage) that possessed high levels of
nutrients, chl a, TSS, and organic matter. These
consequences of effluents released from the cages may
support the overgrowth of benthic filter feeders at
Magongwan.
Composition of coral communities
at Magongwan
Well-developed coral communities are character-
ized by both high coral coverage and biodiversity
(Hsieh et al. 2001, 2007, Cooper et al. 2009), but coral
coverage alone is not sufficient. Recently, ternary dia-
grams of the conservation class (CC) to classify coral
morphology categories (r-K-S) were recognized as a
more-reliable predictor of reef conditions, habitat
complexity, and species richness than was live coral
coverage (Edinger & Risk 2000, Hsieh et al. 2007). In
this study, coral coverage in Impact Zone 1 (18.36% at
3 m and 17.17% at 6 m) did not statistically differ from
those of Impact Zone 2 (22.11% at 6 m) or the refer-
ence site (21.23% at 3 m), but results of the 5 top-
ranked coral species (>59% of all) at Magongwan
showed that the composition of coral communities in
Impact Zone 1 completely differed from the other
zones. Because marine cage culture and other related
activities are the main pollution source at Magong-
wan, and Rogers (1990) and Stafford-Smith & Ormond
(1992) revealed that coral community compositions
might have been affected by nutrient enrichment,
sedimentation, and turbidity, the 6 surveyed sites
were generally classified into 2 main community types
by the dominant coral morphology categories: (1)
Impact Zone 1, mainly composed of Euphyllia spp.,
Platygyra spp., Goniopora spp., and Lithophyllon spp.
and (2) the other zones, mainly composed of diverse
coral species and dominant branching Acropora
corals, such as A. muricata, A. humilis, and A. valida
and the foliose coral, Pavona sp. The r-K-S ternary
diagrams also classified Impact Zone 1 in the low level
(CC1) due to a lack of live branching Acropora corals
and domination by S-strategist corals, such as massive
and submassive corals. Hence, the results of the r-K-S
ternary diagrams imply that coral communities in
Impact Zone 1 are under threat of marine eutrophica-
tion. Those in Impact Zone 2 (3 and 6 m), which is
800 m from the cages, were estimated to have a high
conservation value (CC4) due to the dominance of
branching Acropora and other tabular coral communi-
ties, and diverse morphologies of coral species. Partic-
ularly, Impact Zone 2 at 3 m had the highest coverage
(31.45 ± 1.75%) and species number (26 species), and
concentrations of nutrients, POM, and chl a ranged
between those of Impact Zone 1 and the reference
zone. Although nutrient enrichment may stress nearby
coral reefs, the outcome of nutrient enrichment actu-
ally depends on the chemical forms and concentra-
tions of the nutrients (Ferrier-Pagès et al. 2000). More-
over, corals not only can and do flourish in relatively
high-nutrient waters (Atkinson et al. 1995), but they
may also grow and reproduce faster and have even
exhibited high survivorship under the influence of fish
farm effluents (Bongiorni et al. 2003a,b, Shahir et al.
2006, Amar & Rinkevich 2007, Shaish et al. 2008). In
turbid and low-light waters, corals demonstrate the
capacity to exploit nutrient sources by shifting from
autotrophy to heterotrophy (Anthony 1999a,b, 2000,
Anthony & Fabricius 2000) and use the extra POM
and sediments as additional food sources (Rosenfeld
et al. 1999, Anthony & Fabricius 2000, Bongiorni et al.
2003a). Those reports support coral communities in
Impact Zone 2 flourishing in the turbid water at
Magongwan. Elevated levels of nutrients in reefs are
always accompanied by an increase in benthic filter
feeder and macroalgae abundance, and the compe-
tition among corals, macroalgae, and benthic filter
feeders may lead to a dominance shift in communities
(Costa et al. 2008). During the survey period, abun-
dant large-scale broken fragments of dead branching
Acropora corals covered by turf algae were observed
in Impact Zone 1 (authors’ pers. obs.). Furthermore,
the Penghu Islands are under the threat of overfish-
ing and reduction in grazing pressure by herbivo-
rous organisms (Dai et al. 2002). It is possible that
chronic nutrient enrichment caused by cage culture
at Magongwan has influenced the overgrowth of
macroalgal and benthic filter feeder communities,
which might have affected some branching Acropora
corals.
91
Table 5. Canonical structures of the first set of original vari-
ables (3 benthic organism communities and 9 environmental
parameters) and their canonical variates. Relatively high val-
ues are given in bold
Original variable Canonical variate
Benthic organism communities
Coral (%) 0.13
Macroalgae (%) 0.80
Sponges and zoanthids (%) 0.87
Environmental parameters
NH4-N (µM) 0.58
NO3-N (µM) –0.05
NO2-N (µM) 0.76
PO4-P (µM) 0.61
Suspended solids (mg l–1
) 0.23
Organic matter (mg l–1
) 0.25
Chlorophyll a (µg l–1
) 0.44
Dissolved oxygen (mg l–1
) 0.50
Sedimentation rate (g m–2
d–1
) –0.14
10. Mar Ecol Prog Ser 423: 83–93, 2011
Overall impacts of marine cage culture on coral
communities of the Penghu Islands
Our study provides preliminary results suggesting
that nutrient enrichment was likely caused by cage
culture during the survey period (2006 to 2007),
although this result could alternatively have been
influenced by the environmental conditions of past
years, for which we lack data. We investigated the idea
that eutrophication by cage culture effluents may have
altered suitable habitats for coral reef organisms of this
region, and local hydrology and feed type could also
have influenced our findings. Subtropical coral com-
munities in the Penghu Islands may be more influ-
enced by nutrient enrichment than turbidity and sedi-
mentation. Consequently, this study suggests that
chronic nutrient enrichment caused by marine cage
culture might have negative implications for the sur-
rounding waters, influencing interactions between
macroalgae and corals. The most effective ways to
minimize the risk of environmental degradation are to
restrict the expansion of culture sites, remove cage cul-
ture, or allow areas to remain fallow (Loya 2007). It is
hoped that these suggestions will provide insights for
local governments to develop appropriate conserva-
tion management strategies, and for fishery authorities
and aquaculture planning agencies to maintain a func-
tional marine environment.
Acknowledgements. We thank the Penghu County Marine
Life Proliferation Center and Penghu Marine Biological
Research Center, a facility of the Taiwan Fishery Research
Institute, for logistical support throughout the field studies in
Penghu, and members of the Coral Reef Evolutionary Ecology
and Genetics (CREEG) laboratory, Biodiversity Research
Center, Academia Sinica (BRCAS), 4 anonymous referees,
and Dr. P. Edmunds for constructive comments. C.A.C. is the
recipient of the Australian Endeavour Award and National
Science Council (NSC)-Australian Academy of Science Fel-
lowship. Y.A.H. is the recipient of a NSC PhD fellowship
(2006–2008), and K.S. is the recipient of a post-doctoral fel-
lowship (2008–2010) NSC, Taiwan. This study was made pos-
sible by grants from Academia Sinica and the NSC (NSC 95-
2313-B-001-022-MY3), Taiwan to C.A.C. This is the CREEG-
BRCAS contribution no. 62.
LITERATURE CITED
Abelson A, Olinky R, Gaines S (2005) Coral recruitment to the
reefs of Eliat, Red Sea: temporal and spatial, and possible
effects of anthropogenic disturbances. Mar Pollut Bull 50:
576–582
Amar KO, Rinkevich B (2007) A floating mid-water coral nurs-
ery as larval dispersion hub: testing an idea. Mar Biol
151:713–718
Anthony KRN (1999a) Coral suspension feeding on fine par-
ticulate matter. J Exp Mar Biol Ecol 232:85–106
Anthony KRN (1999b) A tank system for studying benthic
aquatic organisms at predictable levels of turbidity and
sedimentation: case study examining coral growth. Limnol
Oceanogr 44:1415–1422
Anthony KRN (2000) Enhanced particle-feeding capacity of
corals on turbid reefs (Great Barrier Reef, Australia). Coral
Reefs 19:59–67
Anthony KRN, Fabricius KE (2000) Shifting roles of heterotro-
phy and autotrophy in coral energetics under varying tur-
bidity. J Exp Mar Biol Ecol 252:221–253
Atkinson MJ, Carlson B, Crow GL (1995) Coral growth in
high-nutrient, low pH seawater: a case study of corals cul-
tured at the Waikiki Aquarium, Honolulu, Hawaii. Coral
Reefs 14:215–223
Bongiorni L, Shafir S, Angel D, Rinkevich B (2003a) Survival,
growth and gonad development of two hermatypic corals
subjected to in situ fish-farm nutrient enrichment. Mar
Ecol Prog Ser 253:137–144
Bongiorni L, Shafir S, Rinkevich B (2003b) Effects of particu-
late matter released by a fish farm (Eilat, Red Sea) on sur-
vival and growth of Stylophora pistillata coral nubbins.
Mar Pollut Bull 46:1120–1124
Brown JR, Gowen RJ, McLusky DS (1987) The effect of
salmon farming on the benthos of a Scottish sea loch.
J Exp Mar Biol Ecol 109:39–51
Bruno JF, Petes LE, Harvell CD, Hettinger A (2003) Nutrient
enrichment can increase the severity of coral diseases.
Ecol Lett 6:1056–1061
Chen CA (1999) Analysis of scleractinian distribution in Tai-
wan indicating a pattern congruent with sea surface tem-
peratures and current: examples from Acropora and Favi-
idae corals. Zool Stud 38:119–129
Chen YS, Hsu CY (2006) Ecological considerations of cage
aquaculture in Taiwan. J Fish Soc Taiwan 33:139–146
Cooper TF, Gilmour JP, Fabricius KE (2009) Bioindicators of
changes in water quality on coral reefs: review and recom-
mendations for monitoring programmes. Coral Reefs 28:
589–606
Costa OS Jr, Nimmo M, Attrill MJ (2008) Coastal nutrification
in Brazil: a review of the role of nutrient excess on coral
reef demise. J S Am Earth Sci 25:257–270
Dai CF, Soong KY, Chen CA, Huang JS, Fan TY, Hsieh HY,
Chang JS (2002) The status of coral reefs in Taiwan and
the conservation problems. Proc IUCN/WCPA-EA-4
Taipei Conf, March 18–23, Taipei, p 266–276
Done TJ (1992) Phase shifts in coral reef communities and
their ecological significance. Hydrobiologia 247:121–132
Edinger EN, Risk MJ (2000) Reef classification by coral mor-
phology predicts coral reef conservation value. Biol Con-
serv 92:1–13
Fabricius KE (2005) Effects of terrestrial runoff on the ecology
of corals and coral reefs: review and synthesis. Mar Pollut
Bull 50:125–146
Ferrier-Pagès C, Guttuso JP, Dallot S, Jaubert J (2000) Effect
of nutrient enrichment on growth and photosynthesis of
the zooxanthellate coral Stylophora pistillata. Coral Reefs
19:103–113
Gao QF, Cheung KL, Cheung SG, Shin PKS (2005) Effects of
nutrient enrichment derived from fish farming activities
on macroinvertebrate assemblages in a subtropical region
of Hong Kong. Mar Pollut Bull 51:994–1002
Garren M, Smriga S, Azam F (2008) Gradients of coastal fish
farm effluents and their effect on coral reef microbes.
Environ Microbiol 10:2299–2312
Grall J, Chauvaud L (2002) Marine eutrophication and ben-
thos: the need for new approaches and concepts. Glob
Change Biol 8:813–830
Holmer M, Argyrou M, Dalsgaard T, Danovaro R and others
(2008) Effects of fish farm waste on Posidonia oceanica
92
®
®
®
®
®®
®
®®
®
®
®
®
®
®
®®
®
®®
®
®®
11. Huang et al.: Marine cage culture effects on coral communities
meadows: synthesis and provision of monitoring and man-
agement tools. Mar Pollut Bull 56:1618–1629
Hsieh HJ, Lu YI, Tsai WS, Wei NV, Jeng MS, Chen CA (2001)
Unexpectedly high coral coverage in Chinwan Inner Bay,
Pescadores: a proposed site for a marine protection area.
Coral Reefs 20:316–317
Hsieh HJ, Chen CA, Dai CF, Ou WS, Tsai WS, Su WC (2007)
From the drawing board to the field: an example for estab-
lishing an MPA in Penghu, Taiwan. Aquat Conserv: Mar
Freshw Ecosyst 17:619–635
Hu HH, Liu CY, Tsai WS (1986) Report of marine culture in
Penghu, Taiwan. Fishery Research Institute, Makong
Jackson JBC, Kirby MX, Wolfgang HB, Bjorndal KA and oth-
ers (2001) Historical overfishing and the recent collapse of
coastal ecosystems. Science 293:629–637
Karakassis I, Tsapakis M, Smith CJ, Rumohr H (2002) Fish
farming impacts in the Mediterranean studied through
sediment profile imagery. Mar Ecol Prog Ser 227:125–133
Kohler KE, Gill SM (2006) Point Count with Excel extensions
(CPCe): a Visual Basic program for the determination of
coral and substrate coverage using random point count
methodology. Comput Geosci 32:1259–1269
Koop K, Booth D, Broadbent A, Brodie J, and others (2001)
ENCORE: the effect of nutrient enrichment on coral reefs:
synthesis of results and conclusions. Mar Pollut Bull 42:
91–120
La Rosa T, Mirto S, Favaloro E, Savona B, Sarà G, Danovaro R,
Mazzola A (2002) Impact on the water column biogeo-
chemistry of a Mediterranean mussel and fish farm. Water
Res 36:713–721
Lapointe BE (1997) Nutrient thresholds for eutrophication and
macroalgal overgrowth of coral reefs in Jamaica and
southeast Florida. Limnol Oceanogr 42:1119–1131
Loya Y (2007) How to influence environmental decision mak-
ers? The case of Eilat (Red Sea) coral reefs. J Exp Mar Biol
Ecol 344:35–53
Loya Y, Kramarsky-Winter E (2003) In situ eutrophication
caused by fish farms in the northern Gulf of Eilat (Aqaba)
is beneficial for its coral reefs: a critique. Mar Ecol Prog
Ser 261:299–303
Loya Y, Lubinevsky H, Rosenfeld M, Kramarsky-Winter E
(2004) Nutrient enrichment caused by in situ fish farms at
Eilat, Red Sea is detrimental to coral reproduction. Mar
Pollut Bull 49:344–353
Mayor DJ, Zuur AF, Solan M, Paton GI, Killham K (2010) Fac-
tors affecting benthic impacts at Scottish fish farms. Envi-
ron Sci Technol 44:2079–2084
McCook LK (1999) Macroalgae, nutrients and phase shift on
coral reefs: scientific issues and management conse-
quences for the Great Barrier Reef. Coral Reefs 18:
357–367
Meng PJ, Lee HJ, Wang JT, Chen CC, Lin HJ, Tew KS, Hsieh
WJ (2008) A long-term survey on anthropogenic impacts
to the water quality of coral reefs, southern Taiwan. Envi-
ron Pollut 156:67–75
Paerl HW, Dyble J, Moisander PH, Noble RT and others
(2003) Microbial indicators of aquatic ecosystem change:
current applications to eutrophication studies. FEMS
Microbiol Ecol 46:233–246
Pastorok RA, Bilyard GR (1985) Effects of sewage pollution on
coral-reef communities. Mar Ecol Prog Ser 21:175–189
Piriou JY, Menesguen A (1992) Environmental factors con-
trolling the Ulva sp. blooms in Brittany (France). In:
Colombo G, Ferrari I, Ceccherelli VU, Rossi R (eds)
Marine eutrophication and population dynamics. Proc
25th Eur Mar Bio Symp. Olsen & Olsen, Fredensburg,
p 111–116
Rinkevich B (2005a) Nutrient enrichment and coral reproduc-
tion: between truth and repose (a critique of Loya et al.).
Mar Pollut Bull 50:111–113
Rinkevich B (2005b) What do we know about Eilat (Red Sea)
reef degradation? A critical examination of the published
literature. J Exp Mar Biol Ecol 327:183–200
Rinkevich B, Angel D, Shafir S, Bongiorni L (2003) Fair is foul
and foul is fair: response to a critique. Mar Ecol Prog Ser
261:305–309
Rogers CS (1990) Responses of coral reefs and organisms to
sedimentation. Mar Ecol Prog Ser 62:185–202
Rosenfeld M, Bresler V, Abelson A (1999) Sediment as a pos-
sible source of food for corals. Ecol Lett 2:345–348
Shafir S, Rijn VJ, Rinkevich B (2006) Steps in the construction
of underwater coral nursery, an essential component in
reef restoration acts. Mar Biol 149:679–687
Shaish L, Levy G, Gomez E, Rinkevich B (2008) Fixed and sus-
pended coral nurseries in the Philippines: establishing the
first step in the ‘gardening concept’ of reef restoration.
J Exp Mar Biol Ecol 358:86–97
Shrestha S, Kazama F (2007) Assessment of surface water
quality using multivariate statistical techniques: a case
study of the Fuji River basin, Japan. Environ Model Softw
22:464–475
Stafford-Smith MG, Ormond RFG (1992) Sediment-rejection
mechanisms of 42 species of Australian scleractinian
corals. Aust J Mar Freshw Res 43:683–705
Szmant AM (2002) Nutrient enrichment on coral reefs: Is it a
major cause of coral reef decline? Estuaries 25:743–766
Villanueva RD, Yap HT, Montano MNE (2005) Survivorship of
coral juveniles in a fish farm environment. Mar Pollut Bull
51:580–589
Villanueva RD, Yap HT, Montano MNE (2006) Intensive
fish farming in the Philippines is detrimental to the reef-
building coral Pocillopora damicornis. Mar Ecol Prog Ser
316:165–174
Weston DP (1990) Quantitative examination of macrobenthic
community changes along an organic enrichment gradi-
ent. Mar Ecol Prog Ser 61:233–244
Wielgus J (2003) The coral reef of Eilat (northern Red Sea)
requires immediate protection. Mar Ecol Prog Ser 263:307
Wu RSS (1995) The environmental impact of marine fish cul-
ture: towards a sustainable future. Mar Pollut Bull 31:
159–166
Wu RSS, Lam KS, MacKay DW, Lau TC, Yam V (1994) Impact
of marine fish farming on water quality and bottom sedi-
ment: a case study in the sub-tropical environment. Mar
Environ Res 38:115–145
Xu Z, Lin X, Lin Q, Yang Y, Wang Y (2007) Nitrogen,
phosphorus, and energy waste outputs of four marine
cage-cultured fish fed with trash fish. Aquaculture 263:
130–141
Yucel-Gier G, Kucuksezgin F, Kocak F (2007) Effects of fish
farming on nutrients and benthic community structure in
the eastern Aegean (Turkey). Aquacult Res 38:256–267
93
Editorial responsibility: Peter Edmunds,
Northridge, California, USA
Submitted: March 15, 2010; Accepted: November 17, 2010
Proofs received from author(s): January 31, 2011
®
®
®®
®
®
®®
®
®
®
®®
®
®
®®
®®
®
®®
®
®
®
®
®
®
®
®
®®
®
®
®
®
®
®
®