SlideShare una empresa de Scribd logo
1 de 5
SanDisk Corporation
           Preliminary Condensed Consolidated Statements of Operations
                (in thousands, except per share amounts, unaudited)


                                                                  Three months ended
                                                         March 29, 2009       March 30, 2008*
Revenues:
 Product                                                 $      588,099          $        724,051
 License and royalty                                             71,372                   125,916
Total revenues                                                  659,471                   849,967

Cost of product revenues                                        657,478                   576,604
Amortization of acquisition-related intangible assets             3,132                    14,582
Total cost of product revenues                                  660,610                   591,186
Gross profit (loss)                                              (1,139)                  258,781

Operating expenses:
 Research and development                                        86,936                   111,434
 Sales and marketing                                             37,878                    80,156
 General and administrative                                      38,325                    57,804
 Amortization of acquisition-related intangible assets              292                     4,475
 Restructuring and other                                            765                         -
Total operating expenses                                        164,196                   253,869
Operating income (loss)                                        (165,335)                    4,912
Other income/(expense)                                          (18,693)                   13,885
Income (loss) before provision for income taxes                (184,028)                   18,797
Provision for income taxes                                       23,967                     7,837
Net income (loss)                                        $     (207,995)         $         10,960

Net income (loss) per share:
   Basic                                                 $         (0.92)        $           0.05
   Diluted                                               $         (0.92)        $           0.05

Shares used in computing net income (loss) per share:
   Basic                                                        226,529                   224,518
   Diluted                                                      226,529                   229,480


* As adjusted for the adoption of FSP APB 14-1, Accounting for Convertible Debt Instruments That
May Be Settled in Cash upon Conversion (Including Partial Cash Settlement), on December 29, 2008.
SanDisk Corporation
                                                                                                        (1)
                   Reconciliation of Preliminary GAAP to Non-GAAP Operating Results
                               (in thousands, except per share data, unaudited)

                                                                                           Three months ended
                                                                                  March 29, 2009       March 30, 2008*

SUMMARY RECONCILIATION OF NET INCOME (LOSS)
GAAP NET INCOME (LOSS)                                                            $      (207,995)         $         10,960
  Share-based compensation (a)                                                             16,330                    23,226
  Amortization of acquisition-related intangible assets (b)                                 3,424                    19,057
  Convertible debt interest (c)                                                            12,926                    11,997
  Income tax adjustments (d)                                                               66,852                   (17,454)
NON-GAAP NET INCOME (LOSS)                                                        $      (108,463)         $         47,786

GAAP COST OF PRODUCT REVENUES                                                     $       660,610          $        591,186
 Share-based compensation (a)                                                              (2,374)                   (3,629)
 Amortization of acquisition-related intangible assets (b)                                 (3,132)                  (14,582)
NON-GAAP COST OF PRODUCT REVENUES                                                 $       655,104          $        572,975

GAAP GROSS PROFIT (LOSS)                                                          $        (1,139)         $        258,781
 Share-based compensation (a)                                                               2,374                     3,629
 Amortization of acquisition-related intangible assets (b)                                  3,132                    14,582
NON-GAAP GROSS PROFIT                                                             $         4,367          $        276,992

GAAP RESEARCH AND DEVELOPMENT EXPENSES                                            $        86,936          $        111,434
 Share-based compensation (a)                                                              (6,152)                   (8,826)
NON-GAAP RESEARCH AND DEVELOPMENT EXPENSES                                        $        80,784          $        102,608

GAAP SALES AND MARKETING EXPENSES                                                 $        37,878          $         80,156
 Share-based compensation (a)                                                              (2,349)                   (3,511)
NON-GAAP SALES AND MARKETING EXPENSES                                             $        35,529          $         76,645

GAAP GENERAL AND ADMINISTRATIVE EXPENSES                                          $        38,325          $         57,804
 Share-based compensation (a)                                                              (5,455)                   (7,260)
NON-GAAP GENERAL AND ADMINISTRATIVE EXPENSES                                      $        32,870          $         50,544

GAAP TOTAL OPERATING EXPENSES                                                     $       164,196          $        253,869
 Share-based compensation (a)                                                             (13,956)                  (19,597)
 Amortization of acquisition-related intangible assets (b)                                   (292)                   (4,475)
NON-GAAP TOTAL OPERATING EXPENSES                                                 $       149,948          $        229,797

GAAP OPERATING INCOME (LOSS)                                                      $      (165,335)         $          4,912
 Cost of product revenues adjustments (a) (b)                                               5,506                    18,211
 Operating expense adjustments (a) (b)                                                     14,248                    24,072
NON-GAAP OPERATING INCOME (LOSS)                                                  $      (145,581)         $         47,195

GAAP OTHER INCOME (EXPENSE)                                                       $       (18,693)         $         13,885
 Convertible debt interest (c)                                                             12,926                    11,997
NON-GAAP OTHER INCOME (EXPENSE)                                                   $        (5,767)         $         25,882

GAAP NET INCOME (LOSS)                                                            $      (207,995)         $         10,960
 Cost of product revenues adjustments (a) (b)                                               5,506                    18,211
 Operating expense adjustments (a) (b)                                                     14,248                    24,072
 Convertible debt interest (c)                                                             12,926                    11,997
 Income tax adjustments (d)                                                                66,852                   (17,454)
NON-GAAP NET INCOME (LOSS)                                                        $      (108,463)         $         47,786

Diluted net income (loss) per share:
 GAAP                                                                             $          (0.92)        $           0.05
 Non-GAAP                                                                         $          (0.48)        $           0.21

Shares used in computing diluted net income (loss) per share:
 GAAP                                                                                     226,529                   229,480
 Non-GAAP                                                                                 226,529                   229,383


* As adjusted for the adoption of FSP APB 14-1, Accounting for Convertible Debt Instruments That May Be Settled in Cash upon
Conversion (Including Partial Cash Settlement), on December 29, 2008.
SanDisk Corporation
  Reconciliation of Preliminary GAAP to Non-GAAP Operating Results (1)

(1) To supplement our condensed consolidated financial statements presented in
    accordance with generally accepted accounting principles (GAAP), we use non-
    GAAP measures of operating results, net income (loss) and net income (loss) per
    share, which are adjusted from results based on GAAP to exclude certain expenses,
    gains and losses. These non-GAAP financial measures are provided to enhance the
    user's overall understanding of our current financial performance and our prospects
    for the future. Specifically, we believe the non-GAAP results provide useful
    information to both management and investors as these non-GAAP results exclude
    certain expenses, gains and losses that we believe are not indicative of our core
    operating results and because it is consistent with the financial models and estimates
    published by many analysts who follow the Company. For example, because the
    non-GAAP results exclude the expenses we recorded for share-based compensation in
    accordance with SFAS 123(R), the amortization of acquisition-related intangible
    assets related to acquisitions of Matrix Semiconductor, Inc. in January 2006,
    msystems Ltd. in November 2006 and MusicGremlin, Inc. in June 2008, we believe
    the inclusion of non-GAAP financial measures provide consistency in our financial
    reporting. These non-GAAP results are some of the primary indicators management
    uses for assessing our performance, allocating resources and planning and forecasting
    future periods. Further, management uses non-GAAP information that excludes
    certain non-cash charges, such as amortization of purchased intangible assets and
    share-based compensation, as these non-GAAP charges do not reflect the cash
    operating results of the business or the ongoing results. These measures should be
    considered in addition to results prepared in accordance with GAAP, but should not
    be considered a substitute for or superior to GAAP results. These non-GAAP
    measures may be different than the non-GAAP measures used by other companies.

(a) Share-based compensation expense.
(b) Amortization of acquisition-related intangible assets, primarily core and developed
    technology, related to the acquisitions of Matrix Semiconductor, Inc. (January 2006),
    msystems Ltd. (November 2006), and MusicGremlin, Inc. (June 2008).
(c) Incremental interest expense associated with the adoption of FSP APB 14-1,
    Accounting for Convertible Debt Instruments That May Be Settled in Cash upon
    Conversion (Including Partial Cash Settlement), on December 29, 2008.
(d) Income taxes associated with certain non-GAAP to GAAP adjustments and a
    valuation allowance on deferred taxes.
SanDisk Corporation
                                         Preliminary Condensed Consolidated Balance Sheets
                                                      (in thousands, unaudited)


                                                                                           March 29, 2009                 December 28, 2008*
                                       ASSETS
Current assets:
 Cash and cash equivalents                                                            $              1,090,079        $                962,061
 Short-term investments                                                                                395,088                         477,296
 Accounts receivable from product revenues, net                                                        109,095                         122,092
 Inventory                                                                                             552,170                         598,251
 Deferred taxes                                                                                         17,123                          84,023
 Other current assets                                                                                  224,071                         469,961
    Total current assets                                                                             2,387,626                       2,713,684

Long-term investments                                                                                  897,427                       1,097,302
Property and equipment, net                                                                            373,147                         396,987
Notes receivable and investments in the flash ventures with Toshiba                                  1,467,612                       1,602,291
Deferred taxes                                                                                          46,019                          15,188
Intangible assets, net                                                                                  58,721                          63,182
Other non-current assets                                                                                37,248                          43,506
    Total assets                                                                      $              5,267,800        $              5,932,140

                                    LIABILITIES
Current liabilities:
 Accounts payable trade                                                               $                128,524        $                240,985
 Accounts payable to related parties                                                                   299,851                         370,006
 Convertible short-term debt                                                                            75,000                               -
 Other current accrued liabilities                                                                     307,526                         502,443
 Deferred income on shipments to distributors and retailers and deferred revenue                       178,012                         149,575
    Total current liabilities                                                                          988,913                       1,263,009

Convertible long-term debt                                                                             892,314                         954,094
Non-current liabilities                                                                                209,481                         274,316
   Total liabilities                                                                                 2,090,708                       2,491,419

                                      EQUITY
SanDisk Corporation stockholders' equity:
  Common stock                                                                                        4,174,443                      4,154,392
  Retained earnings (accumulated deficit)                                                            (1,110,794)                      (902,799)
  Accumulated other comprehensive income                                                                113,786                        188,977
   Total SanDisk Corporation stockholders' equity                                                     3,177,435                      3,440,570
Non-controlling interest                                                                                   (343)                           151
   Total equity                                                                                       3,177,092                      3,440,721
   Total liabilities and equity                                                       $               5,267,800       $              5,932,140


* As adjusted for the adoption of FSP APB 14-1, Accounting for Convertible Debt Instruments That May Be Settled in Cash upon Conversion
(Including Partial Cash Settlement), on December 29, 2008.
SanDisk Corporation
                                 Preliminary Condensed Consolidated Statement of Cash Flows
                                                 (in thousands, unaudited)


                                                                                                        Three months ended
                                                                                           March 29, 2009               March 30, 2008*
Cash flows from operating activities:
Net income (loss)                                                                          $     (207,995)               $         10,960
Adjustments to reconcile net income (loss) to net cash provided by operating activities:
 Deferred and other taxes                                                                           8,922                          (9,446)
 Depreciation                                                                                      39,125                          41,210
 Amortization                                                                                      18,344                          33,670
 Provision for doubtful accounts                                                                    2,163                           5,774
 Share-based compensation expense                                                                  16,330                          23,226
 Excess tax benefit from share-based compensation                                                       -                            (794)
 Impairment, restructuring and other charges                                                        9,038                           3,934
 Other non-cash charges                                                                            (6,027)                          5,392
 Changes in operating assets and liabilities:
      Accounts receivable from product revenues                                                    10,833                         276,937
      Inventory                                                                                    40,309                        (140,362)
      Other assets                                                                                220,383                         109,981
      Accounts payable trade                                                                     (112,460)                        (53,014)
      Accounts payable to related parties                                                         (70,155)                          3,721
      Other liabilities                                                                           (83,071)                        (92,556)
 Total adjustments                                                                                 93,734                         207,673

Net cash provided by (used in) operating activities                                              (114,261)                        218,633

Cash flows from investing activities:
   Purchases of short and long-term investments                                                  (168,938)                       (354,955)
   Proceeds from sale of short and long-term investments                                          422,112                         434,364
   Maturities of short and long-term investments                                                   36,630                         190,049
   Acquisition of property and equipment, net                                                     (16,497)                        (56,774)
   Distribution from FlashVision Ltd.                                                              12,713                               -
   Issuance of notes receivable from Flash Partners Ltd. and Flash Alliance Ltd.                 (326,350)                        (37,418)
   Proceeds from notes receivable from Flash Partners Ltd. and Flash Alliance Ltd.                277,070                               -
   Purchased technology and other assets                                                            1,210                           1,125
 Net cash provided by investing activities                                                        237,950                         176,391

Cash flows from financing activities:
   Repayment of debt financing                                                                          -                           (9,785)
   Proceeds from employee stock programs                                                            4,570                            6,437
   Excess tax benefit from share-based compensation                                                     -                              794
 Net cash provided by (used in) financing activities                                                4,570                           (2,554)

Effect of changes in foreign currency exchange rates on cash                                         (241)                           (934)
Net increase in cash and cash equivalents                                                         128,018                         391,536
Cash and cash equivalents at beginning of period                                                  962,061                         833,749
Cash and cash equivalents at end of period                                                 $    1,090,079                $      1,225,285


* As adjusted for the adoption of FSP APB 14-1, Accounting for Convertible Debt Instruments That May Be Settled in Cash upon Conversion
(Including Partial Cash Settlement), on December 29, 2008.


                                                                                                                                  962,061

Más contenido relacionado

La actualidad más candente

alltel 1q 07recons
alltel  1q 07reconsalltel  1q 07recons
alltel 1q 07reconsfinance27
 
tribune earnings_q2_06_tables
tribune  earnings_q2_06_tablestribune  earnings_q2_06_tables
tribune earnings_q2_06_tablesfinance47
 
Maxim 2Q FISCAL 2009 RESULTS
Maxim 2Q FISCAL 2009 RESULTSMaxim 2Q FISCAL 2009 RESULTS
Maxim 2Q FISCAL 2009 RESULTSearningsreport
 
Financial results quarter ended june 2010
Financial results quarter ended june 2010Financial results quarter ended june 2010
Financial results quarter ended june 2010VasconEngineers
 
tribune earnings_q4_04_tables
tribune  earnings_q4_04_tablestribune  earnings_q4_04_tables
tribune earnings_q4_04_tablesfinance47
 
tribune earnings_q1_06_tables
tribune  earnings_q1_06_tablestribune  earnings_q1_06_tables
tribune earnings_q1_06_tablesfinance47
 
alltel 4q05nongaaprecon
alltel  4q05nongaapreconalltel  4q05nongaaprecon
alltel 4q05nongaapreconfinance27
 
tjx Annual Reports1997
tjx Annual Reports1997tjx Annual Reports1997
tjx Annual Reports1997finance14
 
whole food market fr08_scf
whole food market  fr08_scfwhole food market  fr08_scf
whole food market fr08_scffinance44
 
alltel 4Q06_Non-GAAPReconciliations_Rev
alltel  4Q06_Non-GAAPReconciliations_Revalltel  4Q06_Non-GAAPReconciliations_Rev
alltel 4Q06_Non-GAAPReconciliations_Revfinance27
 

La actualidad más candente (14)

alltel 1q 07recons
alltel  1q 07reconsalltel  1q 07recons
alltel 1q 07recons
 
tribune earnings_q2_06_tables
tribune  earnings_q2_06_tablestribune  earnings_q2_06_tables
tribune earnings_q2_06_tables
 
Maxim 2Q FISCAL 2009 RESULTS
Maxim 2Q FISCAL 2009 RESULTSMaxim 2Q FISCAL 2009 RESULTS
Maxim 2Q FISCAL 2009 RESULTS
 
Amd Q407 Financials
Amd Q407 FinancialsAmd Q407 Financials
Amd Q407 Financials
 
Amd Q308 Financials
Amd Q308 FinancialsAmd Q308 Financials
Amd Q308 Financials
 
Financial results quarter ended june 2010
Financial results quarter ended june 2010Financial results quarter ended june 2010
Financial results quarter ended june 2010
 
tribune earnings_q4_04_tables
tribune  earnings_q4_04_tablestribune  earnings_q4_04_tables
tribune earnings_q4_04_tables
 
Amd Q408 Financials
Amd Q408 FinancialsAmd Q408 Financials
Amd Q408 Financials
 
tribune earnings_q1_06_tables
tribune  earnings_q1_06_tablestribune  earnings_q1_06_tables
tribune earnings_q1_06_tables
 
alltel 4q05nongaaprecon
alltel  4q05nongaapreconalltel  4q05nongaaprecon
alltel 4q05nongaaprecon
 
tjx Annual Reports1997
tjx Annual Reports1997tjx Annual Reports1997
tjx Annual Reports1997
 
whole food market fr08_scf
whole food market  fr08_scfwhole food market  fr08_scf
whole food market fr08_scf
 
alltel 4Q06_Non-GAAPReconciliations_Rev
alltel  4Q06_Non-GAAPReconciliations_Revalltel  4Q06_Non-GAAPReconciliations_Rev
alltel 4Q06_Non-GAAPReconciliations_Rev
 
4Q05OpStats
4Q05OpStats4Q05OpStats
4Q05OpStats
 

Destacado

Q2 2009 Earning Report of United Community Financial Corp.
Q2 2009 Earning Report of United Community Financial Corp.Q2 2009 Earning Report of United Community Financial Corp.
Q2 2009 Earning Report of United Community Financial Corp.earningreport earningreport
 
Starting a company_in_singapore_introduction-v2
Starting a company_in_singapore_introduction-v2Starting a company_in_singapore_introduction-v2
Starting a company_in_singapore_introduction-v2Futurebooks
 
Q1 2009 Earning Report of Weatherford International
Q1 2009 Earning Report of Weatherford InternationalQ1 2009 Earning Report of Weatherford International
Q1 2009 Earning Report of Weatherford Internationalearningreport earningreport
 
Q3 2009 Earning Report of First Horizon National Corporation
Q3 2009 Earning Report of First Horizon National CorporationQ3 2009 Earning Report of First Horizon National Corporation
Q3 2009 Earning Report of First Horizon National Corporationearningreport earningreport
 

Destacado (6)

Q2 2009 Earning Report of Home Bancshares, Inc.
Q2 2009 Earning Report of Home Bancshares, Inc.Q2 2009 Earning Report of Home Bancshares, Inc.
Q2 2009 Earning Report of Home Bancshares, Inc.
 
Q2 2009 Earning Report of United Community Financial Corp.
Q2 2009 Earning Report of United Community Financial Corp.Q2 2009 Earning Report of United Community Financial Corp.
Q2 2009 Earning Report of United Community Financial Corp.
 
Starting a company_in_singapore_introduction-v2
Starting a company_in_singapore_introduction-v2Starting a company_in_singapore_introduction-v2
Starting a company_in_singapore_introduction-v2
 
Q1 2009 Earning Report of Weatherford International
Q1 2009 Earning Report of Weatherford InternationalQ1 2009 Earning Report of Weatherford International
Q1 2009 Earning Report of Weatherford International
 
Q3 2009 Earning Report of First Horizon National Corporation
Q3 2009 Earning Report of First Horizon National CorporationQ3 2009 Earning Report of First Horizon National Corporation
Q3 2009 Earning Report of First Horizon National Corporation
 
Q3 2009 Earning Report of Accenture
Q3 2009 Earning Report of AccentureQ3 2009 Earning Report of Accenture
Q3 2009 Earning Report of Accenture
 

Similar a Q1 2009 Earning Report of Sandisk

alltel 2Q06_Non-GAAP
alltel  2Q06_Non-GAAPalltel  2Q06_Non-GAAP
alltel 2Q06_Non-GAAPfinance27
 
alltel 2Q06_Non-GAAP
alltel  2Q06_Non-GAAPalltel  2Q06_Non-GAAP
alltel 2Q06_Non-GAAPfinance27
 
alltel 1Q06_Non-GAAP
alltel  1Q06_Non-GAAPalltel  1Q06_Non-GAAP
alltel 1Q06_Non-GAAPfinance27
 
tribune earnings_q4_02_tables
tribune  earnings_q4_02_tablestribune  earnings_q4_02_tables
tribune earnings_q4_02_tablesfinance47
 
alltel 4Q 04_Non-GAAPReconciliation
alltel  4Q 04_Non-GAAPReconciliationalltel  4Q 04_Non-GAAPReconciliation
alltel 4Q 04_Non-GAAPReconciliationfinance27
 
alltel 4Q04_Non-GAAPReconciliation
alltel  4Q04_Non-GAAPReconciliationalltel  4Q04_Non-GAAPReconciliation
alltel 4Q04_Non-GAAPReconciliationfinance27
 
alltel 4Q04_Non-GAAPReconciliation
alltel  4Q04_Non-GAAPReconciliationalltel  4Q04_Non-GAAPReconciliation
alltel 4Q04_Non-GAAPReconciliationfinance27
 
alltel 4Q04_Non-GAAPReconciliation
alltel  4Q04_Non-GAAPReconciliationalltel  4Q04_Non-GAAPReconciliation
alltel 4Q04_Non-GAAPReconciliationfinance27
 
alltel 4Q 04_Non-GAAPReconciliation
alltel  4Q 04_Non-GAAPReconciliationalltel  4Q 04_Non-GAAPReconciliation
alltel 4Q 04_Non-GAAPReconciliationfinance27
 
progress energy statement_2001_3
progress energy statement_2001_3progress energy statement_2001_3
progress energy statement_2001_3finance25
 
occidental petroleum Consolidated Statements of Operations
occidental petroleum Consolidated Statements of Operationsoccidental petroleum Consolidated Statements of Operations
occidental petroleum Consolidated Statements of Operationsfinance13
 
reliance steel & aluminum 2005_Annual_Report
reliance steel & aluminum  2005_Annual_Reportreliance steel & aluminum  2005_Annual_Report
reliance steel & aluminum 2005_Annual_Reportfinance32
 
L 1 - a - ra - revenue account
L   1 - a - ra - revenue accountL   1 - a - ra - revenue account
L 1 - a - ra - revenue accountGurvir Sidhu
 
conoco phillips 2006Fourth Quarter
conoco phillips 2006Fourth Quarterconoco phillips 2006Fourth Quarter
conoco phillips 2006Fourth Quarterfinance1
 
advanced micro devices Q408Financials
advanced micro devices Q408Financialsadvanced micro devices Q408Financials
advanced micro devices Q408Financialsfinance34
 
AMD Q408Financials
AMD Q408FinancialsAMD Q408Financials
AMD Q408Financialsfinance34
 

Similar a Q1 2009 Earning Report of Sandisk (20)

alltel 2Q06_Non-GAAP
alltel  2Q06_Non-GAAPalltel  2Q06_Non-GAAP
alltel 2Q06_Non-GAAP
 
alltel 2Q06_Non-GAAP
alltel  2Q06_Non-GAAPalltel  2Q06_Non-GAAP
alltel 2Q06_Non-GAAP
 
MHK-051704
MHK-051704MHK-051704
MHK-051704
 
MHK-051704
MHK-051704MHK-051704
MHK-051704
 
alltel 1Q06_Non-GAAP
alltel  1Q06_Non-GAAPalltel  1Q06_Non-GAAP
alltel 1Q06_Non-GAAP
 
tribune earnings_q4_02_tables
tribune  earnings_q4_02_tablestribune  earnings_q4_02_tables
tribune earnings_q4_02_tables
 
alltel 4Q 04_Non-GAAPReconciliation
alltel  4Q 04_Non-GAAPReconciliationalltel  4Q 04_Non-GAAPReconciliation
alltel 4Q 04_Non-GAAPReconciliation
 
alltel 4Q04_Non-GAAPReconciliation
alltel  4Q04_Non-GAAPReconciliationalltel  4Q04_Non-GAAPReconciliation
alltel 4Q04_Non-GAAPReconciliation
 
alltel 4Q04_Non-GAAPReconciliation
alltel  4Q04_Non-GAAPReconciliationalltel  4Q04_Non-GAAPReconciliation
alltel 4Q04_Non-GAAPReconciliation
 
alltel 4Q04_Non-GAAPReconciliation
alltel  4Q04_Non-GAAPReconciliationalltel  4Q04_Non-GAAPReconciliation
alltel 4Q04_Non-GAAPReconciliation
 
alltel 4Q 04_Non-GAAPReconciliation
alltel  4Q 04_Non-GAAPReconciliationalltel  4Q 04_Non-GAAPReconciliation
alltel 4Q 04_Non-GAAPReconciliation
 
progress energy statement_2001_3
progress energy statement_2001_3progress energy statement_2001_3
progress energy statement_2001_3
 
occidental petroleum Consolidated Statements of Operations
occidental petroleum Consolidated Statements of Operationsoccidental petroleum Consolidated Statements of Operations
occidental petroleum Consolidated Statements of Operations
 
MHK-04arfin
MHK-04arfinMHK-04arfin
MHK-04arfin
 
MHK-04arfin
MHK-04arfinMHK-04arfin
MHK-04arfin
 
reliance steel & aluminum 2005_Annual_Report
reliance steel & aluminum  2005_Annual_Reportreliance steel & aluminum  2005_Annual_Report
reliance steel & aluminum 2005_Annual_Report
 
L 1 - a - ra - revenue account
L   1 - a - ra - revenue accountL   1 - a - ra - revenue account
L 1 - a - ra - revenue account
 
conoco phillips 2006Fourth Quarter
conoco phillips 2006Fourth Quarterconoco phillips 2006Fourth Quarter
conoco phillips 2006Fourth Quarter
 
advanced micro devices Q408Financials
advanced micro devices Q408Financialsadvanced micro devices Q408Financials
advanced micro devices Q408Financials
 
AMD Q408Financials
AMD Q408FinancialsAMD Q408Financials
AMD Q408Financials
 

Más de earningreport earningreport

Q3 2009 Earning Report of Boston Scientific Corporation
Q3 2009 Earning Report of Boston Scientific CorporationQ3 2009 Earning Report of Boston Scientific Corporation
Q3 2009 Earning Report of Boston Scientific Corporationearningreport earningreport
 
Q3 2009 Earning Report of Boston Scientific Corporation
Q3 2009 Earning Report of Boston Scientific CorporationQ3 2009 Earning Report of Boston Scientific Corporation
Q3 2009 Earning Report of Boston Scientific Corporationearningreport earningreport
 
Q3 2009 Earning Report of Atheros Communications, Inc.
Q3 2009 Earning Report of Atheros Communications, Inc.Q3 2009 Earning Report of Atheros Communications, Inc.
Q3 2009 Earning Report of Atheros Communications, Inc.earningreport earningreport
 
Q3 2009 Earning Report of Hancock Holding Company
Q3 2009 Earning Report of Hancock Holding CompanyQ3 2009 Earning Report of Hancock Holding Company
Q3 2009 Earning Report of Hancock Holding Companyearningreport earningreport
 
Q3 2009 Earning Report of Infosys Technologies Ltd.
Q3 2009 Earning Report of Infosys Technologies Ltd.Q3 2009 Earning Report of Infosys Technologies Ltd.
Q3 2009 Earning Report of Infosys Technologies Ltd.earningreport earningreport
 
Q3 2009 Earning Report of Marriott International
Q3 2009 Earning Report of Marriott InternationalQ3 2009 Earning Report of Marriott International
Q3 2009 Earning Report of Marriott Internationalearningreport earningreport
 
Q3 2009 Earning Report of Worthington Industries, Inc.
Q3 2009 Earning Report of Worthington Industries, Inc.Q3 2009 Earning Report of Worthington Industries, Inc.
Q3 2009 Earning Report of Worthington Industries, Inc.earningreport earningreport
 

Más de earningreport earningreport (20)

Q3 2009 Earning Report of Banco Santander S.A.
Q3 2009 Earning Report of Banco Santander S.A.Q3 2009 Earning Report of Banco Santander S.A.
Q3 2009 Earning Report of Banco Santander S.A.
 
Q3 Earning report of Daimler AG
Q3 Earning report of Daimler AGQ3 Earning report of Daimler AG
Q3 Earning report of Daimler AG
 
Q3 Earning Report of BB&T Corporation
Q3 Earning Report of BB&T CorporationQ3 Earning Report of BB&T Corporation
Q3 Earning Report of BB&T Corporation
 
Q3 Earning Report of BB&T Corporation
Q3 Earning Report of BB&T CorporationQ3 Earning Report of BB&T Corporation
Q3 Earning Report of BB&T Corporation
 
Q3 2009 Earning Report of Brown & Brown
Q3 2009 Earning Report of Brown & BrownQ3 2009 Earning Report of Brown & Brown
Q3 2009 Earning Report of Brown & Brown
 
Q3 2009 Earning Report of Boston Scientific Corporation
Q3 2009 Earning Report of Boston Scientific CorporationQ3 2009 Earning Report of Boston Scientific Corporation
Q3 2009 Earning Report of Boston Scientific Corporation
 
Q3 2009 Earning Report of Boston Scientific Corporation
Q3 2009 Earning Report of Boston Scientific CorporationQ3 2009 Earning Report of Boston Scientific Corporation
Q3 2009 Earning Report of Boston Scientific Corporation
 
Q3 2009 Earning Report of Atheros Communications, Inc.
Q3 2009 Earning Report of Atheros Communications, Inc.Q3 2009 Earning Report of Atheros Communications, Inc.
Q3 2009 Earning Report of Atheros Communications, Inc.
 
Q3 2009 Earning Report of Apple Inc.
Q3 2009 Earning Report of Apple Inc.Q3 2009 Earning Report of Apple Inc.
Q3 2009 Earning Report of Apple Inc.
 
Q3 2009 Earning Report of Hancock Holding Company
Q3 2009 Earning Report of Hancock Holding CompanyQ3 2009 Earning Report of Hancock Holding Company
Q3 2009 Earning Report of Hancock Holding Company
 
Q3 2009 Earning Report of Walgreen Co.
Q3 2009 Earning Report of Walgreen Co.Q3 2009 Earning Report of Walgreen Co.
Q3 2009 Earning Report of Walgreen Co.
 
Q3 2009 Earning Report of Infosys Technologies Ltd.
Q3 2009 Earning Report of Infosys Technologies Ltd.Q3 2009 Earning Report of Infosys Technologies Ltd.
Q3 2009 Earning Report of Infosys Technologies Ltd.
 
Q3 2009 Earning Report of Marriott International
Q3 2009 Earning Report of Marriott InternationalQ3 2009 Earning Report of Marriott International
Q3 2009 Earning Report of Marriott International
 
Q3 2009 Earning Report of PepsiCo.
Q3 2009 Earning Report of PepsiCo.Q3 2009 Earning Report of PepsiCo.
Q3 2009 Earning Report of PepsiCo.
 
Q3 2009 Earning Report of Alcoa, Inc.
Q3 2009 Earning Report of Alcoa, Inc.Q3 2009 Earning Report of Alcoa, Inc.
Q3 2009 Earning Report of Alcoa, Inc.
 
Q3 2009 Earning Report of Pepsi Bottling Group
Q3 2009 Earning Report of Pepsi Bottling GroupQ3 2009 Earning Report of Pepsi Bottling Group
Q3 2009 Earning Report of Pepsi Bottling Group
 
Q3 2009 Earning Report of Jean Coutu Group
Q3 2009 Earning Report of Jean Coutu GroupQ3 2009 Earning Report of Jean Coutu Group
Q3 2009 Earning Report of Jean Coutu Group
 
Q3 2009 Earning Report of Minerva plc
Q3 2009 Earning Report of Minerva plcQ3 2009 Earning Report of Minerva plc
Q3 2009 Earning Report of Minerva plc
 
Q3 2009 Earning Report of Worthington Industries, Inc.
Q3 2009 Earning Report of Worthington Industries, Inc.Q3 2009 Earning Report of Worthington Industries, Inc.
Q3 2009 Earning Report of Worthington Industries, Inc.
 
Q3 2009 Earning Report of Walgreen
Q3 2009 Earning Report of WalgreenQ3 2009 Earning Report of Walgreen
Q3 2009 Earning Report of Walgreen
 

Último

00_Main ppt_MeetupDORA&CyberSecurity.pptx
00_Main ppt_MeetupDORA&CyberSecurity.pptx00_Main ppt_MeetupDORA&CyberSecurity.pptx
00_Main ppt_MeetupDORA&CyberSecurity.pptxFinTech Belgium
 
Call US 📞 9892124323 ✅ Kurla Call Girls In Kurla ( Mumbai ) secure service
Call US 📞 9892124323 ✅ Kurla Call Girls In Kurla ( Mumbai ) secure serviceCall US 📞 9892124323 ✅ Kurla Call Girls In Kurla ( Mumbai ) secure service
Call US 📞 9892124323 ✅ Kurla Call Girls In Kurla ( Mumbai ) secure servicePooja Nehwal
 
Independent Call Girl Number in Kurla Mumbai📲 Pooja Nehwal 9892124323 💞 Full ...
Independent Call Girl Number in Kurla Mumbai📲 Pooja Nehwal 9892124323 💞 Full ...Independent Call Girl Number in Kurla Mumbai📲 Pooja Nehwal 9892124323 💞 Full ...
Independent Call Girl Number in Kurla Mumbai📲 Pooja Nehwal 9892124323 💞 Full ...Pooja Nehwal
 
VVIP Pune Call Girls Katraj (7001035870) Pune Escorts Nearby with Complete Sa...
VVIP Pune Call Girls Katraj (7001035870) Pune Escorts Nearby with Complete Sa...VVIP Pune Call Girls Katraj (7001035870) Pune Escorts Nearby with Complete Sa...
VVIP Pune Call Girls Katraj (7001035870) Pune Escorts Nearby with Complete Sa...Call Girls in Nagpur High Profile
 
Booking open Available Pune Call Girls Talegaon Dabhade 6297143586 Call Hot ...
Booking open Available Pune Call Girls Talegaon Dabhade  6297143586 Call Hot ...Booking open Available Pune Call Girls Talegaon Dabhade  6297143586 Call Hot ...
Booking open Available Pune Call Girls Talegaon Dabhade 6297143586 Call Hot ...Call Girls in Nagpur High Profile
 
Vip Call US 📞 7738631006 ✅Call Girls In Sakinaka ( Mumbai )
Vip Call US 📞 7738631006 ✅Call Girls In Sakinaka ( Mumbai )Vip Call US 📞 7738631006 ✅Call Girls In Sakinaka ( Mumbai )
Vip Call US 📞 7738631006 ✅Call Girls In Sakinaka ( Mumbai )Pooja Nehwal
 
Solution Manual for Principles of Corporate Finance 14th Edition by Richard B...
Solution Manual for Principles of Corporate Finance 14th Edition by Richard B...Solution Manual for Principles of Corporate Finance 14th Edition by Richard B...
Solution Manual for Principles of Corporate Finance 14th Edition by Richard B...ssifa0344
 
The Economic History of the U.S. Lecture 26.pdf
The Economic History of the U.S. Lecture 26.pdfThe Economic History of the U.S. Lecture 26.pdf
The Economic History of the U.S. Lecture 26.pdfGale Pooley
 
VIP Call Girls LB Nagar ( Hyderabad ) Phone 8250192130 | ₹5k To 25k With Room...
VIP Call Girls LB Nagar ( Hyderabad ) Phone 8250192130 | ₹5k To 25k With Room...VIP Call Girls LB Nagar ( Hyderabad ) Phone 8250192130 | ₹5k To 25k With Room...
VIP Call Girls LB Nagar ( Hyderabad ) Phone 8250192130 | ₹5k To 25k With Room...Suhani Kapoor
 
Best VIP Call Girls Noida Sector 18 Call Me: 8448380779
Best VIP Call Girls Noida Sector 18 Call Me: 8448380779Best VIP Call Girls Noida Sector 18 Call Me: 8448380779
Best VIP Call Girls Noida Sector 18 Call Me: 8448380779Delhi Call girls
 
Malad Call Girl in Services 9892124323 | ₹,4500 With Room Free Delivery
Malad Call Girl in Services  9892124323 | ₹,4500 With Room Free DeliveryMalad Call Girl in Services  9892124323 | ₹,4500 With Room Free Delivery
Malad Call Girl in Services 9892124323 | ₹,4500 With Room Free DeliveryPooja Nehwal
 
Call Girls Service Nagpur Maya Call 7001035870 Meet With Nagpur Escorts
Call Girls Service Nagpur Maya Call 7001035870 Meet With Nagpur EscortsCall Girls Service Nagpur Maya Call 7001035870 Meet With Nagpur Escorts
Call Girls Service Nagpur Maya Call 7001035870 Meet With Nagpur Escortsranjana rawat
 
The Economic History of the U.S. Lecture 21.pdf
The Economic History of the U.S. Lecture 21.pdfThe Economic History of the U.S. Lecture 21.pdf
The Economic History of the U.S. Lecture 21.pdfGale Pooley
 
Booking open Available Pune Call Girls Shivane 6297143586 Call Hot Indian Gi...
Booking open Available Pune Call Girls Shivane  6297143586 Call Hot Indian Gi...Booking open Available Pune Call Girls Shivane  6297143586 Call Hot Indian Gi...
Booking open Available Pune Call Girls Shivane 6297143586 Call Hot Indian Gi...Call Girls in Nagpur High Profile
 
TEST BANK For Corporate Finance, 13th Edition By Stephen Ross, Randolph Weste...
TEST BANK For Corporate Finance, 13th Edition By Stephen Ross, Randolph Weste...TEST BANK For Corporate Finance, 13th Edition By Stephen Ross, Randolph Weste...
TEST BANK For Corporate Finance, 13th Edition By Stephen Ross, Randolph Weste...ssifa0344
 
The Economic History of the U.S. Lecture 20.pdf
The Economic History of the U.S. Lecture 20.pdfThe Economic History of the U.S. Lecture 20.pdf
The Economic History of the U.S. Lecture 20.pdfGale Pooley
 
CALL ON ➥8923113531 🔝Call Girls Gomti Nagar Lucknow best sexual service
CALL ON ➥8923113531 🔝Call Girls Gomti Nagar Lucknow best sexual serviceCALL ON ➥8923113531 🔝Call Girls Gomti Nagar Lucknow best sexual service
CALL ON ➥8923113531 🔝Call Girls Gomti Nagar Lucknow best sexual serviceanilsa9823
 
High Class Call Girls Nagpur Grishma Call 7001035870 Meet With Nagpur Escorts
High Class Call Girls Nagpur Grishma Call 7001035870 Meet With Nagpur EscortsHigh Class Call Girls Nagpur Grishma Call 7001035870 Meet With Nagpur Escorts
High Class Call Girls Nagpur Grishma Call 7001035870 Meet With Nagpur Escortsranjana rawat
 

Último (20)

00_Main ppt_MeetupDORA&CyberSecurity.pptx
00_Main ppt_MeetupDORA&CyberSecurity.pptx00_Main ppt_MeetupDORA&CyberSecurity.pptx
00_Main ppt_MeetupDORA&CyberSecurity.pptx
 
Call US 📞 9892124323 ✅ Kurla Call Girls In Kurla ( Mumbai ) secure service
Call US 📞 9892124323 ✅ Kurla Call Girls In Kurla ( Mumbai ) secure serviceCall US 📞 9892124323 ✅ Kurla Call Girls In Kurla ( Mumbai ) secure service
Call US 📞 9892124323 ✅ Kurla Call Girls In Kurla ( Mumbai ) secure service
 
Independent Call Girl Number in Kurla Mumbai📲 Pooja Nehwal 9892124323 💞 Full ...
Independent Call Girl Number in Kurla Mumbai📲 Pooja Nehwal 9892124323 💞 Full ...Independent Call Girl Number in Kurla Mumbai📲 Pooja Nehwal 9892124323 💞 Full ...
Independent Call Girl Number in Kurla Mumbai📲 Pooja Nehwal 9892124323 💞 Full ...
 
VVIP Pune Call Girls Katraj (7001035870) Pune Escorts Nearby with Complete Sa...
VVIP Pune Call Girls Katraj (7001035870) Pune Escorts Nearby with Complete Sa...VVIP Pune Call Girls Katraj (7001035870) Pune Escorts Nearby with Complete Sa...
VVIP Pune Call Girls Katraj (7001035870) Pune Escorts Nearby with Complete Sa...
 
Booking open Available Pune Call Girls Talegaon Dabhade 6297143586 Call Hot ...
Booking open Available Pune Call Girls Talegaon Dabhade  6297143586 Call Hot ...Booking open Available Pune Call Girls Talegaon Dabhade  6297143586 Call Hot ...
Booking open Available Pune Call Girls Talegaon Dabhade 6297143586 Call Hot ...
 
Vip Call US 📞 7738631006 ✅Call Girls In Sakinaka ( Mumbai )
Vip Call US 📞 7738631006 ✅Call Girls In Sakinaka ( Mumbai )Vip Call US 📞 7738631006 ✅Call Girls In Sakinaka ( Mumbai )
Vip Call US 📞 7738631006 ✅Call Girls In Sakinaka ( Mumbai )
 
Solution Manual for Principles of Corporate Finance 14th Edition by Richard B...
Solution Manual for Principles of Corporate Finance 14th Edition by Richard B...Solution Manual for Principles of Corporate Finance 14th Edition by Richard B...
Solution Manual for Principles of Corporate Finance 14th Edition by Richard B...
 
The Economic History of the U.S. Lecture 26.pdf
The Economic History of the U.S. Lecture 26.pdfThe Economic History of the U.S. Lecture 26.pdf
The Economic History of the U.S. Lecture 26.pdf
 
VIP Call Girls LB Nagar ( Hyderabad ) Phone 8250192130 | ₹5k To 25k With Room...
VIP Call Girls LB Nagar ( Hyderabad ) Phone 8250192130 | ₹5k To 25k With Room...VIP Call Girls LB Nagar ( Hyderabad ) Phone 8250192130 | ₹5k To 25k With Room...
VIP Call Girls LB Nagar ( Hyderabad ) Phone 8250192130 | ₹5k To 25k With Room...
 
Best VIP Call Girls Noida Sector 18 Call Me: 8448380779
Best VIP Call Girls Noida Sector 18 Call Me: 8448380779Best VIP Call Girls Noida Sector 18 Call Me: 8448380779
Best VIP Call Girls Noida Sector 18 Call Me: 8448380779
 
Malad Call Girl in Services 9892124323 | ₹,4500 With Room Free Delivery
Malad Call Girl in Services  9892124323 | ₹,4500 With Room Free DeliveryMalad Call Girl in Services  9892124323 | ₹,4500 With Room Free Delivery
Malad Call Girl in Services 9892124323 | ₹,4500 With Room Free Delivery
 
Call Girls Service Nagpur Maya Call 7001035870 Meet With Nagpur Escorts
Call Girls Service Nagpur Maya Call 7001035870 Meet With Nagpur EscortsCall Girls Service Nagpur Maya Call 7001035870 Meet With Nagpur Escorts
Call Girls Service Nagpur Maya Call 7001035870 Meet With Nagpur Escorts
 
The Economic History of the U.S. Lecture 21.pdf
The Economic History of the U.S. Lecture 21.pdfThe Economic History of the U.S. Lecture 21.pdf
The Economic History of the U.S. Lecture 21.pdf
 
Booking open Available Pune Call Girls Shivane 6297143586 Call Hot Indian Gi...
Booking open Available Pune Call Girls Shivane  6297143586 Call Hot Indian Gi...Booking open Available Pune Call Girls Shivane  6297143586 Call Hot Indian Gi...
Booking open Available Pune Call Girls Shivane 6297143586 Call Hot Indian Gi...
 
TEST BANK For Corporate Finance, 13th Edition By Stephen Ross, Randolph Weste...
TEST BANK For Corporate Finance, 13th Edition By Stephen Ross, Randolph Weste...TEST BANK For Corporate Finance, 13th Edition By Stephen Ross, Randolph Weste...
TEST BANK For Corporate Finance, 13th Edition By Stephen Ross, Randolph Weste...
 
The Economic History of the U.S. Lecture 20.pdf
The Economic History of the U.S. Lecture 20.pdfThe Economic History of the U.S. Lecture 20.pdf
The Economic History of the U.S. Lecture 20.pdf
 
(Vedika) Low Rate Call Girls in Pune Call Now 8250077686 Pune Escorts 24x7
(Vedika) Low Rate Call Girls in Pune Call Now 8250077686 Pune Escorts 24x7(Vedika) Low Rate Call Girls in Pune Call Now 8250077686 Pune Escorts 24x7
(Vedika) Low Rate Call Girls in Pune Call Now 8250077686 Pune Escorts 24x7
 
CALL ON ➥8923113531 🔝Call Girls Gomti Nagar Lucknow best sexual service
CALL ON ➥8923113531 🔝Call Girls Gomti Nagar Lucknow best sexual serviceCALL ON ➥8923113531 🔝Call Girls Gomti Nagar Lucknow best sexual service
CALL ON ➥8923113531 🔝Call Girls Gomti Nagar Lucknow best sexual service
 
Commercial Bank Economic Capsule - April 2024
Commercial Bank Economic Capsule - April 2024Commercial Bank Economic Capsule - April 2024
Commercial Bank Economic Capsule - April 2024
 
High Class Call Girls Nagpur Grishma Call 7001035870 Meet With Nagpur Escorts
High Class Call Girls Nagpur Grishma Call 7001035870 Meet With Nagpur EscortsHigh Class Call Girls Nagpur Grishma Call 7001035870 Meet With Nagpur Escorts
High Class Call Girls Nagpur Grishma Call 7001035870 Meet With Nagpur Escorts
 

Q1 2009 Earning Report of Sandisk

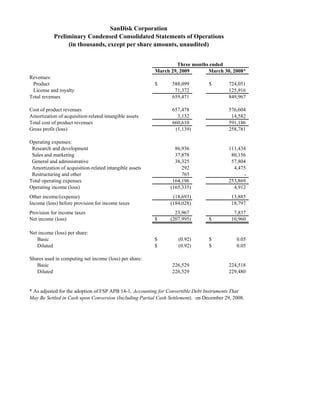
  • 1. SanDisk Corporation Preliminary Condensed Consolidated Statements of Operations (in thousands, except per share amounts, unaudited) Three months ended March 29, 2009 March 30, 2008* Revenues: Product $ 588,099 $ 724,051 License and royalty 71,372 125,916 Total revenues 659,471 849,967 Cost of product revenues 657,478 576,604 Amortization of acquisition-related intangible assets 3,132 14,582 Total cost of product revenues 660,610 591,186 Gross profit (loss) (1,139) 258,781 Operating expenses: Research and development 86,936 111,434 Sales and marketing 37,878 80,156 General and administrative 38,325 57,804 Amortization of acquisition-related intangible assets 292 4,475 Restructuring and other 765 - Total operating expenses 164,196 253,869 Operating income (loss) (165,335) 4,912 Other income/(expense) (18,693) 13,885 Income (loss) before provision for income taxes (184,028) 18,797 Provision for income taxes 23,967 7,837 Net income (loss) $ (207,995) $ 10,960 Net income (loss) per share: Basic $ (0.92) $ 0.05 Diluted $ (0.92) $ 0.05 Shares used in computing net income (loss) per share: Basic 226,529 224,518 Diluted 226,529 229,480 * As adjusted for the adoption of FSP APB 14-1, Accounting for Convertible Debt Instruments That May Be Settled in Cash upon Conversion (Including Partial Cash Settlement), on December 29, 2008.
  • 2. SanDisk Corporation (1) Reconciliation of Preliminary GAAP to Non-GAAP Operating Results (in thousands, except per share data, unaudited) Three months ended March 29, 2009 March 30, 2008* SUMMARY RECONCILIATION OF NET INCOME (LOSS) GAAP NET INCOME (LOSS) $ (207,995) $ 10,960 Share-based compensation (a) 16,330 23,226 Amortization of acquisition-related intangible assets (b) 3,424 19,057 Convertible debt interest (c) 12,926 11,997 Income tax adjustments (d) 66,852 (17,454) NON-GAAP NET INCOME (LOSS) $ (108,463) $ 47,786 GAAP COST OF PRODUCT REVENUES $ 660,610 $ 591,186 Share-based compensation (a) (2,374) (3,629) Amortization of acquisition-related intangible assets (b) (3,132) (14,582) NON-GAAP COST OF PRODUCT REVENUES $ 655,104 $ 572,975 GAAP GROSS PROFIT (LOSS) $ (1,139) $ 258,781 Share-based compensation (a) 2,374 3,629 Amortization of acquisition-related intangible assets (b) 3,132 14,582 NON-GAAP GROSS PROFIT $ 4,367 $ 276,992 GAAP RESEARCH AND DEVELOPMENT EXPENSES $ 86,936 $ 111,434 Share-based compensation (a) (6,152) (8,826) NON-GAAP RESEARCH AND DEVELOPMENT EXPENSES $ 80,784 $ 102,608 GAAP SALES AND MARKETING EXPENSES $ 37,878 $ 80,156 Share-based compensation (a) (2,349) (3,511) NON-GAAP SALES AND MARKETING EXPENSES $ 35,529 $ 76,645 GAAP GENERAL AND ADMINISTRATIVE EXPENSES $ 38,325 $ 57,804 Share-based compensation (a) (5,455) (7,260) NON-GAAP GENERAL AND ADMINISTRATIVE EXPENSES $ 32,870 $ 50,544 GAAP TOTAL OPERATING EXPENSES $ 164,196 $ 253,869 Share-based compensation (a) (13,956) (19,597) Amortization of acquisition-related intangible assets (b) (292) (4,475) NON-GAAP TOTAL OPERATING EXPENSES $ 149,948 $ 229,797 GAAP OPERATING INCOME (LOSS) $ (165,335) $ 4,912 Cost of product revenues adjustments (a) (b) 5,506 18,211 Operating expense adjustments (a) (b) 14,248 24,072 NON-GAAP OPERATING INCOME (LOSS) $ (145,581) $ 47,195 GAAP OTHER INCOME (EXPENSE) $ (18,693) $ 13,885 Convertible debt interest (c) 12,926 11,997 NON-GAAP OTHER INCOME (EXPENSE) $ (5,767) $ 25,882 GAAP NET INCOME (LOSS) $ (207,995) $ 10,960 Cost of product revenues adjustments (a) (b) 5,506 18,211 Operating expense adjustments (a) (b) 14,248 24,072 Convertible debt interest (c) 12,926 11,997 Income tax adjustments (d) 66,852 (17,454) NON-GAAP NET INCOME (LOSS) $ (108,463) $ 47,786 Diluted net income (loss) per share: GAAP $ (0.92) $ 0.05 Non-GAAP $ (0.48) $ 0.21 Shares used in computing diluted net income (loss) per share: GAAP 226,529 229,480 Non-GAAP 226,529 229,383 * As adjusted for the adoption of FSP APB 14-1, Accounting for Convertible Debt Instruments That May Be Settled in Cash upon Conversion (Including Partial Cash Settlement), on December 29, 2008.
  • 3. SanDisk Corporation Reconciliation of Preliminary GAAP to Non-GAAP Operating Results (1) (1) To supplement our condensed consolidated financial statements presented in accordance with generally accepted accounting principles (GAAP), we use non- GAAP measures of operating results, net income (loss) and net income (loss) per share, which are adjusted from results based on GAAP to exclude certain expenses, gains and losses. These non-GAAP financial measures are provided to enhance the user's overall understanding of our current financial performance and our prospects for the future. Specifically, we believe the non-GAAP results provide useful information to both management and investors as these non-GAAP results exclude certain expenses, gains and losses that we believe are not indicative of our core operating results and because it is consistent with the financial models and estimates published by many analysts who follow the Company. For example, because the non-GAAP results exclude the expenses we recorded for share-based compensation in accordance with SFAS 123(R), the amortization of acquisition-related intangible assets related to acquisitions of Matrix Semiconductor, Inc. in January 2006, msystems Ltd. in November 2006 and MusicGremlin, Inc. in June 2008, we believe the inclusion of non-GAAP financial measures provide consistency in our financial reporting. These non-GAAP results are some of the primary indicators management uses for assessing our performance, allocating resources and planning and forecasting future periods. Further, management uses non-GAAP information that excludes certain non-cash charges, such as amortization of purchased intangible assets and share-based compensation, as these non-GAAP charges do not reflect the cash operating results of the business or the ongoing results. These measures should be considered in addition to results prepared in accordance with GAAP, but should not be considered a substitute for or superior to GAAP results. These non-GAAP measures may be different than the non-GAAP measures used by other companies. (a) Share-based compensation expense. (b) Amortization of acquisition-related intangible assets, primarily core and developed technology, related to the acquisitions of Matrix Semiconductor, Inc. (January 2006), msystems Ltd. (November 2006), and MusicGremlin, Inc. (June 2008). (c) Incremental interest expense associated with the adoption of FSP APB 14-1, Accounting for Convertible Debt Instruments That May Be Settled in Cash upon Conversion (Including Partial Cash Settlement), on December 29, 2008. (d) Income taxes associated with certain non-GAAP to GAAP adjustments and a valuation allowance on deferred taxes.
  • 4. SanDisk Corporation Preliminary Condensed Consolidated Balance Sheets (in thousands, unaudited) March 29, 2009 December 28, 2008* ASSETS Current assets: Cash and cash equivalents $ 1,090,079 $ 962,061 Short-term investments 395,088 477,296 Accounts receivable from product revenues, net 109,095 122,092 Inventory 552,170 598,251 Deferred taxes 17,123 84,023 Other current assets 224,071 469,961 Total current assets 2,387,626 2,713,684 Long-term investments 897,427 1,097,302 Property and equipment, net 373,147 396,987 Notes receivable and investments in the flash ventures with Toshiba 1,467,612 1,602,291 Deferred taxes 46,019 15,188 Intangible assets, net 58,721 63,182 Other non-current assets 37,248 43,506 Total assets $ 5,267,800 $ 5,932,140 LIABILITIES Current liabilities: Accounts payable trade $ 128,524 $ 240,985 Accounts payable to related parties 299,851 370,006 Convertible short-term debt 75,000 - Other current accrued liabilities 307,526 502,443 Deferred income on shipments to distributors and retailers and deferred revenue 178,012 149,575 Total current liabilities 988,913 1,263,009 Convertible long-term debt 892,314 954,094 Non-current liabilities 209,481 274,316 Total liabilities 2,090,708 2,491,419 EQUITY SanDisk Corporation stockholders' equity: Common stock 4,174,443 4,154,392 Retained earnings (accumulated deficit) (1,110,794) (902,799) Accumulated other comprehensive income 113,786 188,977 Total SanDisk Corporation stockholders' equity 3,177,435 3,440,570 Non-controlling interest (343) 151 Total equity 3,177,092 3,440,721 Total liabilities and equity $ 5,267,800 $ 5,932,140 * As adjusted for the adoption of FSP APB 14-1, Accounting for Convertible Debt Instruments That May Be Settled in Cash upon Conversion (Including Partial Cash Settlement), on December 29, 2008.
  • 5. SanDisk Corporation Preliminary Condensed Consolidated Statement of Cash Flows (in thousands, unaudited) Three months ended March 29, 2009 March 30, 2008* Cash flows from operating activities: Net income (loss) $ (207,995) $ 10,960 Adjustments to reconcile net income (loss) to net cash provided by operating activities: Deferred and other taxes 8,922 (9,446) Depreciation 39,125 41,210 Amortization 18,344 33,670 Provision for doubtful accounts 2,163 5,774 Share-based compensation expense 16,330 23,226 Excess tax benefit from share-based compensation - (794) Impairment, restructuring and other charges 9,038 3,934 Other non-cash charges (6,027) 5,392 Changes in operating assets and liabilities: Accounts receivable from product revenues 10,833 276,937 Inventory 40,309 (140,362) Other assets 220,383 109,981 Accounts payable trade (112,460) (53,014) Accounts payable to related parties (70,155) 3,721 Other liabilities (83,071) (92,556) Total adjustments 93,734 207,673 Net cash provided by (used in) operating activities (114,261) 218,633 Cash flows from investing activities: Purchases of short and long-term investments (168,938) (354,955) Proceeds from sale of short and long-term investments 422,112 434,364 Maturities of short and long-term investments 36,630 190,049 Acquisition of property and equipment, net (16,497) (56,774) Distribution from FlashVision Ltd. 12,713 - Issuance of notes receivable from Flash Partners Ltd. and Flash Alliance Ltd. (326,350) (37,418) Proceeds from notes receivable from Flash Partners Ltd. and Flash Alliance Ltd. 277,070 - Purchased technology and other assets 1,210 1,125 Net cash provided by investing activities 237,950 176,391 Cash flows from financing activities: Repayment of debt financing - (9,785) Proceeds from employee stock programs 4,570 6,437 Excess tax benefit from share-based compensation - 794 Net cash provided by (used in) financing activities 4,570 (2,554) Effect of changes in foreign currency exchange rates on cash (241) (934) Net increase in cash and cash equivalents 128,018 391,536 Cash and cash equivalents at beginning of period 962,061 833,749 Cash and cash equivalents at end of period $ 1,090,079 $ 1,225,285 * As adjusted for the adoption of FSP APB 14-1, Accounting for Convertible Debt Instruments That May Be Settled in Cash upon Conversion (Including Partial Cash Settlement), on December 29, 2008. 962,061