Economics + Disability Nationwide 2012

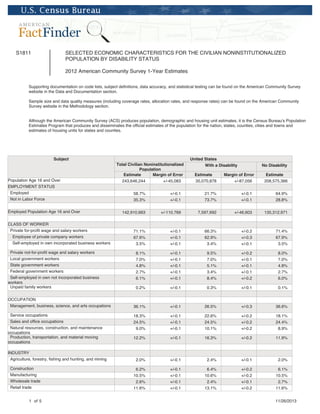
ACS 2012. Selected Economic Characteristics for the Civilian Noninstitutionalized Population By Disability Status, 1-Yr. Estimates, Table S1811. Astonishing stats indicate that in 2012: 22.1% of Americans with Disabilities are below 100% of poverty level, compared with 12.7% of Americans without disabilities. 1 in 4 (25%) Americans with disabilities aged 25+ still don't have a high school diploma, compared with 11.1% of Americans without disabilities. 5.1% of the "Employed Population Age 16 and Over" are Americans living with disAbilities, compared to the 94.7% of the American workforce who still live without disabilities. It doesn't make sense that Americans with disabilities are still not "presumed disadvantaged" for purposes of gaining advantages and resources in Federal SBA employment and entrepreneurship resources. Congress needs to take note, show leadership and moral courage, and recognize that Americans with disAbilities are ready and waiting in the wings for a chance to shine. Give us equal opportunities in education and employment, make much-needed infrastructure investments in accessibility in all public-service facilities (including the Capital and other GSA assets), and hire more ppl with disAbilities (PwD) in leadership positions at all Federal agencies, especially DOJ, HUD, DOL, and HHS.

Recomendados
Recomendados
Más contenido relacionado
Similar a Economics + Disability Nationwide 2012
Similar a Economics + Disability Nationwide 2012 (20)
Más de eilily Community Access Project, Somerville
Más de eilily Community Access Project, Somerville (20)
Último
Último (20)
Economics + Disability Nationwide 2012
- 1. S1811 SELECTED ECONOMIC CHARACTERISTICS FOR THE CIVILIAN NONINSTITUTIONALIZED POPULATION BY DISABILITY STATUS 2012 American Community Survey 1-Year Estimates Supporting documentation on code lists, subject definitions, data accuracy, and statistical testing can be found on the American Community Survey website in the Data and Documentation section. Sample size and data quality measures (including coverage rates, allocation rates, and response rates) can be found on the American Community Survey website in the Methodology section. Although the American Community Survey (ACS) produces population, demographic and housing unit estimates, it is the Census Bureau's Population Estimates Program that produces and disseminates the official estimates of the population for the nation, states, counties, cities and towns and estimates of housing units for states and counties. Subject Population Age 16 and Over EMPLOYMENT STATUS Employed Not in Labor Force Employed Population Age 16 and Over CLASS OF WORKER Private for-profit wage and salary workers Employee of private company workers Self-employed in own incorporated business workers Private not-for-profit wage and salary workers Local government workers State government workers Federal government workers Self-employed in own not incorporated business workers Unpaid family workers OCCUPATION Management, business, science, and arts occupations Service occupations Sales and office occupations Natural resources, construction, and maintenance occupations Production, transportation, and material moving occupations INDUSTRY Agriculture, forestry, fishing and hunting, and mining Construction Manufacturing Wholesale trade Retail trade 1 of 5 Total Civilian Noninstitutionalized Population Estimate Margin of Error 243,646,244 +/-45,083 United States With a Disability Estimate 35,070,878 No Disability Margin of Error +/-87,056 Estimate 208,575,366 58.7% 35.3% +/-0.1 +/-0.1 21.7% 73.7% +/-0.1 +/-0.1 64.9% 28.8% 142,910,663 +/-110,769 7,597,692 +/-46,603 135,312,971 71.1% 67.6% 3.5% +/-0.1 +/-0.1 +/-0.1 66.3% 62.9% 3.4% +/-0.2 +/-0.3 +/-0.1 71.4% 67.9% 3.5% 8.1% 7.0% 4.8% 2.7% 6.1% +/-0.1 +/-0.1 +/-0.1 +/-0.1 +/-0.1 9.5% 7.0% 5.1% 3.4% 8.4% +/-0.2 +/-0.1 +/-0.1 +/-0.1 +/-0.2 8.0% 7.0% 4.8% 2.7% 6.0% 0.2% +/-0.1 0.3% +/-0.1 0.1% 36.1% +/-0.1 26.5% +/-0.3 36.6% 18.3% 24.5% 9.0% +/-0.1 +/-0.1 +/-0.1 22.6% 24.5% 10.1% +/-0.2 +/-0.2 +/-0.2 18.1% 24.4% 8.9% 12.2% +/-0.1 16.3% +/-0.2 11.9% 2.0% +/-0.1 2.4% +/-0.1 2.0% 6.2% 10.5% 2.6% 11.6% +/-0.1 +/-0.1 +/-0.1 +/-0.1 6.4% 10.6% 2.4% 13.1% +/-0.2 +/-0.2 +/-0.1 +/-0.2 6.1% 10.5% 2.7% 11.6% 11/26/2013
- 2. Subject Transportation and warehousing, and utilities Information Finance and insurance, and real estate and rental and leasing Professional, scientific, and management, and administrative and waste management services Educational services, and health care and social assistance Arts, entertainment, and recreation, and accommodation and food services Other services (except public administration) Public administration Total Civilian Noninstitutionalized Population Estimate Margin of Error 4.9% +/-0.1 2.1% +/-0.1 6.6% +/-0.1 United States With a Disability Estimate 5.3% 1.8% 5.2% No Disability Margin of Error +/-0.1 +/-0.1 +/-0.1 Estimate 4.9% 2.1% 6.7% 10.9% +/-0.1 9.8% +/-0.2 11.0% 23.2% +/-0.1 22.6% +/-0.2 23.2% 9.6% +/-0.1 9.3% +/-0.2 9.6% 5.0% 4.9% +/-0.1 +/-0.1 5.9% 5.3% +/-0.1 +/-0.1 4.9% 4.8% COMMUTING TO WORK Workers Age 16 and Over Car, truck, or van - drove alone Car, truck, or van - carpooled Public transportation (excluding taxicab) Walked Taxicab, motorcycle, bicycle, or other means Worked at home 139,833,961 76.4% 9.7% 5.0% 2.7% 1.8% 4.3% +/-122,352 +/-0.1 +/-0.1 +/-0.1 +/-0.1 +/-0.1 +/-0.1 7,165,539 70.2% 12.4% 5.8% 3.4% 2.8% 5.5% +/-44,858 +/-0.3 +/-0.2 +/-0.2 +/-0.1 +/-0.1 +/-0.1 132,668,422 76.7% 9.6% 5.0% 2.7% 1.8% 4.3% EDUCATIONAL ATTAINMENT Population Age 25 and Over Less than high school graduate High school graduate, GED, or alternative Some college or associate's degree Bachelor's degree or higher 204,673,635 13.4% 27.9% 29.3% 29.5% +/-61,542 +/-0.1 +/-0.1 +/-0.1 +/-0.1 32,905,929 25.0% 34.5% 26.4% 14.2% +/-82,592 +/-0.1 +/-0.1 +/-0.1 +/-0.1 171,767,706 11.1% 26.6% 29.9% 32.4% EARNINGS IN PAST 12 MONTHS (IN 2012 INFLATION ADJUSTED DOLLARS) Population Age 16 and over with earnings $1 to $4,999 or loss $5,000 to $14,999 $15,000 to $24,999 $25,000 to $34,999 $35,000 to $49,999 $50,000 to $74,999 $75,000 or more 159,460,549 11.4% 16.6% 15.2% 13.2% 14.8% 14.7% 14.2% +/-116,206 +/-0.1 +/-0.1 +/-0.1 +/-0.1 +/-0.1 +/-0.1 +/-0.1 9,405,956 18.9% 22.8% 16.0% 12.0% 11.8% 10.5% 7.9% +/-50,552 +/-0.2 +/-0.2 +/-0.2 +/-0.2 +/-0.1 +/-0.1 +/-0.1 150,054,593 10.9% 16.2% 15.1% 13.3% 14.9% 14.9% 14.6% 30,211 +/-33 20,184 +/-119 30,660 241,065,292 +/-45,069 34,972,993 +/-86,439 206,092,299 14.1% 9.2% 76.8% +/-0.1 +/-0.1 +/-0.1 22.1% 14.4% 63.5% +/-0.1 +/-0.1 +/-0.1 12.7% 8.3% 79.0% Median Earnings POVERTY STATUS IN THE PAST 12 MONTHS Population Age 16 and over for whom poverty status is determined Below 100 percent of the poverty level 100 to 149 percent of the poverty level At or above 150 percent of the poverty level 2 of 5 11/26/2013
- 3. Subject Population Age 16 and Over EMPLOYMENT STATUS Employed Not in Labor Force Employed Population Age 16 and Over CLASS OF WORKER Private for-profit wage and salary workers Employee of private company workers Self-employed in own incorporated business workers Private not-for-profit wage and salary workers Local government workers State government workers Federal government workers Self-employed in own not incorporated business workers Unpaid family workers OCCUPATION Management, business, science, and arts occupations Service occupations Sales and office occupations Natural resources, construction, and maintenance occupations Production, transportation, and material moving occupations INDUSTRY Agriculture, forestry, fishing and hunting, and mining Construction Manufacturing Wholesale trade Retail trade Transportation and warehousing, and utilities Information Finance and insurance, and real estate and rental and leasing Professional, scientific, and management, and administrative and waste management services Educational services, and health care and social assistance Arts, entertainment, and recreation, and accommodation and food services Other services (except public administration) Public administration United States No Disability Margin of Error +/-97,704 +/-0.1 +/-0.1 +/-123,645 +/-0.1 +/-0.1 +/-0.1 +/-0.1 +/-0.1 +/-0.1 +/-0.1 +/-0.1 +/-0.1 +/-0.1 +/-0.1 +/-0.1 +/-0.1 +/-0.1 +/-0.1 +/-0.1 +/-0.1 +/-0.1 +/-0.1 +/-0.1 +/-0.1 +/-0.1 +/-0.1 +/-0.1 +/-0.1 +/-0.1 +/-0.1 COMMUTING TO WORK Workers Age 16 and Over Car, truck, or van - drove alone Car, truck, or van - carpooled Public transportation (excluding taxicab) Walked Taxicab, motorcycle, bicycle, or other means Worked at home +/-131,288 +/-0.1 +/-0.1 +/-0.1 +/-0.1 +/-0.1 +/-0.1 EDUCATIONAL ATTAINMENT Population Age 25 and Over Less than high school graduate High school graduate, GED, or alternative +/-110,602 +/-0.1 +/-0.1 3 of 5 11/26/2013
- 4. Subject Some college or associate's degree Bachelor's degree or higher EARNINGS IN PAST 12 MONTHS (IN 2012 INFLATION ADJUSTED DOLLARS) Population Age 16 and over with earnings $1 to $4,999 or loss $5,000 to $14,999 $15,000 to $24,999 $25,000 to $34,999 $35,000 to $49,999 $50,000 to $74,999 $75,000 or more Median Earnings POVERTY STATUS IN THE PAST 12 MONTHS Population Age 16 and over for whom poverty status is determined Below 100 percent of the poverty level 100 to 149 percent of the poverty level At or above 150 percent of the poverty level United States No Disability Margin of Error +/-0.1 +/-0.1 +/-123,222 +/-0.1 +/-0.1 +/-0.1 +/-0.1 +/-0.1 +/-0.1 +/-0.1 +/-35 +/-97,027 +/-0.1 +/-0.1 +/-0.1 Data are based on a sample and are subject to sampling variability. The degree of uncertainty for an estimate arising from sampling variability is represented through the use of a margin of error. The value shown here is the 90 percent margin of error. The margin of error can be interpreted roughly as providing a 90 percent probability that the interval defined by the estimate minus the margin of error and the estimate plus the margin of error (the lower and upper confidence bounds) contains the true value. In addition to sampling variability, the ACS estimates are subject to nonsampling error (for a discussion of nonsampling variability, see Accuracy of the Data). The effect of nonsampling error is not represented in these tables. The Census Bureau introduced a new set of disability questions in the 2008 ACS questionnaire. Accordingly, comparisons of disability data from 2008 or later with data from prior years are not recommended. For more information on these questions and their evaluation in the 2006 ACS Content Test, see the Evaluation Report Covering Disability. Industry codes are 4-digit codes and are based on the North American Industry Classification System 2007. The Industry categories adhere to the guidelines issued in Clarification Memorandum No. 2, "NAICS Alternate Aggregation Structure for Use By U.S. Statistical Agencies," issued by the Office of Management and Budget. Occupation codes are 4-digit codes and are based on Standard Occupational Classification 2010. While the 2012 American Community Survey (ACS) data generally reflect the December 2009 Office of Management and Budget (OMB) definitions of metropolitan and micropolitan statistical areas; in certain instances the names, codes, and boundaries of the principal cities shown in ACS tables may differ from the OMB definitions due to differences in the effective dates of the geographic entities. Estimates of urban and rural population, housing units, and characteristics reflect boundaries of urban areas defined based on Census 2000 data. Boundaries for urban areas have not been updated since Census 2000. As a result, data for urban and rural areas from the ACS do not necessarily reflect the results of ongoing urbanization. Source: U.S. Census Bureau, 2012 American Community Survey Explanation of Symbols: 1. An '**' entry in the margin of error column indicates that either no sample observations or too few sample observations were available to compute a standard error and thus the margin of error. A statistical test is not appropriate. 2. An '-' entry in the estimate column indicates that either no sample observations or too few sample observations were available to compute an estimate, or a ratio of medians cannot be calculated because one or both of the median estimates falls in the lowest interval or upper interval of an open-ended distribution. 3. An '-' following a median estimate means the median falls in the lowest interval of an open-ended distribution. 4. An '+' following a median estimate means the median falls in the upper interval of an open-ended distribution. 5. An '***' entry in the margin of error column indicates that the median falls in the lowest interval or upper interval of an open-ended distribution. A statistical test is not appropriate. 6. An '*****' entry in the margin of error column indicates that the estimate is controlled. A statistical test for sampling variability is 4 of 5 11/26/2013
- 5. not appropriate. 7. An 'N' entry in the estimate and margin of error columns indicates that data for this geographic area cannot be displayed because the number of sample cases is too small. 8. An '(X)' means that the estimate is not applicable or not available.