
Recomendados
Más contenido relacionado
La actualidad más candente
La actualidad más candente (20)
Destacado
Similar a IRP tuning fork
Similar a IRP tuning fork (20)
Más de ellenmckay
Último
Último (20)
IRP tuning fork
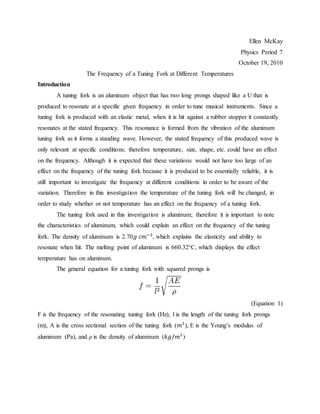
- 1. Ellen McKay Physics Period 7 October 19, 2010 The Frequency of a Tuning Fork at Different Temperatures Introduction A tuning fork is an aluminum object that has two long prongs shaped like a U that is produced to resonate at a specific given frequency in order to tune musical instruments. Since a tuning fork is produced with an elastic metal, when it is hit against a rubber stopper it constantly resonates at the stated frequency. This resonance is formed from the vibration of the aluminum tuning fork as it forms a standing wave. However, the stated frequency of this produced wave is only relevant at specific conditions; therefore temperature, size, shape, etc. could have an effect on the frequency. Although it is expected that these variations would not have too large of an effect on the frequency of the tuning fork because it is produced to be essentially reliable, it is still important to investigate the frequency at different conditions in order to be aware of the variation. Therefore in this investigation the temperature of the tuning fork will be changed, in order to study whether or not temperature has an effect on the frequency of a tuning fork. The tuning fork used in this investigation is aluminum; therefore it is important to note the characteristics of aluminum, which could explain an effect on the frequency of the tuning fork. The density of aluminum is 2.70𝑔 𝑐𝑚−3 , which explains the elasticity and ability to resonate when hit. The melting point of aluminum is 660.32°C, which displays the effect temperature has on aluminum. The general equation for a tuning fork with squared prongs is (Equation 1) F is the frequency of the resonating tuning fork (Hz), l is the length of the tuning fork prongs (m), A is the cross sectional section of the tuning fork (𝑚3 ), E is the Young’s modulus of aluminum (Pa), and ρ is the density of aluminum (𝑘𝑔/𝑚3 )
- 2. Since the Young’s modulus is needed in Equation 1, it implies that temperature has an effect on aluminum and its frequency at resonance. Therefore the Young’s modulus of aluminum needs to be looked at to notice a reason for change in frequency. Figure 1: Young’s Modulus of Different Metals Figure 1 displays the negative linear effect of temperature and the elasticity of aluminum, which is the blue line closest to the bottom of the graph. Therefore from the description of the characteristics of aluminum, Equation 1, and Figure one it can be expected that temperature is negatively linear to the frequency of a tuning fork. This means that as the temperature increases, the frequency will decrease. Design Figure 2: The Middle C (261.1 Hz) Tuning Fork Figure 2 displays the dimensions of the tuning fork used throughout the investigation at different temperatures. Also the blue handle shows the duck tape used as a hand protector.
- 3. First of all, the middle C (261.1 Hz) tuning fork was chosen to be used in order to investigate the various temperatures and their effects on the frequency. The handle of the tuning fork was wrapped with blue duck tape to protect the hand from extreme temperatures, as seen above in Figure 2. A microphone and thermocouple were needed in order to record the frequency and temperature; therefore they were plugged into the computer and displayed through LoggerPro. The microphone was set to record 100000 samples per second for one second, and the thermocouple automatically displays the temperature of the liquid it is placed into. The liquid was then prepared at the various temperatures. In order to reach extremely low temperatures, ethanol and dry ice were placed into a beaker and eventually reached -49°C. Once the temperature was at the desired temperature, the tuning fork was placed into a Ziploc bag, and both were placed into the beaker with the liquid and thermocouple. The temperature was monitored to ensure it was constant, while the tuning fork stayed in the liquid for about two minutes to reach the specific temperature. This process of making the tuning fork a specific temperature was followed throughout the experiment, but the process of making the liquid change temperature was different. The ethanol and dry ice were used in the beaker to reach the temperatures below 0°C, water and ice were used in the beaker to reach temperatures lower than room temperature but higher than 0°C, and water in a kettle were used to reach temperatures above room temperature. After the tuning fork is at the specific temperatures it is taken out of the liquid and Ziploc bag, and immediately hit against the rubber stopper. The collect button is hit on LoggerPro while the microphone is held next to the resonating tuning fork, and the frequency is recorded. After the first frequency is recorded the tuning fork is placed back into the liquid and sits for about two more minutes, and the same process is done in order to record the second and third trials of the frequency. Throughout the investigation the room temperature was for the most part kept constant at about 26°C, and the same thermocouple, tuning fork, and microphone were used in order to record the specific temperatures and frequencies. Also the same Ziploc bag was used to protect the tuning fork from getting wet; therefore did not create an effect on the temperature or resonance of the tuning fork.
- 4. Data Collection and Processing Table 1: The Frequency of the Tuning Fork at Different Temperatures, and the Average Frequency from the Three Trials Frequency (Hz ± 0.7) Temperature of Tuning Fork (°C ± 2) Trial 1 Trial 2 Trial 3 Average -49 266 265 265 265 -25 263 263 263 263 -10 262 262 262 262 10 262 262 262 262 25 261 261 261 261 50 261 261 261 261 81 259 259 258 259 Table 1 displays the frequency of the tuning fork at different temperatures throughout the three trials, and the average frequencies of the three. Figure 3: Sample FFT Graph at 25°C Figure 3 is a sample of how the frequencies were found. The peak frequency function was used on LoggerPro in order to determine the frequency at the specific temperature, after it was recorded using the microphone. There is the instrumental uncertainty, which is the range of the two frequencies found on the peak function. This uncertainty is also what is displayed at the top section labeled frequency in Table 1, and the uncertainty bars on the graph in Figure 4.
- 5. Figure 4: Figure 4 displays the linear fit of the average data recorded from the recorded frequencies of the tuning fork. It shows the negative linear relationship between temperature and frequency; as temperature increases, the frequency increases. Conclusion This investigation raises the conclusion that temperature has a negative linear affect on the frequency of the tuning fork because as the temperature increases, the frequency decreases. However, from Figure 4 it seems as if this idea is only true when the uncertainty of the data is taken into account. Therefore temperature is negatively linear to frequency only to some extent because the uncertainty is quite large, and is the reason for the negative linear effect. This uncertainty is found from the frequencies that were recorded from the microphone, which was ± 0.7 Hz; therefore if the frequencies varied that much there is a chance that temperature would not have a perfect negative linear effect. 𝑓 = (−0.04002 ± 0.00536 𝐻𝑧 𝐶⁄ ) 𝑇 + (262.3 ± 0.230) (Equation 2) This is the final equation of the investigation which is formed from Figure 4 from the slope and y-intercept, which explains the data collected as temperature is negatively linear to the frequency. This equation can also be compared to the Young’s modulus because it states that the
- 6. temperature of aluminum is negatively linear to its elasticity. Therefore it is concluded that the material of the tuning fork was affected by the different temperatures, which in turn resulted in the variation in frequency. There was some uncertainty in the data collected throughout the investigation, but there are understandable reasons for this; therefore the conclusions could be applicable to other investigations and are somewhat certain. There was uncertainty in the time allowed for the tuning fork to adjust to the specific temperatures, and there could have been interference on the recorded frequencies from other sounds in the room. Although there are some uncertainties, this data could be applicable to a similar investigation of tuning forks of the same note and material because of the general negative linear pattern on the final graph. Evaluation The process of recording the frequency of the tuning fork at specific temperatures was not very accurate because the amount of time the tuning fork sat in the liquid, and the amount of the time after it was taken out and hit, varied. This inaccuracy could have had a large effect on the investigation because the tuning fork could lose or receive heat when taken out of the liquid, resulting in different temperatures when recorded, not exactly what the thermocouple read. This could be improved by using a timer to make sure the tuning fork is in the liquid for the exact amount of time. Also the timer could be used to make sure the frequency is recorded at the exact same time, so there would be the same chance of temperature change. Another inaccuracy was the thermocouple because it measured the temperature of the liquid that the tuning fork was in, but did not measure the temperature of the actual metal. This could have been a reason for the uncertainty because if the aluminum tuning fork was not the exact and specific temperature each time, there would be a variation in the recorded frequency. This could also be improved by making sure the tuning fork sits in the liquid for a certain amount of time, or by placing the thermocouple on the tuning fork to record its exact temperature. Although this would create less uncertainty, it would be impossible for the tuning fork to have the exact same temperature each time. Further research could be done in this field by investigating the temperature of tuning forks with different notes, materials, sizes, and shapes. It is expected that there would still be a negative linear relationship no matter the different sizes, shapes, and notes, but it would be interesting to investigate the effect on the frequency of tuning fork of a different material.