

Recomendados
Más contenido relacionado
La actualidad más candente
La actualidad más candente (18)
Destacado
Destacado (20)
Similar a Fact Sheet (updated at November 2013)
Similar a Fact Sheet (updated at November 2013) (20)
Más de Eni
Más de Eni (20)
Último
Último (20)
Fact Sheet (updated at November 2013)
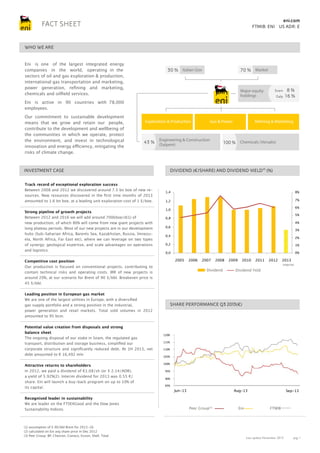
- 1. eni.com FACT SHEET FTMIB: ENI US ADR: E WHO WE ARE Eni is one of the largest integrated energy companies in the world, operating in the sectors of oil and gas exploration & production, international gas transportation and marketing, power generation, refining and marketing, chemicals and oilfield services. 30 % Italian Gov 70 % Market Major equity holdings Snam Galp 8% 16 % Eni is active in 90 countries with 78,000 employees. Our commitment to sustainable development means that we grow and retain our people, contribute to the development and wellbeing of the communities in which we operate, protect the environment, and invest in technological innovation and energy efficiency, mitigating the risks of climate change. Exploration & Production 43 % Engineering & Construction (Saipem) Track record of exceptional exploration success Between 2008 and 2012 we discovered around 7.5 bn boe of new resources. New resources discovered in the first nine months of 2013 amounted to 1.6 bn boe, at a leading unit exploration cost of 1 $/boe. Strong pipeline of growth projects Between 2012 and 2016 we will add around 700kboe/d(1) of new production, of which 80% will come from new giant projects with long plateau periods. Most of our new projects are in our development hubs (Sub-Saharian Africa, Barents Sea, Kazakhstan, Russia, Venezuela, North Africa, Far East etc), where we can leverage on two types of synergy: geological expertise, and scale advantages on operations and logistics. 8% 1,2 7% (1) assumption of $ 90/bbl Brent for 2013-16. (2) calculated on Eni avg share price in Dec 2012 (3) Peer Group: BP, Chevron, Conoco, Exxon, Shell, Total 6% 1,0 5% 0,8 4% 0,6 3% 0,4 2% 0,2 1% 0,0 0% 2005 2006 2007 2008 Dividend Leading position in European gas market We are one of the largest utilities in Europe, with a diversified gas supply portfolio and a strong position in the industrial, power generation and retail markets. Total sold volumes in 2012 amounted to 95 bcm. Recognised leader in sustainability We are leader on the FTSE4Good and the Dow Jones Sustainability Indices. 100 % Chemicals (Versalis) 1,4 Competitive cost position Our production is focused on conventional projects, contributing to contain technical risks and operating costs. IRR of new projects is around 20%, at our scenario for Brent of 90 $/bbl. Breakeven price is 45 $/bbl. Potential value creation from disposals and strong balance sheet The ongoing disposal of our stake in Snam, the regulated gas transport, distribution and storage business, simplified our corporate structure and significantly reduced debt. At 1H 2013, net debt amounted to € 16,492 mln Refining & Marketing DIVIDEND (€/SHARE) AND DIVIDEND YIELD(2) (%) INVESTMENT CASE Attractive returns to shareholders In 2012, we paid a dividend of €1.08/sh (or $ 2.14/ADR), a yield of 5.92%(2). Interim dividend for 2013 was 0.55 €/ share. Eni will launch a buy-back program on up to 10% of its capital. Gas & Power 2009 2010 2011 2012 Dividend Yeld 2013 interim SHARE PERFORMANCE Q3 2013(€) 120% 115% 110% 105% 100% 95% 90% 85% Jun-13 Aug-13 Peer Group(3) Eni Sep-13 FTMIB Last update November 2013 pag. 1
- 2. eni.com FACT SHEET FTMIB: ENI US ADR: E EXPLORATION AND PRODUCTION E&P is our main division. It is currently present in 43 countries and is focused on finding and producing oil and gas. Eni’s strategy is to deliver organic production growth with increasing returns over the medium to long term, leveraging on a high-quality portfolio of assets, exposure to competitive giant projects and long-standing relationships with host countries. Growth will come from a number of key hubs around the world, a strategy which combines geographical diversification with scale benefits and project synergies. More than 75% of our production will come from either onshore or shallow water, with a positive impact in terms of risks and operating costs. Main project start-ups 2012-2015 Beyond 2015 Yaro/Yakhinskaye Urengoskoye Production hubs Skrugard Havis Yevo Severo Goliat Culzean Kashagan EP Jasmine/ W. Franklin Ph. 2 Wafa compression Great Hadrian area MLE CAFC / El Merk Hadrian South Sankofa Gye Nyame Perla FF Junin 5 FT Kashagan Ph 2 Karachaganak Ph. 3 Jangkrik Jau Kutei Basin CBM FF OPL 245 FF Brass LNG Perla EP Junin 5 EP Mamba East Hub 2012 HIGHLIGHTS ALNG Kizomba Sat. Ph. 1 West Hub 1.7 Mboe/d production 7.2 mmboe proved reserves with a life index of 11.5 y. 147% organic reserve replacement ratio € 18.5 B adj operating profit € 10.3 B capex GAS & POWER REFINING & MARKETING G&P is engaged in all phases of the gas value chain: supply, trading and marketing of gas and electricity, gas infrastructures, and LNG supply and marketing. Eni sells more than 60% of its gas outside Italy and its leading position in the European gas market is supported by competitive advantages, including its multicountry approach, long-term gas availability, access to infrastructure, market knowledge, wide product range and strong customer base. 2012 HIGHLIGHTS € 0.35 B adj operating profit € 0.23 B capex 95 bcm gas sold worldwide 15 bcm LNG sold 42,6 Twh electricity sold 10 million customers in Europe, of which 7.5 in Italy ENI IN NUMBERS 2009 Production of oil and natural gas (kboe/d) 1,769 R&M refines and markets fuels and other oil products primarily in Italy and Central-Eastern European countries. Our R&M division is relatively small compared to the R&M segment of our peers. Eni is the largest refiner in Italy and the leading operator in retail marketing of fuels with a market share of around 30%. Eni’s strategy in R&M is to cut costs and enhance margins to return to profitability. 2010 1,815 2011 1,581 2012 HIGHLIGHTS € -0.33 B adj operating profit € 0.84 B capex 38.4 Mtonnes/y capacity 30 Mtonnes throughput 6,300 fuel stations 2012(1) 1,701 1,633 7,128 3,132 Eni adj. operating profit (€ million) 13,122 17,304 17,974 19,753 Capital expenditure (€ million) 13,695 13,870 13,438 12,761 Net debt (€ million) 23,055 26,119 28,032 15,511 Eni adj. net profit (€ million) Net cash flow from operations ( € million) 5,207 11,136 0.46 Leverage 6,869 14,694 0.47 6,969 14,382 0.46 9M 2013 12,433 0.25 9,099 8,984 7,788 15,146 0.24 (1) Following the announcement of Snam divestment, figures are represented as continuing operations LATEST ANNOUNCEMENTS AND ACCOMPLISHMENTS • 05 • 24 • 02 • 19 • 13 • 12 • 11 • 03 • 05 • 01 November October October September September September September September August August CONTACTS 2013 2013 2013 2013 2013 2013 2013 2013 2013 2013 - Eni signs agreement with Quicksilver on unconventional oil onshore US Eni drills successful Evans Shoal appraisal well in Offshore Australia Eni ranked first in survey of Italian Companies’ transparency in anti-bribery programs Eni and SNPC to jointly explore the Ngolo congolese block Eni confirmed in the sustainability FTSE4 Good Index Eni is confirmed in the Dow Jones Sustainability World Index and the Dow Jones Sustainability Europe Index First oil from the Kashagan field has been produced New high impact exploration success in Mozambique Versalis signs technological partnership for hydrocarbon resins to overhaul the Priolo plant Important oil & gas discovery offshore Congo Eni spa Investor Relations - Piazza Vanoni, 1 - 20097 San Donato Milanese (MI) Italy Telephone: +39 02 52 05 16 51 Fax: +39 02 52 03 19 29 Email: investor.relations@eni.com Website: www.eni.com Last update November 2013 pag. 2