
Recomendados
Más contenido relacionado
La actualidad más candente
La actualidad más candente (19)
Destacado
Similar a Slow Your Electric Meter Down
Similar a Slow Your Electric Meter Down (20)
Último
Último (20)
Slow Your Electric Meter Down
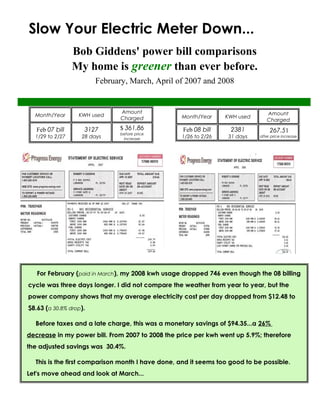
- 1. Slow Your Electric Meter Down... Bob Giddens' power bill comparisons My home is greener than ever before. February, March, April of 2007 and 2008 Month/Year KWH used Amount Charged Feb 07 bill 1/29 to 2/27 3127 28 days $ 361.86 before price increase Month/Year KWH used Amount Charged Feb 08 bill 1/26 to 2/26 2381 31 days 267.51 after price increase For February (paid in March), my 2008 kwh usage dropped 746 even though the 08 billing cycle was three days longer. I did not compare the weather from year to year, but the power company shows that my average electricity cost per day dropped from $12.48 to $8.63 (a 30.8% drop). Before taxes and a late charge, this was a monetary savings of $94.35...a 26% decrease in my power bill. From 2007 to 2008 the price per kwh went up 5.9%; therefore the adjusted savings was 30.4%. This is the first comparison month I have done, and it seems too good to be possible. Let's move ahead and look at March...
- 2. Month/Year KWH used Amount Charged March 07 bill 2/27 to 3/28 1855 29 days $ 209.79 before price increase Month/Year KWH used Amount Charged March 2008 2/26 to 3/27 1898 30 days $ 210.82 after price increase For March (paid in April), I had an increase. This was due to my two week trip to China in 2007. This shows how vacations, business trips, and changes in routine will impact year- to-year power comparisons. My 2008 power usage was for a whole month (in fact, one day longer). Thanks to Pe3, the bill was just $1.03 more than the previous year when I was only home for half a month. Progress Energy's daily cost chart says my cost per day went from $7.23 to $7.03. That's with the aforementioned 5.9% rise in the cost of electricity from 2007 to 2008.
- 3. Month/Year KWH used Amount Charged April 07 bill 2/27 to 3/28 2471 31 days $ 283.44 before price increase Month/Year KWH used Amount Charged April 08 bill 2/27 to 3/28 1891 31 days $ 210.00 after price increase For April (paid in May), my kwh usage dropped 580. This produced a monetary savings of $73.44—a 25.9% decrease before factoring in the 5.9% cost per kwh hike. That's a 30.3% improvement with the cost hike figured in. The power company's cost per day chart showed a drop from $9.45 to $7.24. It would make a huge impact if everyone in Orlando dropped their power consumption by that much. And what if every home in America dropped its consumption by that much?
- 4. Feb to Feb: 3127 to 2381. My home saved 746 kwh... a 23.8% reduction Mar to Mar: 1855 to 1898. My home used 43 kwh more power... a 2.3% increase Apr to Apr: 2471 to 1891. My home saved 580 kwh... a 23.5% reduction Another lesson: The billing rules for my area charge a penny more per kwh after the first 1,000 kilowatt hours that are used each month. Likewise, the fuel surcharge is higher after the first 1,000 kwh. Since the saved power comes off the top, the effect is to bring my average price per kilowatt hour down. Return on Investment: In this first quarter I saved $ 94.35, $ -1.04, and $ 73.44, which totals $ 166.75 for the quarter. If I paid $650.93 (includes shipping and tax) and $ 150 for installation, my investment in this technology would be $800.93. At this rate, my payback will be complete after five quarters. PowerwoRx-e3 has a 10-year Warranty. That gives me 35 more quarters to save $4,681.25 before my warranty runs out. But Pe3 has an expected life of 20 years. Forty more quarters would add $6,670 more of value, for a total return of $11,351.25 after the unit has already paid for itself. It will actually be far better. I won't spend two weeks out of the country every quarter (refer to March analysis). Nor will the cost of electricity stay this low! All in all, an $800.93 investment could produce $20,000 or more of value. That would buy me a new roof. Plus surge protection and less electrical noise. Let's consider the environmental impact in kwh savings: