Removal Strategy _ FEFO _ Working with Perishable Products in Odoo 17
India newopportunity
1. All India Management Association
Excellence in Management
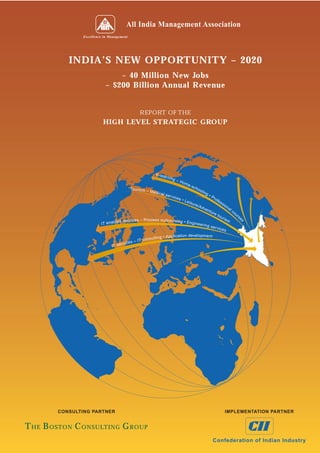
INDIA’S NEW OPPORTUNITY – 2020
– 40 Million New Jobs
– $200 Billion Annual Revenue
REPORT OF THE
HIGH LEVEL STRATEGIC GROUP
E-lea
r ni n
g–
Hom
e-s
Tour ism – cho
Medic oli
al ng
ser v •P
ices ro
• Le fe s
isur sio
e /Ad na
ve n lc
tur ou
et rs
ou
r is es
l ed s e r vic es – Process outsourcing • Engin m
IT enab eer in g ser
vic es
• A p p l i c a t i o n d ev e l o p m e n t
IT co nsulting
r vi ces –
IT se
CONSULTING PARTNER IMPLEMENTATION PARTNER
T HE B OSTON C ONSULTING G ROUP
Confederation of Indian Industry
3. INDIA’S NEW OPPORTUNITY – 2020
- 40 Million New Jobs
- $200 Billion Annual Revenue
REPORT OF THE
HIGH LEVEL STRATEGIC GROUP
4. I N D I A ’ S N E W O P P O RT U N I T Y – 2020
5. Contents
P R E FAC E 1
E X E C U T I V E S U M M A RY 3
Why is this report different? 5
I N T RO D U C T I O N 7
T H E G ROW T H I M P E R AT I V E 11
T H E O P P O RT U N I T Y 13
T H E U N C E RTA I N T Y 21
T H E AG E N DA F O R AC T I O N 30
MAKING IT HAPPEN 34
Marketing India 34
Educating and Training the Indian Workforce 36
Connecting India 40
Sector-Specific Actions 42
CONCLUSION 48
6. I N D I A ’ S N E W O P P O RT U N I T Y – 2020
7. Preface
In an increasingly inter-dependent world, all countries will vigorously pursue
policies to optimise comparative factor endowments. The rapid technological
changes, while making transactions more seamless, will reinforce the process of
global integration. It has been said that the battles of this century will be fought
and won on the “power of ideas.” Societies will increasingly become knowledge-
based and promote knowledge-based industries.
India has a distinct comparative factor advantage as a vast reservoir of skilled
manpower. The demographic differentials reveal that over the next 20-30 years,
India has distinct advantages in a population profile concentrated in the younger
age group, where many new opportunities can be fully optimised.
What are the policies that would enable India to optimise these emerging
opportunities and what should we as a nation do in concert so that we turn out to
be winners and not losers?
With the objective of answering these questions, the All India Management
Association (AIMA) had set up a High Level Strategic Group comprising leaders
from industry, academia, and the government. The results of the deliberations of
the group, involving in-depth interaction with wide segments of society and
decision makers, are contained in this report. A task force comprising AIMA, the
Confederation of Indian Industry, and The Boston Consulting Group has been
constituted to implement the Action Program that has emerged. I have no doubt
that all the stakeholders, including the government, the corporate sector, and
academia, will contribute in the implementation of the recommendations contained
in the report. This will enable India to enhance its growth, secure additional
employment, and maximise the emerging opportunities.
(N. K. Singh)
Member
Planning Commission
Chairman, High Level Strategic Group
P R E FAC E 1
8. I N D I A ’ S N E W O P P O RT U N I T Y – 2020
9. Executive Summary
The steam engine (and its successor, the internal combustion engine) heralded the
industrial revolution that led to economic growth in the West. These engines
required fuel - coal and petroleum. As the industrialised countries exhausted their
own sources of supply they turned increasingly to other sources, which resulted in
the economic growth of the supplying countries, such as the oil producing
countries of the Middle East. This pattern is unfolding again. The growth
paradigm of Western economies requires another kind of fuel – knowledge workers
and skilled professionals. For example, U.S. growth rates of the 1990s are primarily
attributed to productivity increases enabled by a highly skilled workforce. In the
next two decades developed countries will face a shortfall of fuel (skilled
professionals) and once again will have to look towards developing countries to
make up the shortfall.
For India, growth is an imperative. To be counted as a major economic powerhouse
by the end of this century’s first quarter, India needs to accelerate its economic
growth beyond the existing rates of 5-6% per annum. Then only can its citizens,
more than a quarter of whom (~28%) live below the poverty line today, afford
better lifestyles. In addition, at current growth rates India is projected to have a
significant unemployed population (estimates range between 19 and 37 million
unemployed by 2012), the largest share of which will be educated youth. The
unemployment and poverty resulting from inadequate growth will retard other
efforts to place India amongst the top global economic powers. Therefore, the
acceleration of economic growth and the employment of skilled youth in the next
two decades are key concerns for India Inc.
Perhaps, we have for too long looked to others for models of growth. We have
marvelled at the tigers and the dragon and wondered what we could do to copy
their success. But that is denying us our unique place in the world. Perhaps if we
start with our own strengths, we can find an opportunity in our uniquely large and
skilled workforce – an opportunity that distinguishes our model of growth and that
is opening up for India as a result of global developments this report analyses.
While India faces an unemployment crisis, ironically, many countries are projected
to face workforce shortages in the same period due to lower birth rates and an
increase in the proportion of the elderly in their population. While skilled
workforce requirements are increasing in line with economic growth, availability is
not keeping pace, as a result of fewer people entering the workforce and the trend
towards early retirement. Select professions are already witnessing a shortfall (IT
services, medical, education). The workforce shortages (mostly in skilled categories)
E X E C U T I V E S U M M A RY 3
10. I N D I A ’ S N E W O P P O RT U N I T Y – 2020
can slow down economic growth in these countries and have other adverse socio-
economic implications. Adjusting for initiatives taken by governments to manage
this crisis, the High Level Strategic Group (HLSG) estimates a net workforce
shortfall of 32-39 million by 2020 in the developed countries of today.
This challenge faced by some countries presents a great opportunity for some
developing countries, such as India. India can target this shortage by providing
remote services to these countries and also by importing customers and servicing
their needs in India. The contribution of remote services alone, which is the main
focus of this report, will be $133-315 billion of additional revenue flowing into the
country and the addition of 10-24 million jobs (direct and indirect) by 2020.
Further, importing customers into India (medical tourism, educational services,
leisure tourism) could add $6-50 billion in revenue and create 10-48 million jobs
(direct and indirect) by 2020. HLSG estimates that through remote services and
the importation of customers India could enhance year-to-year GDP growth by up
to 1.5% over current growth rates, most of which (~80-85%) would be through
remote services.
India is positioned well against these opportunities given its large pool of qualified
manpower, track record in service delivery in sectors like IT, and lower costs
(specifically in areas such as medical treatment and education services). However,
in order to convert these opportunities into actual revenues, India Inc. will have to
take several initiatives.
HLSG has identified six thrust areas for action to boost demand for India’s services:
t Strengthen India Inc. image/brand
t Focus marketing on select countries with select services
t Build customer credibility
t Promote acceptability of the ‘offshore’ concept
t Improve service experience for customers
t Invest in promoting trials
HLSG has also identified six thrust areas for action to boost supply of India’s
services:
t Develop domain expertise in specific areas
t Reform education and training sector to increase base of skilled professionals
t Strengthen connectivity infrastructure (telecom, IT, airports)
t Promote public-private partnerships
t Form interest groups around opportunities
t Align legal and regulatory structure
4
11. Why is this report different?
Over the last few years, many reports have been written on how to lead India onto
the path of accelerated development. While most reports correctly identify
opportunities and build a coherent roadmap, they often do not result in effective
implementation and hence opportunities are not realized. We would like our report
to stimulate actions towards the goal. Therefore, we have analysed why reports fail
to engage the implementers, and we have used this understanding to shape our
report. We have found that reports that fail to have much impact fall into two
categories:
1. The first category involves a lot of analysis and lays down detailed sets of
instructions for those who have to implement whatever ideas are in the
report. The focus of the process is to first complete the report. Once
completed, such reports often end up on the shelf. The biggest shortcoming
in such cases is that the people who have to implement the instructions do
not fully comprehend what needs to be done and/or do not take ownership of
the task, as they are not involved in its development
2. The second category starts by analysing the situation and outlining broad
themes. However, the follow-up process is not documented well and is largely
unstructured. The driving principle in this case is to provide an idea and
hope that it will work. Here again, the report hits the shelf and gathers
dust.
This report takes a different approach. The approach adopted here rests on two
simple principles, which have been found to be highly effective in situations
involving disparate interest groups:
1. Create an appreciation of the opportunities that exist and prioritise areas
for action
2. Align processes and participants (implementation partners) towards a
common goal
In addition to identifying areas where action needs to be taken, this report provides
a structured framework for key stakeholders to participate in the assimilation of
ideas and development of their implementation plans. The report is the first in a
series of steps necessary to fulfill the overall goal. In the next step, appropriate
agencies will develop implementation plans for the critical areas identified. These
agencies may be inter-departmental task forces for the key areas, or joint industry-
government task forces, or business organisations that pilot and implement projects
to realize the benefits of the opportunities analysed in this report.
E X E C U T I V E S U M M A RY 5
12. I N D I A ’ S N E W O P P O RT U N I T Y – 2020
13. Introduction
The idea of providing professional services to the developed world remotely from
India is not new. However, little analysis has been done so far on the exact nature
of this opportunity and the action steps required to exploit it. The All India
Management Association (AIMA) set up a High Level Strategic Group (HLSG) to
examine these issues. The HLSG comprised leaders from industry, academia, and
the government. The objective of the HLSG was to:
t Identify the opportunities available to Indian companies
t Highlight the need for policy makers to act quickly in view of the urgent
job-creation requirements
t Develop a process that creates alignment between the various stakeholders and
the common goal
A key consideration for the HLSG during the development of this report was its
ability to bring about real change. To this end, the HLSG invested significant time
in understanding the reasons why India, despite having sufficient knowledge of
what needs to be done, often fails to ‘make it happen.’ The collective experience of
the HLSG members suggested that the inability to make things happen faster, with
alignment, is the main reason why India misses opportunities. On further study, it
was felt that the lack of speed was generally a result of an implementation model
that enforces compliance rather than obtaining commitment (Exhibit 1). The
power of commitment amongst stakeholders to relentlessly obtain the desired
outcome cannot be underestimated. Unfortunately, most approaches to implement
change are designed to obtain compliance rather than commitment. As a result, the
energy in the process peters out. To obtain commitment from all stakeholders, the
HLSG embarked on a path that architects and guides the process of involvement
and action using the report as a stimulus.
The chosen approach was based on the analysis of several initiatives, some of them
national in scope, and some within corporations. In almost all cases, the members
reached a similar conclusion – the quality of process has a far greater impact on the
outcome than the amount of detail (recommendations) in the report. Therefore,
the HLSG adopted an approach that entailed the structured involvement of all
concerned stakeholders as opposed to those approaches adopted in the past that
have not been found to be effective (Exhibit 2).
I N T RO D U C T I O N 7
14. I N D I A ’ S N E W O P P O RT U N I T Y – 2020
Exhibit 1
SUCCESSFUL IMPLEMENTATION MODEL – MOVING FROM
COMPLIANCE TO COMMITMENT
Commitment
“Wow! Where do we start? Who else do I know who can help us?”
Genuine Compliance
“What a great idea! What can I do to help?”
Formal Compliance
Compliance
“It's expected – of course I'll do it”
Grudging Compliance
“I wouldn't want to lose my job, now would I?”
Non-Compliance
“Right. Ask me about it again next month.”
Malicious Compliance
“You want compliance? Fine. I'll follow every single little detail in the
rule book faithfully. Let's just see where that gets you!”
Exhibit 2
DIFFERENT APPROACHES TO CONVERT IDEAS INTO ACTION
Approach Driving principle Outcome
Report "Complete report first" In most cases, little
1 "Instructions"
Analysis with action happens, opportunity
to implementers
steps lost, report on shelves
Report "An idea and hope for In most cases, little
2 Unstructured
Analysis with broad the best" happens, opportunity
follow-on
themes lost, report on shelves
Report Structured "Managed, participative Ideas are converted to
3 Analysis with action involvement of process, facilitated by action by implementers
areas actors reports"
HLSG is following the third approach
8
15. We would like to highlight that this report is the first step in a guided process of
developing focused and aligned actions. The report should form the basis for the
second step, which is developing a structured process to align the various
stakeholders and actors. This process should be characterised by dialogue and
analysis within and between the various groups, and should lead to self-developed
action plans. Thereafter, it is desirable to have an agency or process to periodically
review and coordinate actions because the plans and actions of the various groups
in their respective areas can reinforce each other (Exhibit 3).
Exhibit 3
PLANNED APPROACH – FROM “REPORT” TO IMPLEMENTATION
“REPORT” GUIDED PROCESS IMPLEMENTATION
FOR ALIGNMENT AND
DETAILED ACTIONS
• Opportunity • Task forces for • All agencies
• Areas for action critical areas concerned
• Nature of action • Dialogue and • Monitoring and
• Process for analysis triggered co-ordination
engaging actors by report process
and obtaining • Integration
alignment process
HLSG role Hand over to appropriate agency
An analysis of several policy-change programs undertaken by the government
suggests three catalysts for implementation:
t Strong support from influential people who drive the agenda and clear away
roadblocks (e.g. PMO/FM, respected bureaucrats)
t Dynamic leadership from bureaucrats who take ownership to carry the process
to conclusion
t Continuous external pressure on the government for action as well as advice
on the way forward from industry associations and companies
I N T RO D U C T I O N 9
16. I N D I A ’ S N E W O P P O RT U N I T Y – 2020
On the other hand are several factors that deter successful implementation. These are:
t Lack of alignment within government (politicians and bureaucrats) on core
guiding principles for action
t Lack of involvement of all concerned ministries at planning stage
t Lack of agreement on implementation plan - leading to coordination
problems across various entities
t Lack of continuity and accountability of key bureaucrats
t Lack of systematic involvement/push from companies and industry
associations
t Mismatch between the requisite skills for the job and allocation of
responsibility
t Requirements for significant funding from the government
The results of the deliberations of the HLSG, supplemented by contributions from
many others, are contained in this report. The report describes:
t Growth imperatives for India
t Nature and size of opportunity from remote servicing and importing
customers
t Potential areas for action
t Industry-specific action steps for central and state governments and Indian
companies
A task force comprising AIMA, the Confederation of Indian Industry (CII), and
The Boston Consulting Group (BCG) has been constituted to orchestrate the
engagement of ‘India Inc.’ – officials from central and state governments and
business leaders – to work together and realize the opportunities for India that the
HLSG has analysed.
10
17. chapter one
The Growth Imperative
The Indian economy gained fresh momentum with the liberalisation ushered in by
the government in 1991. The average GDP growth rate climbed to nearly 6%
during the 1990s, compared to a tepid 4% for the first 40 years since independence.
However, despite the gains made post-liberalisation, India still has a long way to go.
More than a quarter of its population still lives below the poverty line. Its GDP
per capita (non-PPP adjusted) fares poorly against other nations with comparable
backgrounds (Exhibit 4).
Exhibit 4
POVERTY AND GDP PER CAPITA IN INDIA
Despite improvements, a large share of India's GDP/capita far lower than other countries in
population still below the poverty line the region – 2002
% population below the poverty line GDP/capita ($/person)
12,000
40 10,479
36
10,000
30 28 8,000
6,000 5,024
20 4,000
2,476
1,831
2,000 985 944
430
10
0
South Thailand China India
0 Korea
Malaysia Russia Indonesia
93-94 99-00
Source: National Sample Survey; World Economic indicators – IMF; BCG analysis
The spurt in the years immediately following liberalisation appears to have
slackened and GDP growth is reaching a plateau at 5-6%. The current
developmental problem facing India is exacerbated by the changing demographic
profile of the country. At current rates, anywhere between 19 and 37 million
people will be unemployed by 2012, the largest chunk of which will be amongst
the educated youth. Therefore, the need for strong, accelerated economic growth is
now more acute than ever.
The solution to accelerating India’s economic growth should keep in mind the
current realities of the Indian economy. In view of the limited investment ability
T H E G ROW T H I M P E R AT I V E 11
18. I N D I A ’ S N E W O P P O RT U N I T Y – 2020
of the government, low Foreign Direct Investment (FDI) and relatively low level of
exports compared to the size of the economy, a solution that leverages the wide
availability of human capital, rather than the limited financial capital, is more likely
to succeed (Exhibit 5).
Exhibit 5
CHALLENGES AND OBJECTIVES OF GROWTH PLAN
Traditional options to stimulate growth may not Economic growth should address the problem
be feasible/sustainable of unemployment...particularly of skilled youth
Pump priming # of unemployed people in India (Mn)
• Limited ability for further investments
40 37
- Indian central and state governments
Largest share of
combined fiscal deficit ~10% of GDP 35 unemployed are youth
(~$50 billion) in 2001-02 with secondary/college
30 education 26
Foreign Direct Investment (FDI)
• India attracts a very small share 25
- India - $4 billion vs. China - ~$40 billion
20
Exports 19
15
• Only ~14% of GDP 16
• Limited success in manufactured goods and 10
commodities 9
5 7.4 7.9
0
1994 1997 2000 2007E 2012E
Note: Range of unemployment estimates due to differences in assumptions for growth in labour force; usual principal and subsidiary
measure of unemployment is used
Source: Statistical Outline of India; Report of the task force for employment opportunities (Planning Commission, July 2001);
CMIE; IMF; BCG analysis
In the next chapter we describe opportunity areas that could provide solutions to
India’s developmental challenge.
12
19. chapter two
The Opportunity
While India struggles with a burgeoning population of educated youth, the rest of
the world, especially developed countries, faces a shortage of working-age people,
caused largely by lower birth rates and an ageing working population. While the
requirement for skilled workers in these markets is increasing in line with
economic growth, the availability of skilled people simply isn’t keeping pace. In
professions like IT services, medicine, and education, the problems are already
beginning to be felt.
Exhibit 6 provides a snapshot of the potential labour shortages and avenues of
supply in 2020. In addition to developed countries, even developing countries such
as China and Russia will have a workforce shortage.
Exhibit 6
POTENTIAL SURPLUS POPULATION IN WORKING
AGE GROUP – 2020 (MN)
Germany -3
U.K.
-2 Czech Russia
Republic
Ireland 0 -6
-1 Turkey
-17 Iraq 2 China
France -3
U.S.
2 Israel Pakistan -10 -9 Japan
Spain -3 -2 0 5
3 19 7 Philippines
Italy Iran
5 4 47 Bangladesh
Egypt
Mexico India 4
Vietnam
1
Malaysia
3 5
Indonesia
Brazil
-0.5
Australia
Note: Potential surplus is calculated keeping the ratio of working population (age group 15-59) to total population constant
Source: U.S. Census Bureau; BCG analysis
For the developed world, these shortages present a huge challenge, as they can slow
down economic growth. And they can have other adverse effects. For instance,
t Demand-supply imbalances caused by workforce shortages will increase wage
rates, reducing the competitiveness of these countries
T H E O P P O RT U N I T Y 13
20. I N D I A ’ S N E W O P P O RT U N I T Y – 2020
t Pressure on the existing social security and pension systems will increase as a
significantly larger percentage of retired population has to be supported by a
smaller percentage of working population
Some countries already recognize the shortage of workers as a potential problem
(Exhibit 7).
Exhibit 7
RECOGNITION OF WORKFORCE-SHORTAGE PROBLEM
“...spurred by the retirement of more than 61 million workers in the next 30 years, workforce will be
short of almost 5 million workers by 2011 and almost 36 million workers by 2031...”
- Ed Potter, President, US Employment Policy Foundation
The American Workplace Report 2001: Building America's Workforce for the 21st Century
“Germany would have to bring in 1.2 million immigrants annually if Europe's biggest economy and
world's third largest economy hopes to avoid a crippling long-term labour shortage due to the ageing
of its own work force."
- German Institute of Economic Research, 2001
“By 2003 the U.K. will lack 300,000 skilled IT workers, causing a significant cost to businesses'
productivity. This skills gap is forcing up the average salary of a skilled IT Manager to over £70,000 -
a cost that many small and medium-sized businesses struggle to justify”
- European commission research, 2000
“...ageing of society is the biggest problem facing Japan.....Japan would need 600,000 immigrants a
year to make up for the shortfall in its workforce later this decade”
- The Guardian, U.K., Aug 2, 2001
Source: Literature search
Several of these governments have initiated measures to manage the crisis and
minimise its impact. However, these measures will only reduce workforce
shortages, not eliminate them. Also, the outcome of several of these measures is still
uncertain (Exhibit 8).
Even after adjusting for government actions, we estimate that the net workforce
shortage in developed countries will range between 32 and 39 million by 2020.
Amongst such nations, the U.S., Japan, Spain, Canada, and the U.K. are expected to
face the largest shortages (Exhibit 9).
14
21. Exhibit 8
PROPOSED ACTIONS BY DEVELOPED COUNTRIES
Several actions being talked about ...however, effectiveness of these measures
by developed countries... yet unclear
Encourage people to retire later Study by the UN for Germany concluded that steps to
manage workforce shortages through increase in
retirement age would be “unrealistic and unpopular”
Increase incentives to women to join the Due to increasing affluence levels, rate of growth of
workforce women in the workforce declining. In the U.S., the growth
in the last 3 years was only 0.13% p.a.
Increase rate of immigration into the country Increase in immigration over historical rates already
modelled in future population composition. Dramatic
shifts in policy unlikely due to social tensions expected
from such moves and tighter immigration policies due to
the impact of terrorist events like 11 September 2001
Increase productivity through levels of automation Only 13.5%(1) of all service jobs are amenable to
automation. Additionally, automation also tends to
generate employment when efficiency gains are
reinvested for growth
(1) “Digital Automation and the New Workforce”, The Progressive Policy Institute, April 2000
Source: Literature search; BCG analysis
Exhibit 9
WORKFORCE SHORTAGES IN DEVELOPED COUNTRIES
Range of net workforce shortages in Countries projected to have maximum work
developed countries (2020) force shortages (2020)
People (Mn) People (Mn)
Range of net shortfall
39 16
40
8.2-14.3
32 14
30 12
10
20 8
6 1.0-3.8 1.3-3.3
1.1-2.8
10 4 2.4-2.6
2
0 0
Minimum Maximum US Japan Spain Canada UK
Ranges vary based on demand for labour (driven by economic growth) and actions taken by countries
to manage shortfall (automation, increase in participation rates, etc.)
Source: United Nations; US Census Bureau; OECD; BCG analysis
T H E O P P O RT U N I T Y 15
22. I N D I A ’ S N E W O P P O RT U N I T Y – 2020
The challenge faced by other nations presents an opportunity for India. With its
large population of educated youth, India can provide a host of services to such
countries. These services fall into two broad categories:
1. Professional services to the world provided remotely from India – IT services,
IT enabled services, telemedicine, e-learning, etc.
2. Customers serviced in India (import of customers) – special service tourism
(health care, education services), leisure tourism, etc.
The potential revenue from these two opportunities is huge. By 2020, India Inc.
can hope to generate $139-365 billion of additional revenue from these
opportunities, pushing the GDP growth rate by an additional 0.6-1.5% between
2002-20 (Exhibit 10). The resultant employment generation (direct and indirect)
can be in the range of 20-72 million by 2020 (Exhibit 11). We will explain in later
chapters the uncertainties that result in a range of outcomes and also actions within
our control to realize the highest possible outcomes.
Remote services alone can contribute $133-315 billion in revenues to the Indian
economy by 2020. The resultant employment creation (direct and indirect) will be
in the range of 10-24 million jobs by 2020. Starting with simple services, such as
call centers targeted at corporate clients, Indian providers can evolve to providing
more complex services to corporations and also targeting individuals as potential
customers (Exhibit 12).
The second opportunity, importing customers into India, has the potential of
generating $6-50 billion of revenues and creating between 10 and 48 million jobs
(direct and indirect) by 2020. Purely from an economic perspective, the
fundamentals for this business are strongly in India’s favour. The cost of medical
treatment and educational services in India is a fraction of the cost in developed
countries (Exhibit 13). Several Indian health care providers are already tapping into
this opportunity by serving customers from the Middle East. Exhibit 13 illustrates
a list of medical services that can be offered to foreign customers. In the area of
leisure tourism, India currently has an insignificant share of global tourist arrivals.
Clearly, there is large, untapped potential in this area waiting to be harnessed by
India Inc.
The categories of services that can be provided by India Inc., by remote servicing
and importing customers into India, are listed in Exhibit 14. India’s potential
strength of human capital can give it a competitive advantage in these service areas.
Not only does India have the largest pool of manpower, it also has the highest
quality of people according to international agencies (Exhibit 15).
16
23. Exhibit 10
IDENTIFIED OPPORTUNITIES – REVENUE AND IMPACT
ON GDP GROWTH
Annual revenue of ~$139 Bn to $365 Bn(1) ~0.6-1.5% additional GDP(2)
for India Inc. by 2020 growth (year-on-year) between 2002–2020
$ Bn (real) Average additional GDP growth over
existing base line growth (% y-o-y)
400 365 2.0
350 Maximum
potential(3)
1.5
300 1.5
250
200 1.0
159
150
Minimum 0.6
105
100 potential(3)
0.5
139
50 83
7 52
0 0
2000 2005 2010 2020 Min potential Max potential
(1) 87% from remote services, 13% revenues from special services and leisure tourism in the optimistic scenario
(2) Base line GDP growth till 2020 assumed as 5.5% (average growth between 1990-2000)
(3) Range based on potential scenarios of world in 2020 and action taken by India to capture the opportunity – discussed subsequently
Note: Estimates do not include potential shortages in China, Russia, Mexico and smaller developing countries.
These countries will be sources of supply
Source: NASSCOM; CII; WTTC; CMIE; Literature search; BCG analysis
Exhibit 11
IDENTIFIED OPPORTUNITIES – EMPLOYMENT GENERATION
Additional employment generation for Employment generation will be across
~20 Mn to 72 Mn(1) people by 2020 skill and income levels
Number of people (Mn)
100
72
Skilled
Maximum professionals
80 potential(2)
60 40
50% 50%
40
22
Unskilled
20
Minimum service jobs
14 20 potential (2)
6 10
0
2000 2005 2010 2020
(1) 67% jobs from special services and leisure tourism, 33% from remote services in the optimistic scenario
(2) Range based on potential scenarios of world in 2020 and action taken by India to capture the opportunity – discussed subsequently
Note: Estimates do not include potential shortages in China, Russia, Mexico and smaller developing countries. These countries will be
sources of supply
Source: NASSCOM; CMIE; WTTC; Literature search; BCG analysis
T H E O P P O RT U N I T Y 17
24. I N D I A ’ S N E W O P P O RT U N I T Y – 2020
Exhibit 12
WORLDWIDE DEMAND FOR AND ILLUSTRATIVE LIST OF
REMOTE SERVICES
Demand for outsourced services will further Illustrative list of remote services
increase due to drivers related to ageing in the future
Worldwide remote services market
(US $ Bn) Back office Supply chain
services management
1,600 Corporates • E.g. Call • E.g. Logistics
• Demand due to ageing
1,400 centers management
• Shortages of
working population
1,200 Buyer of
• Additional cost
1,000 • pressure due to services
ageing population “Do it yourself” Professional
800 tips advisory
• Current drivers Individuals • E.g. Tele- services
600 •
• Cost pressure plumbing • E.g. Tele-
•
400 • • Desire to maintain medicine
• focus on core
200 Simple Complex
business
0 • • Skill shortages in Nature of services
1998 2005 2010 2015 2020 specific areas
Note: Actual size of market could vary under different scenarios; average numbers used here for simplicity
Source: IDC; NASSCOM; U.S. Census Bureau; BCG estimates; BCG analysis
Exhibit 13
COST ADVANTAGE AND ILLUSTRATIVE LIST OF MEDICAL SERVICES
Opportunity in special services tourism due to Select examples of medical services being offered
significant cost benefits, partially driven by shortages in India under a “medical tourism” package
Example : Relative cost of dental treatment in Complete dental treatment
(%)
India compared to the U.S.
100 Complete eye care treatment
Orthopaedics and trauma
80
Cardiac care including surgery
60
Urology including endourology
40 Neurosurgery
35-40%
20-25% Plastic and cosmetic surgery
20 20%
<3% Laparoscopic surgery
<5%
0 Gastroentrology
Tooth Glass Root Dentures Full Mouth
Filling Ceramic Canal Rehabilitation Kidney transplant
Crown
Source: The Times of India; Literature search
18
25. Exhibit 14
SERVICES TO BE OFFERED BY INDIA INC.
Channels of Services
Remote servicing ‘Importing’ the customers
Telemedicine Tourism
• Medical tourism, spiritual tourism, adventure
D-I-Y support tourism, etc.
• Tele-plumbing • “Dollar” shopping centres
• Auto repairs - duty-free shopping zones
• Tax advisory services
• Horoscope reading Education
Individuals • ... • Higher education for developed and developing
countries
E-learning • Training courses revolving around India’s heritage
• Home-schooling – Ayurveda, cuisine, yoga, etc.
• Adult professional courses – re-skilling
Nursing houses and retirement services
Personal privacy services – providing server space • Ashram model
to individuals for record maintenance • Settlements near university towns
Targets IT services Tourism for corporate clients
• IT consulting
• Software application development Education services for corporate clients
• Knowledge networking
IT enabled services
• Data analysis and database consulting
• HR & admin outsourcing
• Digital media and content development (E-learning
content, publishing, entertainment, etc.)
Corporates • CAD/CAM design
• Animation
• Bio-informatics
• Off-shore financial services
• Real-estate management – security services
Others
• R&D across industry verticals – semiconductor
technology, drug research, etc.
• Legal/advisory services for MNCs
Source: Interviews; Literature search; BCG workshop; BCG analysis
Exhibit 15
INDIA’S COMPETITIVE ADVANTAGE VIS-A-VIS OTHER NATIONS
Quantity and quality of manpower
Surplus
India
Indonesia
Turkey Philippines
Projected Mexico
Brazil Malaysia
workforce Israel
in 2020 Ireland
Russia
China
Shortfall
Low People strength High
• Productivity/quality
• Cost
• English language skills (1)
(1) Over 50% of shortages expected from English-speaking countries
Note: Pakistan, Bangladesh and Vietnam have not been represented for lack of reliable data on productivity and cost of service employees
Source: World Competitiveness Yearbook 2001; Britannica Yearbook; Literature search; BCG analysis
T H E O P P O RT U N I T Y 19
26. I N D I A ’ S N E W O P P O RT U N I T Y – 2020
While availability of a large, well-qualified human resource pool is definitely an
advantage, winning in the competitive global marketplace would require several
initiatives by India Inc. In Chapters 4 and 5, we shall discuss these initiatives in
greater detail. But first we should identify the potential pitfalls and uncertainties
that stand in the way of India realising this opportunity. An understanding of the
global scenarios will guide our appreciation of the strategic actions required. The
scenarios and uncertainties are discussed in the next chapter (Chapter 3).
20
27. chapter three
The Uncertainty
Single-point forecasts are most likely to be wrong when there are many
uncertainties. We cannot predict exactly what revenues and employment India can
generate from the opportunity described in the previous chapter. But we can and
should understand the principal causes of the uncertainty so that we can take
actions, wherever feasible, to improve the outcome. The revenues and employment
in India depend on two principal factors. The first is the size of the global market
for remote services and tourism. The second is India’s share of the global market.
Exhibit 16 describes the sources of uncertainty underlying these two factors.
Exhibit 16
UNCERTAINTY AROUND SIZE OF OPPORTUNITY AND
INDIA’S SHARE
Sources of uncertainty
Change in economic (GDP) growth rate impacts size of the opportunity
• Workforce requirements
• IT spending by corporates/Government
• International tourist arrivals (special service needs,
leisure tourism) Global market
for remote
Uncertainty around outcome of action taken by countries to services and
negate impact of ageing tourism
• Increased male, female participation rates
• Increased retirement ages
• Increased levels of automation
• Increased immigration
Market share impacted by intensity of action taken by India
Inc. in various areas such as
• Building India Inc. brand India’s share of
• Education infrastructure the global
market
• End user experience of services
• Appropriate legal and regulatory policy
Source: BCG analysis
Let us understand the principal causes more carefully. They are:
Decline in economic growth rate of the targeted countries, resulting in
t Decrease in workforce requirements
t Reduced IT spending by companies and governments
t Slowdown in tourist arrivals in India (for special service needs, leisure
tourism)
T H E U N C E RTA I N T Y 21
28. I N D I A ’ S N E W O P P O RT U N I T Y – 2020
Reduction in workforce shortage due to success of actions taken to negate the impact of
ageing in these countries. Such actions include
t Increased participation of women in the workforce
t Increase in retirement age
t Increased levels of immigration
t Increased automation of services
Lower share captured by India in the global remote servicing and tourism (medical or
leisure) business, caused by
t Poor brand perception of India
t Shortage of qualified workforce due to poor education system
t Unsatisfactory experience of customers with quality of services from India
t Delays and inefficiencies due to inadequate legal and regulatory infrastructure
There are three additional parameters that can affect India’s share adversely. These
are labour productivity, the perceived stability of government policies, and
perceived operational risk. On these parameters, India compares unfavourably with
China and Mexico, its closest competitors (Exhibit 17).
Exhibit 17
INDIA’S PERFORMANCE AGAINST COMPETING NATIONS
Parameter India Indonesia China Mexico Philip- Russia
pines
Availability of workforce-
quantity
Availability of skilled
workforce
Cost of labour
English-language skills
Cost and quality of telecom
infrastructure
Labour productivity
(PPP)(1)
Perceived stability of
government policies
Perceived operational risk
• Risk of personal harm
• Risk of business
disruption
Very favourable Unfavourable
(1) Labour productivity for India highest in IT services vis-a-vis competing nations
Note: Russia and China included as they will compete in specific areas despite aggregate shortages; Israel and Ireland
not included because they are not expected to be significant competitors due to lack of manpower
Source: World Competitiveness Yearbook 2001; Britannica Yearbook; BCG analysis
22
29. Although India cannot control or influence some of the causes of uncertainty, such
as the growth rate of targeted countries, it can improve the quality of its services
and the brand perception of India.
We cannot predict with certainty, for reasons explained, the exact size of the global
market or India’s share. However, we can anticipate reasonable ranges for these
variables. The combinations of the possible ranges result in four alternative
scenarios (Exhibit 18).
Exhibit 18
POTENTIAL SCENARIOS FOR OVERALL OPPORTUNITY
Large global market for remote
services and tourism
“Paradise Lost” “Top Guns”
1
3 2
Small share of Large share of
global market global market
captured by India “If Tomorrow Comes” “God of Small Things” captured by India
Small global market for remote
services and tourism
A brief description of the four scenarios follows.
T H E U N C E RTA I N T Y 23
30. I N D I A ’ S N E W O P P O RT U N I T Y – 2020
Scenario One
“Top Guns”
August 15, 2020
India: Top Guns
Despite a recession at the beginning of the
century, developing countries have posted healthy
economic growth rates over the last 15 years.
1 These growth rates were maintained despite the
3 2
ageing of the population in the developed world
by harnessing energies of younger people in
developing economies. The economic prosperity has also resulted in the global tourism
industry registering strong growth.
Realising the potential size of the opportunity in 2002, India put in place initiatives to tap
it despite the uncertainty associated with the future. As part of its plan, India Inc.
positioned its brand as a credible and value-for-money service provider, focused marketing
efforts on select countries, and worked on improving the service experience of its customers.
Enabling legal and regulatory frameworks were established, infrastructure was strengthened
and the education system was reformed.
India’s preparedness reaped strong results. India has posted ~8-10% p.a. growth in the last
15 years. Corporations from developed countries that are outsourcing to India have
developed leaner cost structures and higher service levels compared with competitors who used
local higher-cost and older resources. The early successes of outsourcing have further
increased the growth of remote services and strengthened India’s image as the most favoured
destination for outsourcing services; additionally, the action steps taken by India Inc.
significantly increased its share of special-service tourist arrivals. Today, developing countries
quote India Inc. as a case study on ‘breakthrough growth and economic development.’
24
31. Scenario Two
“God of Small Things”
August 15, 2020
India: God of Small Things
Developed countries witnessed sluggish growth in
the past 15 years. The growth could have been
further reduced had the developed countries not
outsourced services to the developing countries.
Outsourcing not only helped reduce costs but
also helped in overcoming the challenge of
workforce shortage, due to an ageing population.
India, because of its proactive action in fields such as building a strong brand image,
improving the service experience of its customers, establishing appropriate legal and
regulatory framework, and reforming the education system, was well positioned to tap this
opportunity. However, so were some other countries like China, Russia, Mexico and
Philippines. This led to fierce competition to obtain a large piece of a relatively small
market. Additionally, India Inc. took significant efforts to expand the market: outsourcing
was positioned to the developed world as the best option to boost competitiveness and
increase economic growth, and standards were set to exceed customer expectations.
This proactive approach has reaped benefits. Though the market is not as large as projected,
India has emerged as the preferred destination for outsourcing services as well as an
attractive destination for medical and leisure tourism. The initiative has helped India reduce
unemployment rates to some extent and achieve 6-7% economic growth. Additionally,
Indian companies are ready to capitalise on the opportunity when the developed world
witnesses higher economic growth.
T H E U N C E RTA I N T Y 25
32. I N D I A ’ S N E W O P P O RT U N I T Y – 2020
“Paradise Lost” Scenario Three
August 15, 2020
India: Paradise Lost
The recession at the beginning of the century did
not last long and the developed countries posted
healthy economic growth rates over the last 15
years. The growth coupled with an ageing
workforce resulted in corporations and
individuals resorting to outsourcing services to
developing countries. The higher incomes also resulted in the global tourism industry
registering strong growth.
Realising the potential size of the opportunity, China, Russia, Brazil, and Indonesia geared
themselves early to capture a substantial share. They seized the most lucrative opportunities
and established their credentials as a reliable provider. However, India could not harness its
huge manpower to tap the attractive remote service segments, nor increase its share of tourist
arrivals. The opportunity was often discussed, task forces launched, reports written, however,
nothing significant reached the stage of successful implementation.
There are examples of small organisations and individuals within India who, against all
obstacles, have reaped some benefit from this opportunity – but these are few and far
between. Amidst rising social tensions created by a large base of educated, unemployed
youth, India stands on the sidelines watching other developing countries move rapidly
towards economic prosperity.
26
33. Scenario Four
“If Tomorrow Comes”
August 15, 2020
India: If Tomorrow Comes
The developed countries have witnessed slow to
mediocre growth rates in the past 15 years. The
market for outsourcing of services has also been
small, as workforce shortages have been lower
than projected and the developing world has not
been able to create a compelling value
proposition to make outsourcing the preferred mode of managing shortages. Hence, only
nonessential activities are being outsourced to developing countries. Some developing
countries are working on strengthening their value propositions so that outsourcing could
witness higher growth rates in the future.
India is not in the consideration set for most customers since it is no longer reputed to be a
value-for-money provider of remote services vis-à-vis other developing countries. Tourist
inflow into India has kept pace with growth in world tourism. However, India is still
perceived as a tourist-unfriendly, dirty, and ‘difficult’ country to visit, and not a tourist
destination for the elderly.
As a result, India in 2020 is a shade worse off economically than in 2000. While growth
has been 4-5% p.a., unemployment has reached catastrophic proportions and is the primary
cause of social unrest. India Inc. is still struggling to understand why it has not been able
to take advantage of the opportunity identified as early as 2002 and is searching for
dynamic leadership to show it the way ahead.
T H E U N C E RTA I N T Y 27
34. I N D I A ’ S N E W O P P O RT U N I T Y – 2020
Depending on which scenario materialises, the size of business and employment
generation that India Inc. can expect to achieve would vary. Exhibits 19 and 20
outline the distribution of revenue potential and employment generation across the
four scenarios. In Exhibit 19, total revenue is split into two categories: i) revenue
from remote services (column 2 and 3), and ii) revenue from importation of
customers (column 4). Revenue from remote services is further broken down into
two buckets. The first bucket (column 2) represents revenue that will accrue from
business opportunities based on current drivers, such as desire to focus on core
business, need to manage costs, and shortages in specific skill sets. These business
opportunities, e.g., software development and IT Enabled Services (ITES), are
already available and will grow rapidly over time. The first bucket, therefore,
represents the growth in these services. The second bucket (column 3) is revenue
that will accrue from opportunities created as a result of the shortage in the
workforce, caused due to ageing of the working population. A similar classification
has been made in Exhibit 20, which represents employment creation.
Exhibit 19
DISTRIBUTION OF REVENUE BY SOURCE OF OPPORTUNITY IN
2020 ($ BN REAL)
Import of
Remote services customers
Due to current Due to future Healthcare
Scenario education, Total
drivers(1) driver: ageing(2) tourism(3)
Top Guns 110 205 50 365
Paradise Lost 60 111 9 180
73 171 33 277
God of Small Things
40 93 6 139
If Tomorrow Comes
(1) Offshore-able component of IT Services market ~$190-235 Bn in 2008 (overall IT services market $600-730 Bn); IT enabled services
$142 Bn in 2008. Long term growth rate due to current drivers (2008-2020) assumed as 3-5%; Market share range of ± 30% from
market share projections made by NASSCOM
(2) Net shortfall of working population 32-39mn; India’s share 12-22%; average hourly wage rate $12 in real terms – conservative
compared to current rates due to expected increase in competition
(3) Worldwide international tourist growth 4-7%; India’s market share 0.4-2.0%; Revenue/Tourist will be $1230, same at current level.
Education, healthcare is less than 5% of total opportunity under import of customers
Note: Current drivers are desire to focus on core business, need to manage cost, shortages in specific skill sets
Source: NASSCOM; CII; WTTC; Literature search; BCG estimates; BCG analysis
28
35. Exhibit 20
DISTRIBUTION OF DIRECT EMPLOYMENT CREATION BY
SOURCE OF OPPORTUNITY IN 2020 (MN JOBS)
Import of
Remote services customers
Due to current Due to future Healthcare
Scenario education, Total
drivers(1) driver: ageing(2) tourism(3)
Top Guns 3 9 24 36
Paradise Lost 1.5 4.5 7 13
2 7 21 30
God of Small Things
1 4 5 10
If Tomorrow Comes
Additionally, opportunity will create indirect employment equal to the direct employment generation
(1) NASSCOM projections taken as base case; ratio of India Inc. revenues/employment creation kept constant for projections
under different scenarios
(2) India share of shortfall 12-22%; average billing rates $12 per hour – conservative compared to current rates due to expected
increase in competition
(3) Ratio of international tourists/direct employment creation changes from 1 in 2002 to 0.6 in 2020
Note: Current drivers are desire to focus on core business, need to manage cost, shortages in specific skill sets
Source: NASSCOM; CII; WTTC; Literature search; BCG estimates and analysis
In the next two chapters, we will discuss critical areas that the central and state
governments, and companies should concentrate on to obtain the most benefit from
the available opportunities.
T H E U N C E RTA I N T Y 29
36. I N D I A ’ S N E W O P P O RT U N I T Y – 2020
chapter four
The Agenda For Action
We have identified the critical areas that Indian planners and companies should
concentrate on to a) increase India’s attractiveness to foreign customers (increase
demand), and b) prepare Indian companies to effectively service this demand
(expand supply to meet demand).
Six areas to boost demand are:
t Market India by building a credible, unique positioning for India Inc.
brand – Build a powerful and unique positioning for the brand (reliable, safe,
value-for-money, tourist-friendly). Establish credibility by managing concerns
about operational risk (dispute with Pakistan, etc.)
t Focus marketing effort on select countries and services – Identify the
largest and most lucrative markets for services. Market specific services to
these countries
t Build credibility with customers through partnerships – Overcome the
hurdle of credibility with potential customers by building partnerships with
well-established service providers in those markets (leverage partners’
customer relationships to create own client base and establish brand equity)
t Promote acceptability of the offshore concept – Educate customers, e.g.,
demonstrate to recruiting agencies and HR departments of corporations the
effectiveness of e-learning vis-à-vis brick-and-mortar models. Work with
industry associations and governments of other countries to introduce policy
changes that will recognise remote services at par with brick-and-mortar
models
t (For inbound tourism) Improve the service experience – Understand
areas of dissatisfaction with service quality in the identified opportunities,
e.g., acceptable service levels at international airports
t Promote initial trials – Devise low-cost and low-risk programs and schemes
that induce individuals and corporations to try out services and enable
refinement of business models, e.g., offer free medical advice initially to
promote telemedicine
Six areas to boost supply are:
t Develop domain expertise – Acquire new business skills that firms may not
have at present, e.g. e-learning firms need to know principles of courseware
design, organisation design, change management, etc., besides software
development. Firms need to recognise and address this issue though various
means such as tie-ups with other corporations, recruitment of relevant people, etc.
30
37. t Align education and vocational training with market demand – Map
the demand for professionals today and in the future – in specific areas with
specific skill requirements. Ensure people with relevant skill sets – those who
can develop appropriate curriculum in programs, introduce creative funding
mechanisms – implement education policy, etc.
t (For inbound tourism) Strengthen relevant infrastructure – Take action
in critical areas where infrastructure is weak, e.g., airports and roads.
Continue to strengthen telecom infrastructure
t Promote public-private partnership – The private sector should be invited
to participate where the public sector is unable to provide the expertise or the
resources, e.g., effective and efficient management of Humayun’s tomb by the
Oberoi group. The public and private sectors need to work collaboratively to
seize any opportunity - jointly map out roles and execute against them
t Form interest groups around opportunities – Form clusters of companies
around specific opportunities to aggregate issues and address them, e.g., a
group of telemedicine companies can work jointly to identify their own issues
in telecom, insurance, and health policies, etc., and address these through
larger organisations like CII
t Align regulatory polices to facilitate opportunity realisation – Identify
and change current policies that act as bottlenecks in realisation of
opportunities, e.g., ease of obtaining visas for entry into India, insurance claim
policies for users of telemedicine services
From the dozen areas listed above, we have distilled three areas for action that we
believe have the highest priority and will have the most impact (Exhibit 21).
t Marketing India
t Educating and Training the Indian Workforce
t Connecting India (telecom, IT, airports)
These provide the fundamental ‘infrastructure’ for all sectors to succeed. For the
remainder of this report, we will focus on these three areas.
T H E AG E N DA F O R AC T I O N 31
38. I N D I A ’ S N E W O P P O RT U N I T Y – 2020
Exhibit 21
HIGH PRIORITY AREAS FOR ACTION
Opportunity Critical areas Service Sectors (examples)
Remote
engineering Telemedicine
Marketing India services
Increase Health
E-Learning
income and tourism
employment Educating and Training
through the Indian Workforce
remote Heritage
Bio-informatics
services and tourism
tourism
Connecting India
• Telecommunication
• IT BPO D-I-Y support
• Airports
These three are the Plans in sectors will be made
infrastructure for all and executed by sectoral
sectors to succeed agencies and companies
A previous study on Foreign Direct Investment (FDI) undertaken jointly by the
Center for International Development at Harvard University and The Boston
Consulting Group analysed the decision-making process at MNCs for choosing FDI
destinations. The study revealed that the process progresses through four stages
(Exhibit 22).
1. Screening: Choose a country to focus on
2. Planning: Consider specific opportunities
3. Implementing: Decide to proceed and invest
4. Operating and Expanding: Begin to actually make and/or sell within the
country; increase profits in the long run
The most striking finding of the study was that in most cases India failed to clear
even the first stage of consideration in the evaluation process. India fell out at the
screening stage largely because of a poor ‘brand’ image. Therefore, marketing India
is a very important area for action by planners and corporations alike to stimulate
demand for Indian services.
Educating and training India’s workforce is the second area that deserves immediate
attention. The existing education infrastructure cannot meet all the manpower
needs that will result from the identified business opportunities. What is required
32
39. Exhibit 22
FDI DECISION-MAKING PROCESS AT MNCs
Demand: India falls out largely at the screening Supply: Skilled manpower and communication
stage due to poor brand image infrastructure key to success
Example: Lifecycle of decisions and actions for Opportunity driven by shortage of workforce in
foreign investments(1) developed countries
• Need to have trained skilled workforce to bridge
Operating the gap
Implemen-
Screening Planning and
ting
expanding
India Inc. will bridge the shortage of workforce in
Choose Consider Decide to Begin Grow developed countries by delivering services remotely
a country specific proceed, to profits • Communication infrastructure key to service delivery
to focus opportu- and invest actually
on nities make
and/or sell
within the
country
Potential Actual
FDI $ FDI $
India needs to train its raw manpower and
India needs to strengthen its brand image provide necessary communication infrastructure
to tap this opportunity
(1) Based on Harvard-BCG study on FDI in India
are people with professional and vocational skills to suit the emerging demands,
rather than people with merely general education. Therefore, a responsive system
for vocational education, preferably with private-sector participation, may be
required.
The third area that requires continuing attention is connectivity infrastructure.
Since remote services depend on the availability and quality of the
telecommunication infrastructure, crucial networks such as high-capacity
international and domestic intercity links are urgently required. In addition to
telecom, adequate IT infrastructure (e.g., cheap, easy access to computing facilities)
is required. Inward tourism would also require improvement of other physical
infrastructure such as airports and roads. Improvements required in infrastructure
in India have received a lot of attention from government agencies and industry
associations in recent times and much action is under way. No further analysis is
required for the purpose of this report.
The next chapter outlines specific actions that different stakeholders need to take in
the three areas highlighted above. Finally, we have also highlighted specific action
items that relate to the two broad opportunities – remote servicing (information
technology) and importing the customer (travel and tourism).
T H E AG E N DA F O R AC T I O N 33
40. I N D I A ’ S N E W O P P O RT U N I T Y – 2020
chapter five
Making It Happen
Marketing India
Despite the success of its IT services industry in global markets, India is perceived
un-favourably on some dimensions by prospective customers. The principal
shortcomings are perceptions of security risks, unreliability of Indian suppliers
generally (other than IT perhaps), and lack of sound infrastructure (despite
significant improvements in telecom recently). Sources of information that
investors and foreign business executives usually rely on do not convey a favourable
impression of India. For most outsiders, India has an image of an exciting, but
dirty and unsafe country. Also, India needs to move faster from its present image of
merely ‘low cost’ to become strong on other important dimensions of customer
satisfaction such as quality and innovation. While several agencies are working to
promote India, their efforts are not coordinated. As a result, different images of
India are projected and the fragmentation of resources across various initiatives
leads to limited impact.
Recognising this weakness, the Ministry of Commerce created the India Brand
Equity Fund (IBEF). The IBEF’s charter was to provide support to
exporters/service providers to strengthen their own corporate brands and promote
the India Inc. label. However, the IBEF’s impact has been limited by the mismatch
between its objective and its resources and activities. The Ministry of Commerce
has recognized that it cannot, by itself, run the IBEF. Therefore, it has
commissioned the CII to assist it in redirecting and boosting the IBEF’s efforts.
This is a major step in the right direction.
Several actions are required to develop India’s image as a reliable and risk-free
source for valuable services. These are:
t Define a powerful positioning of the India Inc. brand, for example:
s Talented resource pool, easy scalability, can offer complete solutions
s Service culture, value-for-money destination
s Attractive, safe, and friendly tourist destination
34
41. t Improve coordination between the government and industry associations
(NASSCOM, CII, etc.) and between several government ministries (tourism,
external affairs, commerce & industry):
s Send a stronger message
s Alignment on initiatives; ensure consistent messages
s Exchange learnings
t Promote India via multiple mediums
s Hire a professional PR agency to ensure that the perception of India equals
reality
s Identify champions in the administration in key countries such as the U.S.
and U.K. to support India
s Specific marketing campaigns, road shows, use of web-sites, etc.
t Use the India Brand Equity Fund more effectively to coordinate and energise
the marketing of India
The agenda for actions by the central and state governments and the corporate
sector to achieve these objectives is described in Exhibit 23.
Exhibit 23
ACTION AREAS FOR MARKETING INDIA
Align brand building efforts
Central Government State Government Corporate sector
• Facilitate a convergence of ‘brand • Ensure positioning of state brand in • Align ‘brand building’ efforts of industry
building’ efforts in ministries of tourism, line with India Inc. brand associations, e.g. CII, NASSCOM
commerce and external affairs – define a powerful positioning of the
• Facilitate alignment of central India Inc. brand
government ‘brand building’ with states’ – hire a professional PR agency to
and industry associations’ efforts ensure perception about India
equals reality
– create awareness about the IBEF
among other corporates to
maximise benefit
– develop other mechanisms to
promote India Inc. brand
Align efforts of India Brand Equity Fund
Central Government Corporate sector
• Transfer India Brand Equity Fund to an organisation with the • Create a cell within an industry association for administering
appropriate skills and manpower strength to run the fund the India Brand Equity Fund
• Revisit mandate of IBEF with industry associations • The industry cell should
– recommend a broader mandate to the government for the
India Brand Equity Fund
v incorporate need for focus on remote services & tourism
Create favourable climate for investments
Central Government State Government
• Create favourable climate for foreign companies wanting to do • Create favourable climate within the state for foreign
business in India companies wanting to do business in state
MAKING IT HAPPEN 35