SlideShare una empresa de Scribd logo
1 de 21
Descargar para leer sin conexión
InvestorBriefing
         No. 260 | April 22, 2008


1st QUARTER 2008


AT&T Ramps Revenue Growth, Delivers
Strong First-Quarter Results; Growth
Highlighted by Gains in Wireless,
Broadband and Enterprise Services
                   Results mark AT&T’s                                     AT&T Inc. reported strong first-quarter results highlighted
                                                                           by a significant ramp in consolidated revenue growth,
          12th consecutive quarter
                                                                           led by improved results in wireless and enterprise, and
           of double-digit growth in
                                                                           further expansion of wireless margins.
     adjusted earnings per share.
                                                                           • Wireless revenues increased 18.3 percent versus the year-earlier first quarter,
                                                                             driven by strong subscriber gains and continued robust growth in wireless
                                                                             data services such as Internet access, e-mail, messaging, data access and
                                                                             media bundles. AT&T is the U.S. market leader in wireless with 71.4 million
                                                                             subscribers. Wireless margins expanded significantly, reflecting continued
                                                                             network and operational improvements.
                                                                           • Enterprise customer revenue growth took another step up, led by a
                                                                             22.9 percent increase in revenues from Internet Protocol (IP)-based data
                                                                             services such as virtual private networks (VPNs), hosting and managed
                                                                             Internet services. AT&T is the industry leader in serving large business
                                                                             customers on six continents.


First-Quarter EPS Reconciliation
                                                                                                                                                                                                                                                                           1Q08    1Q07

Reported EPS . . . . . . . . . . . . . . . . . .       .....................................................                                                                                                                                                               $0.57   $0.45
Adjustments to results:
  Merger integration costs . . . . . . .               .   .   .   .   .   .   .   .   .   .   .   .   .   .   .   .   .   .   .   .   .   .   .   .   .   .   .   .   .   .   .   .   .   .   .   .   .   .   .   .   .   .   .   .   .   .   .   .   .   .   .   .   .            0.02
  Noncash merger-related costs . .                     .   .   .   .   .   .   .   .   .   .   .   .   .   .   .   .   .   .   .   .   .   .   .   .   .   .   .   .   .   .   .   .   .   .   .   .   .   .   .   .   .   .   .   .   .   .   .   .   .   .   .   .   .    0.13    0.21
  Gains from wireless transactions                     .   .   .   .   .   .   .   .   .   .   .   .   .   .   .   .   .   .   .   .   .   .   .   .   .   .   .   .   .   .   .   .   .   .   .   .   .   .   .   .   .   .   .   .   .   .   .   .   .   .   .   .   .           (0.04)
  Workforce reduction . . . . . . . . . .              .   .   .   .   .   .   .   .   .   .   .   .   .   .   .   .   .   .   .   .   .   .   .   .   .   .   .   .   .   .   .   .   .   .   .   .   .   .   .   .   .   .   .   .   .   .   .   .   .   .   .   .   .    0.04
Adjusted EPS . . . . . . . . . . . . . . . . . . . . . . . . . . . . . . . . . . . . . . . . . . . . . . . . . . . . . . . . . . . . . . . . . . . . . .                                                                                                                   $0.74   $0.65
Pretax adjustments to earnings: in 1Q07, merger integration, noncash intangible amortization and purchase accounting effect totaling
$2,306 million and a gain from wireless transactions of $(409) million; in 1Q08, noncash intangible amortization totaling $1,208 million
and a workforce reduction charge of $374 million.
Totals may not foot due to rounding.
2
              InvestorBriefing | 1Q 2008


                                                                                            REPORTED RESULTS
                       AT&T CONSOLIDATED ADJUSTED REVENUE GROWTH RATES
                                                                                            Compared with results for the year-earlier
                       Year-Over-Year, Pro Forma
  AT&T continues to                                                                         quarter, AT&T’s reported operating expenses
                                                                                  4.6%
 accelerate growth                                                                          for the first quarter of 2008 were $24.8 billion,
    in consolidated                                                                         up from $24.3 billion; reported operating
                                                                                            income was $6.0 billion, up from $4.7 billion;
revenues, driven by                                   3.2%
                                                                                            and AT&T’s reported operating income margin
  gains in wireless,                                                2.9%

                                                                                            was 19.5 percent, up from 16.1 percent.
     broadband and
                                                                                               AT&T’s reported first-quarter 2008 net
enterprise services.                     2.0%
                           1.7%
                                                                                            income totaled $3.5 billion, up 21.5 percent
                                                                                            from $2.8 billion in the year-earlier quarter,
                                                                                            and reported earnings per diluted share
                                                                                            totaled $0.57, up 26.7 percent from $0.45
                                                                                            in the first quarter of 2007.
                          1Q07          2Q07          3Q07         4Q07          1Q08

                       Revenues for 2007 are adjusted to exclude merger-related directory
                                                                                            DOUBLE-DIGIT GROWTH IN
                       accounting impacts. 2007 comparisons are to 2006 pro forma
                                                                                            ADJUSTED EARNINGS PER SHARE
                       results, which combine revenues from AT&T, BellSouth and Cingular
                       Wireless consistently for all periods.
                                                                                            AT&T’s adjusted results for the first quarter
                                                                                            of 2008 exclude merger-related amortization
                       • Broadband revenues continued their record                          expenses and costs associated with a
                         of solid double-digit growth, reflecting                           workforce reduction. Adjusted results for
                         subscriber gains and an increased number                           the first quarter of 2007 excluded merger-
                         of subscribers who select higher-speed                             related costs and accounting effects as
                         service. AT&T is the U.S. leader in broad-                         well as gains from wireless transactions.
                         band service with 14.6 million connections.                           Compared with results for the year-earlier
                       • AT&T U-verseSM TV subscriber growth                                quarter, AT&T’s adjusted operating expenses
                         continued its strong ramp, with a first-                           for the first quarter of 2008 totaled
                         quarter net gain of 148,000 to reach                               $23.2 billion, versus $22.4 billion; adjusted
                         379,000 in service. The company is on                              operating income was $7.6 billion, up from
                         track to reach its target of more than                             $7.0 billion; and AT&T’s adjusted operating
                         1 million AT&T U-verse TV subscribers                              income margin was 24.6 percent, up from
                         by year-end 2008.                                                  23.7 percent.
                                                                                               AT&T’s adjusted first-quarter 2008 net
                       REVENUE GROWTH RAMP                                                  income totaled $4.5 billion, up 10.3 percent
                       For the quarter ended March 31, 2008, AT&T’s                         from $4.1 billion in the year-earlier quarter,
                       revenues totaled $30.7 billion, up 6.1 percent                       and adjusted earnings per diluted share
                       versus reported results in the year-earlier                          totaled $0.74, up 13.8 percent from $0.65
                       quarter and up 4.6 percent compared with                             in the first quarter of 2007.
                       first-quarter 2007 pro forma revenues, which                            AT&T’s merger integration and operational
                       exclude merger-related accounting impacts                            cost initiatives continue on schedule. For the
                       on directory revenues. This marks a substan-                         full year 2007, operating expense savings
                       tial step up from year-over-year pro forma                           from BellSouth and AT&T Corp. merger
                       revenue growth of 2.9 percent in the fourth                          integration efforts and previously outlined
                       quarter of 2007 and 1.7 percent in the first                         operational initiatives totaled approximately
                       quarter of 2007.                                                     $3.9 billion. AT&T expects these expense
                          AT&T’s first-quarter revenue growth was                           savings to grow in 2008 by more than
                       driven by improved growth rates in wireless,                         $2 billion dollars.
                       enterprise and wholesale, combined with
                       stable trends in regional revenues.
3
                 InvestorBriefing | 1Q 2008


                                                                                                  ADDITIONAL BACKGROUND ON
                             AT&T ADJUSTED OPERATING INCOME MARGIN
                                                                                                  ADJUSTED AND PRO FORMA RESULTS
                                                                                       24.6%
                                                                                                  AT&T’s adjusted earnings for the first
      Revenue growth
                                                                         24.0%
                                              23.9%                                               quarter of 2008 exclude (1) noncash pretax
      and progress on                                       23.7%
                                23.7%
                                                                                                  amortization costs related to acquisitions
productivity initiatives
                                                                                                  totaling $1.2 billion, or $0.13 per diluted
   combined to further
                                                                                                  share, and (2) a charge of $374 million, or
    expand margins in
                                                                                                  $0.04 per diluted share, associated with a
      the first quarter.
                                                                                                  workforce reduction previously disclosed in
                                                                                                  a Form 8-K filing.
                                                                                                     Adjusted results for the first quarter of
                                                                                                  2007 excluded: (1) pretax merger-related
                                                                                                  integration costs totaling $245 million, or
                                1Q07          2Q07         3Q07          4Q07          1Q08
                  Reported      16.1%         16.8%        17.6%         18.1%         19.5%
                                                                                                  $0.02 per diluted share; (2) noncash, pretax
                             Merger integration and amortization costs and other one-time items
                                                                                                  merger-related costs totaling $1.8 billion, or
                             are excluded from adjusted operating income margins.
                                                                                                  $0.18 per diluted share; (3) a merger-related
                                                                                                  directory accounting impact of $301 million,
                             CASH FROM OPERATIONS,
                                                                                                  or $0.03 per diluted share; and (4) a gain of
                             SHARE REPURCHASES
                                                                                                  $409 million, or $0.04 per share, from
                             Compared with results in the year-earlier
                                                                                                  wireless transactions.
                             quarter, AT&T’s cash from operating activi-
                                                                                                     Advertising & Publishing results for 2007
                             ties for the first quarter of 2008 totaled
                                                                                                  were affected by accounting adjustments
                             $5.0 billion, up from $4.6 billion; capital
                                                                                                  following AT&T’s late 2006 acquisition of
                             expenditures totaled $4.2 billion, versus
                                                                                                  BellSouth. In accordance with purchase
                             $3.3 billion; and free cash flow (cash from
                                                                                                  accounting rules, deferred revenues and
                             operations minus capital expenditures)
                                                                                                  expenses for all BellSouth directories
                             totaled $0.7 billion, compared with
                                                                                                  delivered prior to the close of the merger
                             $1.3 billion.
                                                                                                  were eliminated from 2007 consolidated
                                As it invests in the future of its business,
                                                                                                  results. This elimination of amortization
                             AT&T continues to return substantial value
                                                                                                  reduced first-quarter 2007 consolidated
                             to shareowners through dividends and
                                                                                                  revenues by $409 million and consolidated
                             share repurchases. In the first quarter,
                                                                                                  operating expenses by $108 million.
                             dividends paid totaled $2.4 billion and
                                                                                                     AT&T manages its print directory business
                             shares repurchased totaled 111.6 million
                                                                                                  using amortized results. As a result, 2007
                             for $4.1 billion. AT&T ended the quarter
                                                                                                  amortized results are shown in the
                             with 5.9 billion shares outstanding.
                                                                                                  Advertising & Publishing segment on
                                                                                                  AT&T’s Statement of Segment Income.
                             STRONG BALANCE SHEET
                                                                                                  In 2008, consolidated and segment results
                             AT&T’s balance sheet continues to be strong.
                                                                                                  reflect amortization accounting.
                             At the end of the first quarter, AT&T’s long-
                             term debt was $60.2 billion, and total debt
                             was $73.5 billion. Cash and cash equivalents
                             at the end of the quarter totaled $2.0 billion.
                             AT&T’s first-quarter debt-to-total-capitali-
                             zation ratio was 39.6 percent, and the
                             company’s annualized debt-to-EBITDA
                             was 1.6. AT&T expects its year-end 2008
                             debt-to-EBITDA ratio will be in the 1.3 to
                             1.5 range.
4
              InvestorBriefing | 1Q 2008


                                   Wireless
                                   AT&T delivered strong wireless growth in the first quarter, reflecting the
AT&T’s first-quarter wireless
                                   company’s broad high-quality network, innovative services, attractive handset
   results were highlighted        selection, extensive sales reach and continued improvements in operations.
                                   Results included improved revenue growth, expanded margins and strong
      by strong double-digit       growth in operating income.

     revenue growth driven         ACCELERATED WIRELESS REVENUE GROWTH
                                   AT&T’s first-quarter wireless revenues totaled $11.8 billion, up 18.3 percent
   by solid subscriber gains       versus the year-earlier quarter. This marked AT&T’s seventh consecutive quarter
                                   of improved wireless revenue growth. Wireless service revenues, which exclude
       and robust growth in        handset and accessory sales, grew 17.1 percent to $10.6 billion.
                                      Revenue growth was driven by strong subscriber gains and continued
     wireless data services.       improvement in ARPU (average monthly revenues per subscriber). AT&T has
                                   now posted seven consecutive quarters of year-over-year growth in wireless
                                   service ARPU, which was $50.18 in the first quarter, up 2.0 percent versus
                                   the year-earlier quarter. Retail postpaid subscriber ARPU growth was even
                                   stronger, up approximately 5 percent.

                                   IMPROVED SUBSCRIBER GAINS
                                   AT&T’s first-quarter net gain in wireless subscribers totaled 1.3 million,
                                   up 104,000, or 8.7 percent, versus the year-earlier quarter. AT&T ended the
                                   quarter with 71.4 million subscribers in service. Total net adds in the first
                                   quarter were reduced by approximately 330,000 due to the shutdown of
                                   AT&T’s TDMA wireless network in late February. Retail postpaid net adds
                                   totaled 705,000 in the first quarter of 2008, up 3.7 percent versus net
                                   adds in the year-earlier first quarter.
                                     AT&T continued its strong record of wireless subscriber flow share with
                                   5.0 million first-quarter gross subscriber additions, up from 4.3 million in the
                                   year-earlier quarter. Total average monthly subscriber churn, which includes
                                   postpaid, prepaid and reseller subscribers, was 1.7 percent, flat with the
                                   year-earlier quarter and with the fourth quarter of 2007. Retail postpaid
                                   churn was 1.2 percent, down from 1.3 percent in the year-earlier quarter
                                   and flat with the fourth quarter of 2007.

                                   ROBUST GROWTH IN WIRELESS DATA SERVICES
                                   AT&T‘s wireless data revenues grew 57.3 percent versus results in the year-
                                   earlier quarter to $2.3 billion, reflecting robust increases in Internet access,
                                   e-mail, messaging, data access and media bundles. Data now represents
                                   21.5 percent of AT&T’s total wireless service revenues, up from 16.0 percent
                                   in the first quarter of 2007 and 10.9 percent in the first quarter of 2006.
5
                 InvestorBriefing | 1Q 2008


                                                                                               the company expects to deliver 3G services
                          AT&T WIRELESS REVENUES
                                                                                               to nearly 350 leading U.S. markets by the
                          Year-Over-Year Growth
       AT&T posted its                                                                         end of 2008, including all of the nation’s
                                                                                   18.3%

                                                                                               100 largest cities.
 seventh consecutive                                                  16.3%

quarter of accelerated                                  14.4%
                                                                                               OPERATING INCOME GROWTH,
                                           12.7%
     wireless revenue
                                                                                               MARGIN EXPANSION
                             11.2%
    growth, reflecting
                                                                                               Strong growth in wireless revenues, network
solid subscriber gains
                                                                                               efficiencies and operational improvements
  and robust adoption
                                                                                               have driven substantial improvement in AT&T’s
      of data services.
                                                                                               wireless operating income and margins.
                                                                                                  On a reported basis, AT&T’s first-quarter
                                                                                               wireless operating expenses totaled
                             1Q07          2Q07         3Q07          4Q07         1Q08
                                                                                               $8.9 billion, and operating income was
                                                                                               $3.0 billion, up 94.1 percent from
                             During the first quarter, AT&T’s wireless
                                                                                               $1.5 billion in the first quarter of 2007.
                          customers sent more than 620 million
                                                                                                  On an adjusted basis, wireless operating
                          multimedia messages and 44 billion text
                                                                                               expenses totaled $8.3 billion, and operating
                          messages, both volumes more than double
                                                                                               income was $3.5 billion, up 38.5 percent
                          totals in the year-earlier quarter.
                                                                                               from $2.5 billion in the first quarter of 2007.
                             AT&T expects continued robust growth
                                                                                                  AT&T’s reported wireless operating
                          in wireless data services as more customers
                                                                                               income margin was 25.0 percent, up from
                          adopt integrated devices that deliver
                                                                                               15.2 percent in the year-earlier quarter,
                          access to a broad array of applications
                                                                                               and its adjusted wireless operating
                          and content. At the end of the first quarter,
                                                                                               income margin was 29.8 percent, up from
                          16 percent of AT&T’s postpaid wireless
                                                                                               25.5 percent in the year-earlier quarter.
                          subscribers had an integrated device, up
                                                                                                  AT&T’s first-quarter wireless OIBDA service
                          from 6 percent one year earlier.
                                                                                               margin was 41.7 percent, the highest ever
                             Data growth is also spurred by adoption
                                                                                               achieved by the company’s wireless segment,
                          of 3G-compatible devices. At the end of
                                                                                               up from an unadjusted 37.5 percent and an
                          the first quarter, 11 million AT&T customers
                                                                                               adjusted 38.9 percent in the year-earlier
                          had 3G devices. AT&T’s 3G network now
                                                                                               quarter. (OIBDA service margin is operating
                          includes 272 U.S. metropolitan areas, and
                                                                                               income before depreciation and amortization,
                                                                                               divided by total service revenues.)
                          AT&T WIRELESS SUBSCRIBERS
                          In millions
                                                                                               LEADER IN WIRELESS NETWORKS,
   AT&T increased its                                                               71.4
                                                                      70.1
                                                                                               SERVICE INNOVATION
  wireless subscriber
                                                                                               AT&T operates the United States’ largest
   base by more than                                     65.7
                                                                                               wireless digital voice and data network, and
        9 million over                     63.7
                                                                                               through roaming alliances around the world,
                              62.2
        the past year.
                                                                                               provides the largest global presence among
                                                                                               U.S. wireless carriers.
                                                                                                  AT&T is moving quickly to create the
                                                                                               next generation of wireless. In addition to
                                                                                               its broad 3G network deployment, by the
                                                                                               middle of this year, the company expects
                             1Q07          2Q07         3Q07          4Q07         1Q08
                                                                                               to complete its upgrade of the nation’s
                          Subscriber increase in 4Q07 included 1.7 million subscribers added
                          through Dobson acquisition.
                                                                                               first High Speed Uplink Packet Access
6
                 InvestorBriefing | 1Q 2008


                                                                                                completed successful bids for prime B Block
                             AT&T WIRELESS DATA REVENUES
                                                                                                spectrum in the Federal Communications
                             Dollars in billions
  AT&T’s wireless data                                                                          Commission’s Auction 73.
                                                                                      $2.3

                                                                                                   The complementary nature of the spectrum
        revenues grew                                                    $2.0
                                                                                                AT&T acquired through the FCC auction and
     57.3 percent year                                     $1.8
                                                   $1.7
                                                                                                from Aloha Partners gives AT&T the capacity
    over year and now            $1.5
                                                                                                to meet customer needs as the company
represent 21.5 percent
                                                                                                moves to higher-speed 4G (fourth-generation)
      of total wireless
                                                                                                services. Upon final award of the auctioned
     service revenues.
                                                                                                B Block spectrum, AT&T’s 700 MHz spectrum
                                                                                                will cover 100 percent of the top 200 markets
                                                                                                and 87 percent of the U.S. population.
                                                                                                   AT&T also sets the pace for innovation in
                                1Q07           2Q07        3Q07         4Q07         1Q08
                                                                                                wireless with a host of cutting-edge devices,
                                                                                                content and services. In recent weeks, AT&T:
                             (HSUPA)-enabled network in current 3G
                                                                                                • Added to its HSUPA device lineup with the
                             markets. The network allows AT&T’s
                                                                                                   launch of two new LaptopConnect cards
                             HSUPA-enabled laptop users to send
                                                                                                   from Option, the GT Ultra and GT Ultra
                             large files faster and take full advantage
                                                                                                   Express. The new cards deliver enhanced
                             of the latest interactive Internet and
                                                                                                   mobile broadband performance across two
                             business applications.
                                                                                                   popular notebook computer formats, PC
                                AT&T also took major steps in the first
                                                                                                   Card and ExpressCard. Both the GT Ultra
                             quarter to add valuable wireless spectrum.
                                                                                                   and GT Ultra Express are compatible with
                             In February, AT&T completed its acquisition
                                                                                                   Microsoft Windows Vista, Windows XP,
                             of spectrum licenses covering 196 million
                                                                                                   Windows 2000 and Apple® Mac® OS X
                             people in 281 license areas from a subsidiary
                                                                                                   (version 10.4.10 or later) notebooks.
                             of Aloha Partners, L.P. In March, AT&T
                                                                                                • Joined with MediaFLO USA Inc. to intro-
                                                                                                   duce AT&T Mobile TV with FLO, a mobile
                             AT&T ADJUSTED WIRELESS MARGINS
                                                                                                   television service featuring high-quality
                              Operating Income Margin                  OIBDA Service Margin
                                                                                                   live programming. The mobile TV service
       AT&T’s wireless                                                               41.7%         will launch in May 2008 on two new
 OIBDA service margin
                                                                                                   exclusive handsets, the LG Vu™ and the
         expanded 280
                                                                                                   Samsung Access™. AT&T Mobile TV will
                                                                        38.9%
   basis points versus                         29.8%
                                                                                                   deliver full-length television content and
      adjusted results          25.5%
                                                                                                   sporting events from top networks,
   for the first quarter                                                                           including programming from leading
                of 2007.                                                                           entertainment brands CBS Mobile,
                                                                                                   Comedy Central, ESPN Mobile TV, FOX
                                                                                                   Mobile, MTV, NBC 2GO, NBC News2Go
                                                                                                   and Nickelodeon.
                                                                                                • Unveiled plans for a redesigned MEdia
                                                                                                   Mall, the company’s one-stop shopping
                                                                                     1Q08
                                1Q07          1Q08                      1Q07
                Unadjusted
                                                                                     41.7%
                                15.2%         25.0%                     37.5%
                   Results
                                                                                                   destination for mobile content. Since
                             Merger integration and intangible amortization costs excluded         launching on AT&T mobile handsets in
                             from adjusted operating income margins: $1,022 million in 1Q07
                                                                                                   December 2004, millions of customers
                             and $568 million in 1Q08. Merger integration costs excluded from
                             adjusted OIBDA service margins: $124 million in 1Q07.
                                                                                                   have visited MEdia Mall to obtain
7
InvestorBriefing | 1Q 2008


         ringtones, games, videos and other               access to YELLOWPAGES.COM, real-time
         applications, generating more than               traffic updates and route information
         $1 billion in sales and helping to spawn         and is the only mobile phone-based
         a wave of innovation among an ever-              GPS service that provides integrated
         growing mobile developer community.              speech recognition for address entry
         Like its predecessor, MEdia Mall 2.0 will        and points of interest search, is currently
         feature more than 90,000 choices from            available on BlackBerry® devices.
         more than 115 content providers.               • Announced BusinessTalk, a new wireless
       • Successfully launched a new unlimited            offer that brings the benefits of AT&T
         voice plan targeted to wireless users who        FamilyTalk plans to small businesses,
         want the predictability of flat-rate pricing     enabling them to share monthly Anytime
         for unlimited minutes. The plan is available     Minutes for up to 40 employees.
         to new and existing wireless subscribers         BusinessTalk plans are designed to
         for $99.99 a month for unlimited U.S.            help small businesses better manage
         calling with no domestic roaming or long         their monthly costs by reducing overage
         distance charges.                                charges and simplifying billing. AT&T
       • Introduced AT&T Navigator, a next-               offers a wide range of wireless phones,
         generation navigation service available          smart devices, LaptopConnect solutions
         on GPS-capable PDAs and handsets.                and other services for small businesses,
         AT&T Navigator is designed to provide            including mobile e-mail, GPS navigation
         clear and precise audible and visual             and Push To Talk technology.
         turn-by-turn driving directions, including
         full-color moving maps, using GPS
         directly from a customer’s wireless phone.
         AT&T Navigator, which offers mobile
8
              InvestorBriefing | 1Q 2008


                                   Wireline
                                   First-quarter revenues in AT&T’s wireline segment totaled $17.6 billion versus
     First-quarter results in
                                   $18.0 billion in the year-earlier quarter. This reflects a return to revenue growth
    AT&T’s wired operations        in the company’s enterprise business, substantial improvement in wholesale
                                   revenue trends and stable revenue trends in regional business and consumer
        were highlighted by        operations.
                                      Excluding revenues from national mass markets, the small remainder of the
improved enterprise growth,        former AT&T’s stand-alone long distance and local bundled business, wireline
                                   revenues increased slightly versus the year-earlier quarter and sequentially.
     a double-digit increase          AT&T expects further stabilization in overall wireline revenue trends during
                                   the remainder of 2008 as enterprise continues to grow, wholesale trends
     in broadband revenues         show further improvement and AT&T U-verse services gain additional scale.
                                      Compared with results for the year-earlier first quarter, on a reported basis,
  and a further ramp in AT&T       wireline operating expenses totaled $14.8 billion, versus $15.1 billion; operating
                                   income was $2.8 billion, versus $2.9 billion; and AT&T’s wireline operating
     U-verse TV subscribers.       income margin was 16.1 percent, which was unchanged versus the first quarter
                                   of 2007.
                                      Adjusted wireline results for the first quarter of 2007 exclude merger-related
                                   integration and amortization expenses. Adjusted wireline results for the first
                                   quarter of 2008 exclude only merger-related amortization expenses.
                                      Compared with results for the year-earlier first quarter, adjusted wireline
                                   operating expenses totaled $14.4 billion, unchanged from $14.4 billion;
                                   adjusted operating income was $3.3 billion, versus $3.6 billion; and
                                   AT&T’s adjusted wireline operating income margin was 18.5 percent,
                                   versus 20.1 percent.
                                      Moving through 2008, AT&T expects wireline expenses and margins to
                                   benefit from ongoing cost initiatives and improved IP economics.
                                      The following wireline highlights include ongoing shifts in customer
                                   categories to reflect AT&T’s management of customer relationships.

                                   FURTHER STEP UP IN ENTERPRISE GROWTH
                                   AT&T delivered further improvement in enterprise revenue growth in the first
                                   quarter, led by a 22.9 percent increase in enterprise IP data revenues, including
                                   areas such as VPNs, managed Internet services and hosting.
                                      Total enterprise revenues continued their ramp and were up 1.2 percent
                                   versus results for the first quarter of 2007. This compares with year-over-year
                                   pro forma declines of 2.0 percent in the fourth quarter of 2007 and 3.9 percent
                                   in the first quarter of 2007.
9
                  InvestorBriefing | 1Q 2008


                                                                                                     Also in the first quarter, AT&T announced
                                AT&T TOTAL ENTERPRISE REVENUE GROWTH RATES
                                                                                                 it is joining forces with SAP America Inc. in
                               2
                                                                                                 a three-year marketing agreement under
    AT&T’s enterprise                                                                    1.2%
                                                                                                 which AT&T will serve as a primary SAP®
                               1
      revenue growth
                                                                                                 hosting partner, providing independent
continues to be driven         0
                                                                                                 hosting services for large business customers
                                                                       (0.2)%
     by solid demand,
                                                                                                 headquartered in North America.
                               -1
      a premier global
                                                                                                     Recent major enterprise contract wins
                                                           (1.7)%
        network and a          -2
                                                                                                 include a five-year agreement with Royal
                                                                                (2.0)%
    broad portfolio of
                                                                                                 Dutch Shell, which calls for AT&T to provide,
                               -3
   advanced services.
                                                                                                 manage and maintain Shell’s worldwide
                                             (3.9)%
                               -4
                                                                                                 communications infrastructure while also
                                                                                                 managing the company’s global mobility
                                     1Q07              2Q07         3Q07        4Q07     1Q08
          Enterprise service
            revenue growth          (3.0)%            (0.7)%        0.4%        1.5%     2.1%
                                                                                                 needs. This is one of the largest commercial
                               2007 comparisons are to 2006 pro forma results, which combine
                                                                                                 contracts ever signed by AT&T and the
                               results from the former BellSouth and AT&T and exclude revenues
                                                                                                 largest agreement signed with a company
                               from acquired operations.

                                                                                                 headquartered in Europe. This agreement
                                  Enterprise service revenues, which exclude                     with Shell follows a series of other large
                               CPE sales and acquisition impacts, grew                           wins in the past year, including deals
                               2.1 percent, following a 1.5 percent increase                     with Starbucks, General Motors, the
                               in the preceding quarter and a decline of                         U.S. Department of the Treasury and IBM.
                               3.0 percent in the first quarter of 2007.
                                                                                                 REGIONAL BUSINESS GROWTH
                                  With solid demand and sales momentum,
                               AT&T expects to deliver positive growth in                        AT&T’s regional business revenues increased
                               total enterprise revenues throughout 2008.                        2.6 percent in the first quarter to $3.2 billion,
                                  AT&T is the premier provider for enterprise                    with continued growth in both voice and
                               customers, delivering networking services                         data services. Regional business service
                               and solutions to multinational corporations,                      revenues, which exclude CPE sales, grew
                               U.S. governmental agencies and regionally                         3.4 percent.
                               based domestic companies. AT&T continues                             Regional business data revenues, which
                               to take the initiative to expand and enhance                      make up 30.5 percent of the category, grew
                               its enterprise capabilities.                                      6.3 percent, led by strong growth in Ethernet
                                  For example, in March AT&T announced                           services and by 15.2 percent growth in
                               that it plans to invest $1 billion in 2008 to                     IP data services, including gains in broad-
                               extend its global network reach and capacity,                     band, managed Internet and VPN services.
                               globalize its portfolio of business services                         Regional business revenues from small
                               and embed the latest utility computing and                        and midsize firms increased approximately
                               other technologies in the network so that                         5 percent. AT&T’s broad portfolio of
                               companies can deliver real-time applications                      communications services for small and
                               to their customers, suppliers and partners.                       midsize businesses includes wireless,
                               Major projects include new subsea fiber                           broadband Internet access, business
                               optic cable capacity to Japan and Asia, new                       e-mail services, Web hosting, unified
                               core MPLS (MultiProtocol Label Switching)                         messaging, remote data storage and
                               routers in Europe, Asia and the United States,                    network security options.
                               and new network-to-network connections
                               to extend network reach into high-growth
                               markets in Asia Pacific, Eastern Europe
                               and South America.
10
                    InvestorBriefing | 1Q 2008


                                                                                  In April, AT&T announced the availability
                              AT&T U-VERSE TV CONNECTIONS IN SERVICE
                                                                               of new turnkey Web hosting solutions and
                              In thousands
                                                                               Web site design services developed specifi-
                                                                       379
   AT&T ramped growth
                                                                               cally for small and midsize businesses.
          in its advanced
                                                                               Using these services, companies can easily
    IP-based TV service,
                                                                               and cost-effectively launch a new or improve
        with a net gain of
                                                                               an existing Web site, sell products or
                                                               231
   148,000 subscribers
                                                                               services online, build an online community,
      in the first quarter.
                                                                               manage company e-mail, distribute digital
                                                                               content, host a gaming server or run many
                                                     126
                                                                               other business applications. The new
                                                                               offerings are targeted to organizations
                                              51
                                                                               that need more than shared server space
                                   13
                                                                               and applications but do not require the
                                 1Q07        2Q07   3Q07      4Q07     1Q08
                                                                               complex multiserver environment of
                                                                               enterprise hosting.
                                 These offerings expanded in the first
                              quarter with the launch of AT&T Business         STABLE REGIONAL CONSUMER
                              in a BoxSM, a service that harnesses the         REVENUES, ACCELERATED
                              power of IP communications to simplify           VIDEO RAMP
                              IT operations for smaller and midsize            First-quarter regional consumer results
                              businesses and branch offices of large           continued trends of recent quarters, with
                              businesses. The service features a single        improved growth in broadband and Advanced
                              device equipped with all necessary data          TV services offsetting traditional voice access
                              ports and connectors and delivers VoIP           line pressures, resulting in stable revenues.
                              functionality through AT&T Voice DNASM,             Regional consumer revenues totaled
                              Internet access routing with built-in firewall   $5.5 billion, down 0.4 percent versus results
                              protection, VPN capabilities, Wi-Fi data         for the year-earlier quarter.
                              access capabilities and local area network          Regional consumer revenue connections
                              connectivity with Power Over Ethernet            (retail voice, high speed Internet and
                              connections.                                     video) totaled 49.3 million at the end of
                                                                               the first quarter of 2008. This compares
                                                                               with 49.3 million at the end of the first
                              AT&T BROADBAND CONNECTIONS
                              In millions                                      quarter 2007 and 49.4 million at the end
                                                                       14.6
   AT&T added 491,000
                                                                               of the fourth quarter of 2007. Gains in
broadband connections                                          14.2
                                                                               broadband and video connections totaled
     in the first quarter
                                                                               2.6 million over the past year, and
                                                     13.8
   and 1.8 million over
                                                                               consumer IP data revenues, which include
          the past year.
                                                                               revenues from broadband and AT&T
                                             13.3

                                                                               U-verse services, increased 18.5 percent
                                  12.9
                                                                               versus results for the year-earlier quarter.
                                                                                  Reflecting growth in broadband and video,
                                                                               average monthly revenues per consumer
                                                                               primary line have increased steadily over the
                                                                               past several quarters, reaching $60.16 in the
                                 1Q07        2Q07   3Q07      4Q07     1Q08
                                                                               first quarter, up 5.4 percent year over year.
11
               InvestorBriefing | 1Q 2008


                                                                         from any PC; an online voice mailbox so that
                         AT&T AVERAGE MONTHLY REVENUES PER
                                                                         customers can listen to, manage and forward
                         CONSUMER PRIMARY LINE
                                                                         voice mail from the online portal; and the
     AT&T’S regional                                            $60.16
                                                                         ability to check call history or click-to-call
 consumer ARPU has                                     $59.14
                                                                         from their U-verse TV screen.
                                              $58.62
ramped steadily over                $58.15
     the past several     $57.08
                                                                         BROADBAND GROWTH
  quarters, reflecting
                                                                         AT&T continues to deliver solid double-digit
growth in broadband
                                                                         growth in broadband. AT&T’s broadband
      and TV service.
                                                                         revenues totaled $1.4 billion in the first
                                                                         quarter, up 13.2 percent versus the year-
                                                                         earlier quarter.
                                                                            In the first quarter, total high speed
                                                                         Internet connections, which include DSL,
                           1Q07     2Q07      3Q07      4Q07    1Q08
                                                                         U-verse enabled AT&T High Speed Internet
                                                                         and satellite broadband services, increased
                            Consumer broadband revenues continue
                                                                         by 491,000, and AT&T ended the first
                         to grow at a solid double-digit pace, and
                                                                         quarter with 14.6 million consumer and
                         consumer broadband net adds improved
                                                                         business high speed Internet connections,
                         from recent quarters, reflecting the success
                                                                         up 1.8 million, or 13.9 percent, over the
                         of new wireless/broadband bundles and the
                                                                         past year.
                         rapid expansion of AT&T U-verse services.
                                                                            This growth reflects the quality and broad
                            Growth in AT&T U-verse TV service, the
                                                                         availability of AT&T’s broadband services, the
                         company’s next-generation IP-based video
                                                                         ramp in AT&T U-verse service, which has a
                         service, continued its strong ramp during
                                                                         high broadband attach rate, and innovations
                         the first quarter, achieving a net subscriber
                                                                         such as the launch last year of a stand-alone
                         gain of 148,000 to reach 379,000 in service.
                                                                         high speed Internet service, also available
                         AT&T expects a further ramp in the quarters
                                                                         as part of a new wireless and broadband
                         ahead and is on track to reach its target of
                                                                         service bundle.
                         more than 1 million subscribers by the end
                                                                            To boost bandwidth choices, AT&T
                         of 2008.
                                                                         announced plans to offer AT&T High Speed
                            Total video connections, which include
                                                                         Internet Max in February 2008. The new tier,
                         AT&T U-verse service and bundled satellite
                                                                         available exclusively to AT&T U-verse
                         television service, increased by 264,000
                                                                         customers across the country, will deliver
                         in the quarter to reach 2.6 million.
                                                                         more bandwidth with speeds up to 10 Mbps
                            AT&T also broke new ground in the first
                                                                         downstream and up to 1.5 Mbps upstream.
                         quarter by expanding its launch of AT&T
                                                                            To add convenience and portability for
                         U-verse Voice services in Sacramento,
                                                                         broadband users, in January, AT&T and
                         Kansas City, Austin, San Diego and
                                                                         Starbucks announced plans to deliver
                         Connecticut. The service offers a host of
                                                                         AT&T Wi-FiSM service at more than 7,000
                         features that integrate AT&T wired and
                                                                         company-operated Starbucks locations
                         wireless services including: combined AT&T
                                                                         across the United States. Starbucks and
                         U-verse Voice and wireless voice mail with
                                                                         AT&T will offer a mix of free and paid Wi-Fi
                         U-verse Messaging, which provides a single
                                                                         offerings at Starbucks stores. The initiative
                         voice mailbox that can be accessed from any
                                                                         will further expand the AT&T Wi-Fi network,
                         phone line or PC; U-verse Central, an online
                                                                         already the largest in the United States, to
                         management portal that gives users the
                                                                         more than 17,000 U.S. hot spots and more
                         option to manage their call preferences,
                                                                         than 71,000 globally.
                         voice mail, contacts, call history and more
12
InvestorBriefing | 1Q 2008


                                                            To capitalize on tremendous demand for
       WHOLESALE
                                                        additional data capacity and IP-related
       AT&T is a leading global provider of whole-
                                                        services, in February, AT&T announced that
       sale services, delivering a full portfolio of
                                                        it is expanding capacity to deliver key
       network, voice, data and IP solutions to
                                                        services such as long-haul private line
       carriers, wireless operators, cable providers,
                                                        and Managed Internet Services in most of
       systems integrators, Internet service
                                                        the 26 carrier-neutral hotels in which it
       providers and content providers.
                                                        has a presence nationwide. Carrier-neutral
          In the first quarter, AT&T delivered a
                                                        hotels are facilities at which multiple
       significant improvement in wholesale
                                                        carriers interconnect and make their
       revenue trends, with total wholesale
                                                        telecommunications services available
       revenues of $3.4 billion, representing a
                                                        to their customers.
       decline of 3.9 percent versus results for the
                                                            In April, AT&T announced the availability
       year-earlier quarter. This marks a step up
                                                        of new Voice over Internet Protocol
       from declines in the 7 percent to 8 percent
                                                        services for wholesale customers. These
       range over the past several quarters, as
                                                        include a Gigabit Ethernet connectivity
       comparisons have reflected concessions
                                                        interface for AT&T Voice Over IP Connect
       associated with AT&T’s acquisition of
                                                        Service and the AT&T BusinessDirect®
       BellSouth Corp. and industry shifts as major
                                                        portal for AT&T Global Hubbing IP
       consolidated carriers move traffic
                                                        Access customers.
       to their own networks.
          Volume demand from wireless carriers,
                                                        NATIONAL MASS MARKETS
       Internet service providers and content
                                                        Mass market revenues totaled $730 million
       providers continues to accelerate, and
                                                        in the first quarter, representing a decline
       AT&T expects that wholesale revenues will
                                                        of 33.2 percent year over year. Results are
       continue to stabilize in 2008, as merger
                                                        as expected and reflect the 2004 decision
       conditions pass their one-year anniversary
                                                        to discontinue proactive marketing in this
       and carrier traffic migration nears
                                                        space and AT&T’s strategy of migrating
       completion.
                                                        customers within its regional footprint to its
          In addition, AT&T and IBM have announced
                                                        regional platforms to deliver better service
       an agreement that calls for AT&T to become
                                                        and a broader array of service options.
       the primary global network management
                                                           National mass markets, which represented
       services provider to IBM, which will use
                                                        4.1 percent of total wireline revenues in
       AT&T’s global telecommunications and
                                                        the first quarter, accounted for more than
       network management services internally
                                                        100 percent of AT&T’s year-over-year
       and provide these services to customers.
                                                        decline in total wireline revenues.
       As a result, AT&T expects to receive up
       to $5 billion of additional revenues over
       the five-year term of the agreement,
       largely in the wholesale customer category.
       These revenues are expected to ramp in
       mid-2008.
13
InvestorBriefing | 1Q 2008


                                                         WIRELINE VOICE SERVICES
                PRODUCT CATEGORIES
                                                         AT&T’s first-quarter wireline voice revenues,
                                                         which include retail local voice and long
       WIRELINE DATA SERVICES
                                                         distance as well as wholesale voice, totaled
       AT&T’s data revenues, which include results
                                                         $9.9 billion, representing a decline of
       from several customer categories, grew
                                                         7.1 percent versus results for the first quarter
       5.9 percent versus results for the year-earlier
                                                         of 2007. This comparison is consistent with
       first quarter to $6.2 billion.
                                                         results in recent quarters, reflecting the
          Data growth was led by an 18.2 percent
                                                         industrywide migration of voice usage
       increase in revenues from IP-based services,
                                                         from wired to wireless platforms, customer
       with continued gains in high speed Internet,
                                                         transitions to broadband and VoIP services
       managed Internet, VPN and hosting services.
                                                         and increased local voice competition.
       Data transport service revenues increased
       0.7 percent, and packet switched data
       revenues, which include Frame Relay and
       ATM services, were down 10.7 percent,
       consistent with industry trends.
          In the first quarter, 73.0 percent of AT&T’s
       data revenues came from retail business
       and consumer customers. These retail
       data revenues were up 7.9 percent versus
       results for the year-earlier quarter.
14
            InvestorBriefing | 1Q 2008


                                 Advertising
                                 & Publishing
                                 AT&T’s Advertising & Publishing segment offers businesses a full suite of local
  AT&T is a leader in local
                                 search options including print and Internet Yellow Pages in addition to Web site
    search with more than        design and search engine marketing.
                                    AT&T’s Advertising & Publishing operations deliver print directories to
1,250 print directories and      more than 83 million residences and businesses in 22 states and have a
                                 premier online presence nationwide with YELLOWPAGES.COM, which offers
      YELLOWPAGES.COM,           consumers access to local business information, the latest business listings,
                                 city guides, maps and driving directions. Combined, these print and online
   its fast-growing online       products receive approximately 5 billion consumer searches a year for local
                                 business information and provide more than 1 million advertisers with
           search service.       valuable sales leads to help their businesses grow.
                                    Advertising & Publishing revenue trends over the past several quarters
                                 have been generally stable, with print declines reflecting expected migration
                                 to electronic search, largely offset by rapid growth in YELLOWPAGES.COM.
                                 In the first quarter of 2008, Advertising & Publishing’s Internet revenues
                                 increased 41.1 percent versus the year-earlier quarter and 12.9 percent
                                 sequentially.
                                    In March, AT&T announced a distribution agreement with Microsoft Corp.
                                 that will put YELLOWPAGES.COM’s comprehensive advertising listings and
                                 content in front of consumers who use Microsoft’s local search sites. The
                                 agreement, launched in early April, gives YELLOWPAGES.COM advertisers
                                 exposure through Microsoft’s search pages within the Live Search and Live
                                 Search Maps properties, including MSN Yellow Pages.
                                    Compared with reported results in the year-earlier quarter, Advertising &
                                 Publishing revenues totaled $1.4 billion, unchanged from a reported
                                 $1.4 billion; operating expenses totaled $999 million, up from $976 million;
                                 and operating income totaled $418 million, compared with $467 million.
                                    Adjusted results for Advertising & Publishing exclude merger-related
                                 noncash amortization costs in both quarters. Compared with results in
                                 the year-earlier quarter, first-quarter 2008 adjusted operating expenses
                                 totaled $797 million, up from $744 million, and operating income totaled
                                 $620 million, compared with $699 million.
15
          InvestorBriefing | 1Q 2008


                               Other
                               AT&T’s Other segment includes results from AT&T’s Sterling Commerce
  AT&T’s Other segment
                               operations and AT&T’s customer information services operations, both of
includes results from its      which are included in segment revenues and operating expenses. Customer
                               information services include operator services and directory assistance.
Sterling Commerce unit,        Sterling Commerce is one of the world’s largest providers of multienterprise
                               collaboration solutions. The company serves the retail, consumer packaged
  customer information         goods, manufacturing, financial services, health care and telecommunications
                               industries.
    services and equity           The Other segment includes AT&T’s proportionate share of results from
                               Telmex and América Móvil, which are shown in the Equity in Net Income of
 investments in Telmex         Affiliates line for this segment. AT&T’s equity interest in each company is
                               more than 8 percent.
     and América Móvil.           América Móvil is one of the leading providers of telecommunications
                               services in Latin America, with more than 153 million wireless subscribers
                               in countries throughout the region, including 50 million in Mexico, at the
                               end of 2007.
                                  Telmex is the leading telecommunications company in Mexico. Telmex and
                               its subsidiaries provide a wide range of telecommunications services, data
                               and video transmission, Internet access and integrated telecommunications
                               solutions. Telmex also offers telecommunications services through its
                               international subsidiaries in countries including Argentina, Brazil, Chile,
                               Colombia, Ecuador, Peru and Uruguay.
                                  On a reported basis, Other segment income totaled $15 million in the
                               first quarter, versus $252 million in the year-earlier quarter. Other segment
                               results for the first quarter of 2008 include the company’s $374 million
                               workforce reduction charge. Segment revenues totaled $544 million,
                               unchanged from the first quarter of 2007. Equity in Net Income of Affiliates
                               totaled $241 million, up from $172 million in the year-earlier quarter.
                                  Adjusted Other segment income, which excludes merger-related and
                               workforce reduction costs, was $406 million, compared with $287 million
                               in the first quarter of 2007.
16
                        InvestorBriefing | 1Q 2008


AT&T Inc.
Consolidated Statements of Income (Unaudited)
(Dollars in Millions, Except per Share Amounts)
                                                                       Three Months Ended

                                                          3/31/08            3/31/07        % Change
Operating Revenues
  Voice                                                   $ 9,693           $10,455           -7.3%
  Data                                                         5,972             5,655         5.6%
  Wireless service                                            10,605             9,070        16.9%
  Directory                                                    1,398             1,022        36.8%
  Other                                                        3,076             2,767        11.2%
     Total Operating Revenues                                 30,744            28,969         6.1%
Operating Expenses
  Cost of services and sales (exclusive of depreciation
     and amortization shown separately below)                 11,775            11,252         4.6%
  Selling, general and administrative                          8,086             7,437         8.7%
  Depreciation and amortization                                4,903             5,616       -12.7%
     Total Operating Expenses                                 24,764            24,305         1.9%
Operating Income                                               5,980             4,664        28.2%
Interest Expense                                                865               873         -0.9%
Equity in Net Income of Affiliates                              243               173         40.5%
Other Income (Expense) – Net                                     33               504        -93.5%
Income Before Income Taxes                                     5,391             4,468        20.7%
Income Taxes                                                   1,930             1,620        19.1%
Net Income                                                $ 3,461           $ 2,848           21.5%

Basic Earnings Per Share                                  $     0.58        $     0.46        26.1%
Weighted Average Common Shares Outstanding (000,000)           5,997             6,224        -3.6%

Diluted Earnings Per Share                                $     0.57        $     0.45        26.7%
Weighted Average Common Shares Outstanding
  with Dilution (000,000)                                      6,033             6,266        -3.7%
17
                        InvestorBriefing | 1Q 2008


AT&T Inc.
Statements of Segment Income (Unaudited)
(Dollars in Millions)
                                                                   Three Months Ended

                                                     3/31/08             3/31/07        % Change
Wireless
Segment Operating Revenues
  Service                                            $10,645            $ 9,092           17.1%
  Equipment                                               1,180               905         30.4%
     Total Segment Operating Revenues                    11,825              9,997        18.3%
Segment Operating Expenses
  Cost of services and equipment sales                    4,110              3,670        12.0%
  Selling, general and administrative                     3,279              2,913        12.6%
  Depreciation and amortization                           1,480              1,891       -21.7%
     Total Segment Operating Expenses                     8,869              8,474         4.7%
Segment Operating Income                                  2,956              1,523        94.1%
Equity in Net Income of Affiliates                            2                  7       -71.4%
Minority Interest                                           (60)               (48)      -25.0%
Segment Income                                       $ 2,898            $ 1,482           95.5%

Wireline
Segment Operating Revenues
  Voice                                              $ 9,919            $10,677           -7.1%
  Data                                                    6,205              5,862         5.9%
  Other                                                   1,500              1,447         3.7%
     Total Segment Operating Revenues                    17,624             17,986        -2.0%
Segment Operating Expenses
  Cost of sales                                           7,616              7,558         0.8%
  Selling, general and administrative                     4,005              4,093        -2.2%
  Depreciation and amortization                           3,170              3,440        -7.8%
     Total Segment Operating Expenses                    14,791             15,091        -2.0%
Segment Income                                       $ 2,833            $ 2,895           -2.1%

Advertising & Publishing
Segment Operating Revenues                           $ 1,417            $ 1,443           -1.8%
Segment Operating Expenses
  Cost of sales                                            444                455         -2.4%
  Selling, general and administrative                      343                279         22.9%
  Depreciation and amortization                            212                242        -12.4%
     Total Segment Operating Expenses                      999                976          2.4%
Segment Income                                       $     418          $     467        -10.5%

Other
Segment Operating Revenues                           $     544          $     544             —
Segment Operating Expenses                                 770                464         65.9%
Segment Operating Income (Loss)                            (226)               80             —
Equity in Net Income of Affiliates                         241                172         40.1%
Segment Income                                       $      15          $     252        -94.0%
18
                        InvestorBriefing | 1Q 2008


AT&T Inc.
Consolidated Balance Sheets
(Dollars in Millions, Except per Share Amounts)
                                                                                        3/31/08        12/31/07

Assets                                                                              (Unaudited)
Current Assets
  Cash and cash equivalents                                                         $    1,963     $     1,970
  Accounts receivable – net of allowances for uncollectibles of $1,361 and $1,364       15,697          16,185
  Prepaid expenses                                                                       1,610           1,524
  Deferred income taxes                                                                  1,934           2,044
  Other current assets                                                                   2,742           2,963
     Total current assets                                                               23,946          24,686
Property, Plant and Equipment – Net                                                     96,238          95,890
Goodwill                                                                                70,815          70,713
Licenses                                                                                40,711          37,985
Customer Lists and Relationships – Net                                                  13,692          14,505
Other Intangible Assets – Net                                                            5,877           5,912
Investments in Equity Affiliates                                                         2,578           2,270
Postemployment Benefit                                                                  17,645          17,291
Other Assets                                                                             6,697           6,392
Total Assets                                                                        $278,199       $275,644

Liabilities and Stockholders’ Equity
Current Liabilities
  Debt maturing within one year                                                     $ 13,301       $     6,860
  Accounts payable and accrued liabilities                                              18,590          21,399
  Advanced billing and customer deposits                                                 3,677           3,571
  Accrued taxes                                                                          4,186           5,027
  Dividends payable                                                                      2,375           2,417
     Total current liabilities                                                          42,129          39,274
Long-Term Debt                                                                          60,189          57,255
Deferred Credits and Other Noncurrent Liabilities
  Deferred income taxes                                                                 25,203          24,939
  Postemployment benefit obligation                                                     24,510          24,011
  Unamortized investment tax credits                                                       144             150
  Other noncurrent liabilities                                                          13,766          14,648
     Total deferred credits and other noncurrent liabilities                            63,623          63,748
Stockholders’ Equity
  Common shares issued ($1 par value)                                                    6,495           6,495
  Capital in excess of par value                                                        91,598          91,638
  Retained earnings                                                                     34,311          33,297
  Treasury shares (at cost)                                                             (19,590)       (15,683)
  Accumulated other comprehensive loss                                                    (556)           (380)
     Total stockholders’ equity                                                      112,258        115,367
Total Liabilities and Stockholders’ Equity                                          $278,199       $275,644
19
                        InvestorBriefing | 1Q 2008


AT&T Inc.
Consolidated Statements of Cash Flows (Unaudited)
(Dollars in Millions, Increase (Decrease) in Cash and Cash Equivalents)
                                                                                           Three Months Ended

                                                                                       3/31/08            3/31/07
Operating Activities
Net income                                                                             $ 3,461           $ 2,848
Adjustments to reconcile net income to net cash provided by operating activities:
  Depreciation and amortization                                                         4,903              5,616
  Undistributed earnings from investments in equity affiliates                           (225)              (156)
  Provision for uncollectible accounts                                                    480                   376
  Amortization of investment tax credits                                                    (6)                  (8)
  Deferred income tax expense                                                             569                    65
  Net gain on sales of investments                                                         (46)                  —
  Gain on license exchange                                                                  —               (409)
  Changes in operating assets and liabilities:
     Accounts receivable                                                                 (150)                  237
     Other current assets                                                                 142               (748)
     Accounts payable and accrued liabilities                                           (4,654)           (3,232)
     Stock-based compensation tax benefit                                                   (7)                 (47)
  Other – net                                                                             490                   71
Total adjustments                                                                       1,496              1,765
Net Cash Provided by Operating Activities                                               4,957              4,613

Investing Activities
Construction and capital expenditures                                                   (4,247)           (3,338)
Acquisitions, net of cash acquired                                                      (3,662)             (198)
Dispositions                                                                               47                   209
Proceeds from sale of securities, net of investments                                      131                   518
Other                                                                                      32                     7
Net Cash Used in Investing Activities                                                   (7,699)           (2,802)

Financing Activities
Net change in short-term borrowings with original maturities of three months or less    5,786             (2,989)
Issuance of long-term debt                                                              3,972              5,924
Repayment of long-term debt                                                              (613)              (227)
Purchase of treasury shares                                                             (4,071)           (3,005)
Issuance of treasury shares                                                               103                   687
Dividends paid                                                                          (2,422)           (2,218)
Stock-based compensation tax benefit                                                         7                   47
Other                                                                                      (27)                 (84)
Net Cash Provided by (Used in) Financing Activities                                     2,735             (1,865)
Net decrease in cash and cash equivalents                                                   (7)                 (54)
Cash and cash equivalents beginning of year                                             1,970              2,418
Cash and Cash Equivalents End of Period                                                $ 1,963           $ 2,364
AT&T First-Quarter Earnings Package

Más contenido relacionado

La actualidad más candente

Press Release 3 Q02 Tele Celular Sul En
Press Release 3 Q02   Tele Celular Sul EnPress Release 3 Q02   Tele Celular Sul En
Press Release 3 Q02 Tele Celular Sul EnTIM RI
 
qwest communications q_2Q 05er
qwest communications q_2Q 05erqwest communications q_2Q 05er
qwest communications q_2Q 05erfinance19
 
bnsf 3Q 2008 Investors Report
bnsf 3Q 2008 Investors Reportbnsf 3Q 2008 Investors Report
bnsf 3Q 2008 Investors Reportfinance16
 
Press Release 4 Q00 Tele Celular Sul En
Press Release 4 Q00   Tele Celular Sul EnPress Release 4 Q00   Tele Celular Sul En
Press Release 4 Q00 Tele Celular Sul EnTIM RI
 
Press Release 1 Q04 Tele Celular Sul En
Press Release 1 Q04   Tele Celular Sul EnPress Release 1 Q04   Tele Celular Sul En
Press Release 1 Q04 Tele Celular Sul EnTIM RI
 
bnsf 1Q_2005_Investors_Report
bnsf 1Q_2005_Investors_Reportbnsf 1Q_2005_Investors_Report
bnsf 1Q_2005_Investors_Reportfinance16
 
RYDERFINAL2Q06slides
RYDERFINAL2Q06slidesRYDERFINAL2Q06slides
RYDERFINAL2Q06slidesfinance44
 
computer sciences FY 2002 Q1
computer sciences FY 2002 Q1computer sciences FY 2002 Q1
computer sciences FY 2002 Q1finance17
 
VIVO - Apresentation of 3rd Quarter 2006 Results
VIVO - Apresentation of 3rd Quarter 2006 ResultsVIVO - Apresentation of 3rd Quarter 2006 Results
VIVO - Apresentation of 3rd Quarter 2006 ResultsVIVO - Investor Relations
 
Press Release 3 Q03 Tele Celular Sul En
Press Release 3 Q03   Tele Celular Sul EnPress Release 3 Q03   Tele Celular Sul En
Press Release 3 Q03 Tele Celular Sul EnTIM RI
 
2Q_2005_Investors_Report
2Q_2005_Investors_Report2Q_2005_Investors_Report
2Q_2005_Investors_Reportfinance16
 
bnsf 1Q_2004_Investors_Report
bnsf 1Q_2004_Investors_Reportbnsf 1Q_2004_Investors_Report
bnsf 1Q_2004_Investors_Reportfinance16
 
Il&fs transportation networks ltd q2 fy12 result update
Il&fs transportation networks ltd   q2 fy12 result updateIl&fs transportation networks ltd   q2 fy12 result update
Il&fs transportation networks ltd q2 fy12 result updateKeynote Capitals Ltd.
 
bnsf 2Q 2007 Investors Report
bnsf 2Q 2007 Investors Reportbnsf 2Q 2007 Investors Report
bnsf 2Q 2007 Investors Reportfinance16
 
bnsf 2Q 2008 investors Report
bnsf 2Q 2008 investors Reportbnsf 2Q 2008 investors Report
bnsf 2Q 2008 investors Reportfinance16
 
charter communications 3Q_2008_Earnings_Presentation_vFINAL
charter communications 3Q_2008_Earnings_Presentation_vFINALcharter communications 3Q_2008_Earnings_Presentation_vFINAL
charter communications 3Q_2008_Earnings_Presentation_vFINALfinance34
 
4Q_2005_Investors_Report
4Q_2005_Investors_Report4Q_2005_Investors_Report
4Q_2005_Investors_Reportfinance16
 

La actualidad más candente (18)

Press Release 3 Q02 Tele Celular Sul En
Press Release 3 Q02   Tele Celular Sul EnPress Release 3 Q02   Tele Celular Sul En
Press Release 3 Q02 Tele Celular Sul En
 
qwest communications q_2Q 05er
qwest communications q_2Q 05erqwest communications q_2Q 05er
qwest communications q_2Q 05er
 
bnsf 3Q 2008 Investors Report
bnsf 3Q 2008 Investors Reportbnsf 3Q 2008 Investors Report
bnsf 3Q 2008 Investors Report
 
Press Release 4 Q00 Tele Celular Sul En
Press Release 4 Q00   Tele Celular Sul EnPress Release 4 Q00   Tele Celular Sul En
Press Release 4 Q00 Tele Celular Sul En
 
Q1 2009 Earning Report of Comcast Corp.
Q1 2009 Earning Report of Comcast Corp.Q1 2009 Earning Report of Comcast Corp.
Q1 2009 Earning Report of Comcast Corp.
 
Press Release 1 Q04 Tele Celular Sul En
Press Release 1 Q04   Tele Celular Sul EnPress Release 1 Q04   Tele Celular Sul En
Press Release 1 Q04 Tele Celular Sul En
 
bnsf 1Q_2005_Investors_Report
bnsf 1Q_2005_Investors_Reportbnsf 1Q_2005_Investors_Report
bnsf 1Q_2005_Investors_Report
 
RYDERFINAL2Q06slides
RYDERFINAL2Q06slidesRYDERFINAL2Q06slides
RYDERFINAL2Q06slides
 
computer sciences FY 2002 Q1
computer sciences FY 2002 Q1computer sciences FY 2002 Q1
computer sciences FY 2002 Q1
 
VIVO - Apresentation of 3rd Quarter 2006 Results
VIVO - Apresentation of 3rd Quarter 2006 ResultsVIVO - Apresentation of 3rd Quarter 2006 Results
VIVO - Apresentation of 3rd Quarter 2006 Results
 
Press Release 3 Q03 Tele Celular Sul En
Press Release 3 Q03   Tele Celular Sul EnPress Release 3 Q03   Tele Celular Sul En
Press Release 3 Q03 Tele Celular Sul En
 
2Q_2005_Investors_Report
2Q_2005_Investors_Report2Q_2005_Investors_Report
2Q_2005_Investors_Report
 
bnsf 1Q_2004_Investors_Report
bnsf 1Q_2004_Investors_Reportbnsf 1Q_2004_Investors_Report
bnsf 1Q_2004_Investors_Report
 
Il&fs transportation networks ltd q2 fy12 result update
Il&fs transportation networks ltd   q2 fy12 result updateIl&fs transportation networks ltd   q2 fy12 result update
Il&fs transportation networks ltd q2 fy12 result update
 
bnsf 2Q 2007 Investors Report
bnsf 2Q 2007 Investors Reportbnsf 2Q 2007 Investors Report
bnsf 2Q 2007 Investors Report
 
bnsf 2Q 2008 investors Report
bnsf 2Q 2008 investors Reportbnsf 2Q 2008 investors Report
bnsf 2Q 2008 investors Report
 
charter communications 3Q_2008_Earnings_Presentation_vFINAL
charter communications 3Q_2008_Earnings_Presentation_vFINALcharter communications 3Q_2008_Earnings_Presentation_vFINAL
charter communications 3Q_2008_Earnings_Presentation_vFINAL
 
4Q_2005_Investors_Report
4Q_2005_Investors_Report4Q_2005_Investors_Report
4Q_2005_Investors_Report
 

Destacado

WAL mart store2002 Financials
WAL mart store2002 FinancialsWAL mart store2002 Financials
WAL mart store2002 Financialsfinance1
 
AT&T Financial and Operational Results
AT&T Financial and Operational ResultsAT&T Financial and Operational Results
AT&T Financial and Operational Resultsfinance1
 
wal mart store 2001Financials
wal mart store 2001Financialswal mart store 2001Financials
wal mart store 2001Financialsfinance1
 
AT&TFinancial and Operational Results
AT&TFinancial and Operational ResultsAT&TFinancial and Operational Results
AT&TFinancial and Operational Resultsfinance1
 
Q1 2009 Analyst Presentation Final
Q1 2009 Analyst Presentation FinalQ1 2009 Analyst Presentation Final
Q1 2009 Analyst Presentation FinalRodrigo Aguilera
 
Eni 2008 Third Quarter Results
Eni 2008 Third Quarter ResultsEni 2008 Third Quarter Results
Eni 2008 Third Quarter Resultsearningsreport
 
Tyson Q1 09 financial results
Tyson Q1 09 financial resultsTyson Q1 09 financial results
Tyson Q1 09 financial resultsearningsreport
 
L.B. Foster Reports Fourth Quarter Operating Results
L.B. Foster Reports Fourth Quarter Operating ResultsL.B. Foster Reports Fourth Quarter Operating Results
L.B. Foster Reports Fourth Quarter Operating Resultsearningsreport
 
tesco Annual Report and Financial Statements 2008
tesco Annual Report and Financial Statements 2008tesco Annual Report and Financial Statements 2008
tesco Annual Report and Financial Statements 2008earningsreport
 
Dexia 3Q Financial Earnings 2008
Dexia 3Q Financial Earnings 2008Dexia 3Q Financial Earnings 2008
Dexia 3Q Financial Earnings 2008earningsreport
 

Destacado (11)

WAL mart store2002 Financials
WAL mart store2002 FinancialsWAL mart store2002 Financials
WAL mart store2002 Financials
 
AT&T Financial and Operational Results
AT&T Financial and Operational ResultsAT&T Financial and Operational Results
AT&T Financial and Operational Results
 
wal mart store 2001Financials
wal mart store 2001Financialswal mart store 2001Financials
wal mart store 2001Financials
 
AT&TFinancial and Operational Results
AT&TFinancial and Operational ResultsAT&TFinancial and Operational Results
AT&TFinancial and Operational Results
 
Q1 2009 Analyst Presentation Final
Q1 2009 Analyst Presentation FinalQ1 2009 Analyst Presentation Final
Q1 2009 Analyst Presentation Final
 
Eni 2008 Third Quarter Results
Eni 2008 Third Quarter ResultsEni 2008 Third Quarter Results
Eni 2008 Third Quarter Results
 
Tyson Q1 09 financial results
Tyson Q1 09 financial resultsTyson Q1 09 financial results
Tyson Q1 09 financial results
 
Q1 2009 Earning Report of Exxon Mobil Corp.
Q1 2009 Earning Report of Exxon Mobil Corp.Q1 2009 Earning Report of Exxon Mobil Corp.
Q1 2009 Earning Report of Exxon Mobil Corp.
 
L.B. Foster Reports Fourth Quarter Operating Results
L.B. Foster Reports Fourth Quarter Operating ResultsL.B. Foster Reports Fourth Quarter Operating Results
L.B. Foster Reports Fourth Quarter Operating Results
 
tesco Annual Report and Financial Statements 2008
tesco Annual Report and Financial Statements 2008tesco Annual Report and Financial Statements 2008
tesco Annual Report and Financial Statements 2008
 
Dexia 3Q Financial Earnings 2008
Dexia 3Q Financial Earnings 2008Dexia 3Q Financial Earnings 2008
Dexia 3Q Financial Earnings 2008
 

Similar a AT&T First-Quarter Earnings Package

AT &T Quarterly Earnings - 3Q 2008
AT &T Quarterly Earnings - 3Q 2008AT &T Quarterly Earnings - 3Q 2008
AT &T Quarterly Earnings - 3Q 2008earningsreport
 
liberty global Q3_2008__Presentation
liberty global Q3_2008__Presentationliberty global Q3_2008__Presentation
liberty global Q3_2008__Presentationfinance43
 
liberty global Q3_2008__Presentation
liberty global Q3_2008__Presentationliberty global Q3_2008__Presentation
liberty global Q3_2008__Presentationfinance43
 
Verizon Reports Sustained Revenue Growth and Continued Strong Cash Flows fo...
 	Verizon Reports Sustained Revenue Growth and Continued Strong Cash Flows fo... 	Verizon Reports Sustained Revenue Growth and Continued Strong Cash Flows fo...
Verizon Reports Sustained Revenue Growth and Continued Strong Cash Flows fo...finance2
 
qwest communications Q_1Q07er
qwest communications Q_1Q07erqwest communications Q_1Q07er
qwest communications Q_1Q07erfinance19
 
air products & chemicals fy 08 q2 earnings
air products & chemicals fy 08 q2 earningsair products & chemicals fy 08 q2 earnings
air products & chemicals fy 08 q2 earningsfinance26
 
2009q1 AT&T Earnings Slides
2009q1 AT&T Earnings Slides2009q1 AT&T Earnings Slides
2009q1 AT&T Earnings SlidesPhil Wolff
 
qwest communications Q_2Q07_er2
qwest communications Q_2Q07_er2qwest communications Q_2Q07_er2
qwest communications Q_2Q07_er2finance19
 
qwest communications q_q1 05er
qwest communications q_q1 05erqwest communications q_q1 05er
qwest communications q_q1 05erfinance19
 
qwest communications 2Q 08 Earnings Release
qwest communications 2Q 08 Earnings Releaseqwest communications 2Q 08 Earnings Release
qwest communications 2Q 08 Earnings Releasefinance19
 
qwest communications Q3 04
qwest communications Q3 04qwest communications Q3 04
qwest communications Q3 04finance19
 
Q3 2008 Earnings Press Release and Financial Tables
 	Q3 2008 Earnings Press Release and Financial Tables 	Q3 2008 Earnings Press Release and Financial Tables
Q3 2008 Earnings Press Release and Financial Tablesfinance7
 
charter communications 3Q_2008_Earnings_Presentation_vFINAL
charter communications 3Q_2008_Earnings_Presentation_vFINALcharter communications 3Q_2008_Earnings_Presentation_vFINAL
charter communications 3Q_2008_Earnings_Presentation_vFINALfinance34
 
2007 - Second Quarter Results 2007
2007 - Second Quarter Results 20072007 - Second Quarter Results 2007
2007 - Second Quarter Results 2007Embraer RI
 
First Quarter 2009 Results
First Quarter 2009 ResultsFirst Quarter 2009 Results
First Quarter 2009 ResultsGruppo TIM
 
prezentare rezultate financiare pe 2008 Deutsche Telekom
prezentare rezultate financiare pe 2008 Deutsche Telekomprezentare rezultate financiare pe 2008 Deutsche Telekom
prezentare rezultate financiare pe 2008 Deutsche Telekomaseceleanu
 
qwest communications q_3Q 05er
qwest communications q_3Q 05erqwest communications q_3Q 05er
qwest communications q_3Q 05erfinance19
 
qwest communications q_q4 04er
qwest communications q_q4 04erqwest communications q_q4 04er
qwest communications q_q4 04erfinance19
 
virgin media.Q3_08_Presentation
virgin media.Q3_08_Presentationvirgin media.Q3_08_Presentation
virgin media.Q3_08_Presentationfinance28
 

Similar a AT&T First-Quarter Earnings Package (20)

AT &T Quarterly Earnings - 3Q 2008
AT &T Quarterly Earnings - 3Q 2008AT &T Quarterly Earnings - 3Q 2008
AT &T Quarterly Earnings - 3Q 2008
 
liberty global Q3_2008__Presentation
liberty global Q3_2008__Presentationliberty global Q3_2008__Presentation
liberty global Q3_2008__Presentation
 
liberty global Q3_2008__Presentation
liberty global Q3_2008__Presentationliberty global Q3_2008__Presentation
liberty global Q3_2008__Presentation
 
Verizon Reports Sustained Revenue Growth and Continued Strong Cash Flows fo...
 	Verizon Reports Sustained Revenue Growth and Continued Strong Cash Flows fo... 	Verizon Reports Sustained Revenue Growth and Continued Strong Cash Flows fo...
Verizon Reports Sustained Revenue Growth and Continued Strong Cash Flows fo...
 
qwest communications Q_1Q07er
qwest communications Q_1Q07erqwest communications Q_1Q07er
qwest communications Q_1Q07er
 
Ebay 2008 Q4 results
Ebay  2008 Q4 resultsEbay  2008 Q4 results
Ebay 2008 Q4 results
 
air products & chemicals fy 08 q2 earnings
air products & chemicals fy 08 q2 earningsair products & chemicals fy 08 q2 earnings
air products & chemicals fy 08 q2 earnings
 
2009q1 AT&T Earnings Slides
2009q1 AT&T Earnings Slides2009q1 AT&T Earnings Slides
2009q1 AT&T Earnings Slides
 
qwest communications Q_2Q07_er2
qwest communications Q_2Q07_er2qwest communications Q_2Q07_er2
qwest communications Q_2Q07_er2
 
qwest communications q_q1 05er
qwest communications q_q1 05erqwest communications q_q1 05er
qwest communications q_q1 05er
 
qwest communications 2Q 08 Earnings Release
qwest communications 2Q 08 Earnings Releaseqwest communications 2Q 08 Earnings Release
qwest communications 2Q 08 Earnings Release
 
qwest communications Q3 04
qwest communications Q3 04qwest communications Q3 04
qwest communications Q3 04
 
Q3 2008 Earnings Press Release and Financial Tables
 	Q3 2008 Earnings Press Release and Financial Tables 	Q3 2008 Earnings Press Release and Financial Tables
Q3 2008 Earnings Press Release and Financial Tables
 
charter communications 3Q_2008_Earnings_Presentation_vFINAL
charter communications 3Q_2008_Earnings_Presentation_vFINALcharter communications 3Q_2008_Earnings_Presentation_vFINAL
charter communications 3Q_2008_Earnings_Presentation_vFINAL
 
2007 - Second Quarter Results 2007
2007 - Second Quarter Results 20072007 - Second Quarter Results 2007
2007 - Second Quarter Results 2007
 
First Quarter 2009 Results
First Quarter 2009 ResultsFirst Quarter 2009 Results
First Quarter 2009 Results
 
prezentare rezultate financiare pe 2008 Deutsche Telekom
prezentare rezultate financiare pe 2008 Deutsche Telekomprezentare rezultate financiare pe 2008 Deutsche Telekom
prezentare rezultate financiare pe 2008 Deutsche Telekom
 
qwest communications q_3Q 05er
qwest communications q_3Q 05erqwest communications q_3Q 05er
qwest communications q_3Q 05er
 
qwest communications q_q4 04er
qwest communications q_q4 04erqwest communications q_q4 04er
qwest communications q_q4 04er
 
virgin media.Q3_08_Presentation
virgin media.Q3_08_Presentationvirgin media.Q3_08_Presentation
virgin media.Q3_08_Presentation
 

Más de finance1

GE# 2000 Proxy Statement
GE# 2000 Proxy Statement GE# 2000 Proxy Statement
GE# 2000 Proxy Statement finance1
 
GE# 2001 Proxy Statement (PDF)
GE# 2001 Proxy Statement (PDF)GE# 2001 Proxy Statement (PDF)
GE# 2001 Proxy Statement (PDF)finance1
 
GE# 2002 Proxy Statement
GE# 2002 Proxy Statement GE# 2002 Proxy Statement
GE# 2002 Proxy Statement finance1
 
GE# 2003 Proxy Statement
GE# 2003 Proxy Statement GE# 2003 Proxy Statement
GE# 2003 Proxy Statement finance1
 
GE# 2004 Proxy Statement
GE# 2004 Proxy Statement GE# 2004 Proxy Statement
GE# 2004 Proxy Statement finance1
 
GE# 2005 Proxy Statement
GE# 2005 Proxy Statement GE# 2005 Proxy Statement
GE# 2005 Proxy Statement finance1
 
GE# 2006 Proxy Statement
GE# 2006 Proxy Statement GE# 2006 Proxy Statement
GE# 2006 Proxy Statement finance1
 
onoco phillips 2004First Quarter
onoco phillips 2004First Quarteronoco phillips 2004First Quarter
onoco phillips 2004First Quarterfinance1
 
conoco phillips 2004Second Quarter
conoco phillips 2004Second Quarterconoco phillips 2004Second Quarter
conoco phillips 2004Second Quarterfinance1
 
conoco phillips 2004Third Quarter
conoco phillips 2004Third Quarterconoco phillips 2004Third Quarter
conoco phillips 2004Third Quarterfinance1
 
conoco phillips 2004Fourth Quarter
conoco phillips 2004Fourth Quarterconoco phillips 2004Fourth Quarter
conoco phillips 2004Fourth Quarterfinance1
 
conoco phillips 2005First Quarter
conoco phillips 2005First Quarterconoco phillips 2005First Quarter
conoco phillips 2005First Quarterfinance1
 
conoco phillips 2005Third Quarter
conoco phillips 2005Third Quarterconoco phillips 2005Third Quarter
conoco phillips 2005Third Quarterfinance1
 
conoco phillips 2005Fourth Quarter
conoco phillips 2005Fourth Quarterconoco phillips 2005Fourth Quarter
conoco phillips 2005Fourth Quarterfinance1
 
conoco phillips 2006First Quarter
conoco phillips 2006First Quarter conoco phillips 2006First Quarter
conoco phillips 2006First Quarter finance1
 
conoco phillips 2006Second Quarter
conoco phillips 2006Second Quarterconoco phillips 2006Second Quarter
conoco phillips 2006Second Quarterfinance1
 
conoco phillips 2006Third Quarter
conoco phillips 2006Third Quarterconoco phillips 2006Third Quarter
conoco phillips 2006Third Quarterfinance1
 
conoco phillips 2006Fourth Quarter
conoco phillips 2006Fourth Quarterconoco phillips 2006Fourth Quarter
conoco phillips 2006Fourth Quarterfinance1
 
conoco phillips 2007First Quarter
conoco phillips 2007First Quarterconoco phillips 2007First Quarter
conoco phillips 2007First Quarterfinance1
 
conoco phillips 2007Third Quarter
conoco phillips 2007Third Quarterconoco phillips 2007Third Quarter
conoco phillips 2007Third Quarterfinance1
 

Más de finance1 (20)

GE# 2000 Proxy Statement
GE# 2000 Proxy Statement GE# 2000 Proxy Statement
GE# 2000 Proxy Statement
 
GE# 2001 Proxy Statement (PDF)
GE# 2001 Proxy Statement (PDF)GE# 2001 Proxy Statement (PDF)
GE# 2001 Proxy Statement (PDF)
 
GE# 2002 Proxy Statement
GE# 2002 Proxy Statement GE# 2002 Proxy Statement
GE# 2002 Proxy Statement
 
GE# 2003 Proxy Statement
GE# 2003 Proxy Statement GE# 2003 Proxy Statement
GE# 2003 Proxy Statement
 
GE# 2004 Proxy Statement
GE# 2004 Proxy Statement GE# 2004 Proxy Statement
GE# 2004 Proxy Statement
 
GE# 2005 Proxy Statement
GE# 2005 Proxy Statement GE# 2005 Proxy Statement
GE# 2005 Proxy Statement
 
GE# 2006 Proxy Statement
GE# 2006 Proxy Statement GE# 2006 Proxy Statement
GE# 2006 Proxy Statement
 
onoco phillips 2004First Quarter
onoco phillips 2004First Quarteronoco phillips 2004First Quarter
onoco phillips 2004First Quarter
 
conoco phillips 2004Second Quarter
conoco phillips 2004Second Quarterconoco phillips 2004Second Quarter
conoco phillips 2004Second Quarter
 
conoco phillips 2004Third Quarter
conoco phillips 2004Third Quarterconoco phillips 2004Third Quarter
conoco phillips 2004Third Quarter
 
conoco phillips 2004Fourth Quarter
conoco phillips 2004Fourth Quarterconoco phillips 2004Fourth Quarter
conoco phillips 2004Fourth Quarter
 
conoco phillips 2005First Quarter
conoco phillips 2005First Quarterconoco phillips 2005First Quarter
conoco phillips 2005First Quarter
 
conoco phillips 2005Third Quarter
conoco phillips 2005Third Quarterconoco phillips 2005Third Quarter
conoco phillips 2005Third Quarter
 
conoco phillips 2005Fourth Quarter
conoco phillips 2005Fourth Quarterconoco phillips 2005Fourth Quarter
conoco phillips 2005Fourth Quarter
 
conoco phillips 2006First Quarter
conoco phillips 2006First Quarter conoco phillips 2006First Quarter
conoco phillips 2006First Quarter
 
conoco phillips 2006Second Quarter
conoco phillips 2006Second Quarterconoco phillips 2006Second Quarter
conoco phillips 2006Second Quarter
 
conoco phillips 2006Third Quarter
conoco phillips 2006Third Quarterconoco phillips 2006Third Quarter
conoco phillips 2006Third Quarter
 
conoco phillips 2006Fourth Quarter
conoco phillips 2006Fourth Quarterconoco phillips 2006Fourth Quarter
conoco phillips 2006Fourth Quarter
 
conoco phillips 2007First Quarter
conoco phillips 2007First Quarterconoco phillips 2007First Quarter
conoco phillips 2007First Quarter
 
conoco phillips 2007Third Quarter
conoco phillips 2007Third Quarterconoco phillips 2007Third Quarter
conoco phillips 2007Third Quarter
 

Último

The Economic History of the U.S. Lecture 25.pdf
The Economic History of the U.S. Lecture 25.pdfThe Economic History of the U.S. Lecture 25.pdf
The Economic History of the U.S. Lecture 25.pdfGale Pooley
 
(DIYA) Bhumkar Chowk Call Girls Just Call 7001035870 [ Cash on Delivery ] Pun...
(DIYA) Bhumkar Chowk Call Girls Just Call 7001035870 [ Cash on Delivery ] Pun...(DIYA) Bhumkar Chowk Call Girls Just Call 7001035870 [ Cash on Delivery ] Pun...
(DIYA) Bhumkar Chowk Call Girls Just Call 7001035870 [ Cash on Delivery ] Pun...ranjana rawat
 
Booking open Available Pune Call Girls Talegaon Dabhade 6297143586 Call Hot ...
Booking open Available Pune Call Girls Talegaon Dabhade  6297143586 Call Hot ...Booking open Available Pune Call Girls Talegaon Dabhade  6297143586 Call Hot ...
Booking open Available Pune Call Girls Talegaon Dabhade 6297143586 Call Hot ...Call Girls in Nagpur High Profile
 
The Economic History of the U.S. Lecture 19.pdf
The Economic History of the U.S. Lecture 19.pdfThe Economic History of the U.S. Lecture 19.pdf
The Economic History of the U.S. Lecture 19.pdfGale Pooley
 
Call US 📞 9892124323 ✅ Kurla Call Girls In Kurla ( Mumbai ) secure service
Call US 📞 9892124323 ✅ Kurla Call Girls In Kurla ( Mumbai ) secure serviceCall US 📞 9892124323 ✅ Kurla Call Girls In Kurla ( Mumbai ) secure service
Call US 📞 9892124323 ✅ Kurla Call Girls In Kurla ( Mumbai ) secure servicePooja Nehwal
 
WhatsApp 📞 Call : 9892124323 ✅Call Girls In Chembur ( Mumbai ) secure service
WhatsApp 📞 Call : 9892124323  ✅Call Girls In Chembur ( Mumbai ) secure serviceWhatsApp 📞 Call : 9892124323  ✅Call Girls In Chembur ( Mumbai ) secure service
WhatsApp 📞 Call : 9892124323 ✅Call Girls In Chembur ( Mumbai ) secure servicePooja Nehwal
 
Gurley shaw Theory of Monetary Economics.
Gurley shaw Theory of Monetary Economics.Gurley shaw Theory of Monetary Economics.
Gurley shaw Theory of Monetary Economics.Vinodha Devi
 
The Economic History of the U.S. Lecture 30.pdf
The Economic History of the U.S. Lecture 30.pdfThe Economic History of the U.S. Lecture 30.pdf
The Economic History of the U.S. Lecture 30.pdfGale Pooley
 
TEST BANK For Corporate Finance, 13th Edition By Stephen Ross, Randolph Weste...
TEST BANK For Corporate Finance, 13th Edition By Stephen Ross, Randolph Weste...TEST BANK For Corporate Finance, 13th Edition By Stephen Ross, Randolph Weste...
TEST BANK For Corporate Finance, 13th Edition By Stephen Ross, Randolph Weste...ssifa0344
 
Solution Manual for Financial Accounting, 11th Edition by Robert Libby, Patri...
Solution Manual for Financial Accounting, 11th Edition by Robert Libby, Patri...Solution Manual for Financial Accounting, 11th Edition by Robert Libby, Patri...
Solution Manual for Financial Accounting, 11th Edition by Robert Libby, Patri...ssifa0344
 
02_Fabio Colombo_Accenture_MeetupDora&Cybersecurity.pptx
02_Fabio Colombo_Accenture_MeetupDora&Cybersecurity.pptx02_Fabio Colombo_Accenture_MeetupDora&Cybersecurity.pptx
02_Fabio Colombo_Accenture_MeetupDora&Cybersecurity.pptxFinTech Belgium
 
Pooja 9892124323 : Call Girl in Juhu Escorts Service Free Home Delivery
Pooja 9892124323 : Call Girl in Juhu Escorts Service Free Home DeliveryPooja 9892124323 : Call Girl in Juhu Escorts Service Free Home Delivery
Pooja 9892124323 : Call Girl in Juhu Escorts Service Free Home DeliveryPooja Nehwal
 
The Economic History of the U.S. Lecture 23.pdf
The Economic History of the U.S. Lecture 23.pdfThe Economic History of the U.S. Lecture 23.pdf
The Economic History of the U.S. Lecture 23.pdfGale Pooley
 
Stock Market Brief Deck (Under Pressure).pdf
Stock Market Brief Deck (Under Pressure).pdfStock Market Brief Deck (Under Pressure).pdf
Stock Market Brief Deck (Under Pressure).pdfMichael Silva
 
Booking open Available Pune Call Girls Wadgaon Sheri 6297143586 Call Hot Ind...
Booking open Available Pune Call Girls Wadgaon Sheri  6297143586 Call Hot Ind...Booking open Available Pune Call Girls Wadgaon Sheri  6297143586 Call Hot Ind...
Booking open Available Pune Call Girls Wadgaon Sheri 6297143586 Call Hot Ind...Call Girls in Nagpur High Profile
 
Indore Real Estate Market Trends Report.pdf
Indore Real Estate Market Trends Report.pdfIndore Real Estate Market Trends Report.pdf
Indore Real Estate Market Trends Report.pdfSaviRakhecha1
 
Call Girls Koregaon Park Call Me 7737669865 Budget Friendly No Advance Booking
Call Girls Koregaon Park Call Me 7737669865 Budget Friendly No Advance BookingCall Girls Koregaon Park Call Me 7737669865 Budget Friendly No Advance Booking
Call Girls Koregaon Park Call Me 7737669865 Budget Friendly No Advance Bookingroncy bisnoi
 
High Class Call Girls Nagpur Grishma Call 7001035870 Meet With Nagpur Escorts
High Class Call Girls Nagpur Grishma Call 7001035870 Meet With Nagpur EscortsHigh Class Call Girls Nagpur Grishma Call 7001035870 Meet With Nagpur Escorts
High Class Call Girls Nagpur Grishma Call 7001035870 Meet With Nagpur Escortsranjana rawat
 
The Economic History of the U.S. Lecture 21.pdf
The Economic History of the U.S. Lecture 21.pdfThe Economic History of the U.S. Lecture 21.pdf
The Economic History of the U.S. Lecture 21.pdfGale Pooley
 
Independent Call Girl Number in Kurla Mumbai📲 Pooja Nehwal 9892124323 💞 Full ...
Independent Call Girl Number in Kurla Mumbai📲 Pooja Nehwal 9892124323 💞 Full ...Independent Call Girl Number in Kurla Mumbai📲 Pooja Nehwal 9892124323 💞 Full ...
Independent Call Girl Number in Kurla Mumbai📲 Pooja Nehwal 9892124323 💞 Full ...Pooja Nehwal
 

Último (20)

The Economic History of the U.S. Lecture 25.pdf
The Economic History of the U.S. Lecture 25.pdfThe Economic History of the U.S. Lecture 25.pdf
The Economic History of the U.S. Lecture 25.pdf
 
(DIYA) Bhumkar Chowk Call Girls Just Call 7001035870 [ Cash on Delivery ] Pun...
(DIYA) Bhumkar Chowk Call Girls Just Call 7001035870 [ Cash on Delivery ] Pun...(DIYA) Bhumkar Chowk Call Girls Just Call 7001035870 [ Cash on Delivery ] Pun...
(DIYA) Bhumkar Chowk Call Girls Just Call 7001035870 [ Cash on Delivery ] Pun...
 
Booking open Available Pune Call Girls Talegaon Dabhade 6297143586 Call Hot ...
Booking open Available Pune Call Girls Talegaon Dabhade  6297143586 Call Hot ...Booking open Available Pune Call Girls Talegaon Dabhade  6297143586 Call Hot ...
Booking open Available Pune Call Girls Talegaon Dabhade 6297143586 Call Hot ...
 
The Economic History of the U.S. Lecture 19.pdf
The Economic History of the U.S. Lecture 19.pdfThe Economic History of the U.S. Lecture 19.pdf
The Economic History of the U.S. Lecture 19.pdf
 
Call US 📞 9892124323 ✅ Kurla Call Girls In Kurla ( Mumbai ) secure service
Call US 📞 9892124323 ✅ Kurla Call Girls In Kurla ( Mumbai ) secure serviceCall US 📞 9892124323 ✅ Kurla Call Girls In Kurla ( Mumbai ) secure service
Call US 📞 9892124323 ✅ Kurla Call Girls In Kurla ( Mumbai ) secure service
 
WhatsApp 📞 Call : 9892124323 ✅Call Girls In Chembur ( Mumbai ) secure service
WhatsApp 📞 Call : 9892124323  ✅Call Girls In Chembur ( Mumbai ) secure serviceWhatsApp 📞 Call : 9892124323  ✅Call Girls In Chembur ( Mumbai ) secure service
WhatsApp 📞 Call : 9892124323 ✅Call Girls In Chembur ( Mumbai ) secure service
 
Gurley shaw Theory of Monetary Economics.
Gurley shaw Theory of Monetary Economics.Gurley shaw Theory of Monetary Economics.
Gurley shaw Theory of Monetary Economics.
 
The Economic History of the U.S. Lecture 30.pdf
The Economic History of the U.S. Lecture 30.pdfThe Economic History of the U.S. Lecture 30.pdf
The Economic History of the U.S. Lecture 30.pdf
 
TEST BANK For Corporate Finance, 13th Edition By Stephen Ross, Randolph Weste...
TEST BANK For Corporate Finance, 13th Edition By Stephen Ross, Randolph Weste...TEST BANK For Corporate Finance, 13th Edition By Stephen Ross, Randolph Weste...
TEST BANK For Corporate Finance, 13th Edition By Stephen Ross, Randolph Weste...
 
Solution Manual for Financial Accounting, 11th Edition by Robert Libby, Patri...
Solution Manual for Financial Accounting, 11th Edition by Robert Libby, Patri...Solution Manual for Financial Accounting, 11th Edition by Robert Libby, Patri...
Solution Manual for Financial Accounting, 11th Edition by Robert Libby, Patri...
 
02_Fabio Colombo_Accenture_MeetupDora&Cybersecurity.pptx
02_Fabio Colombo_Accenture_MeetupDora&Cybersecurity.pptx02_Fabio Colombo_Accenture_MeetupDora&Cybersecurity.pptx
02_Fabio Colombo_Accenture_MeetupDora&Cybersecurity.pptx
 
Pooja 9892124323 : Call Girl in Juhu Escorts Service Free Home Delivery
Pooja 9892124323 : Call Girl in Juhu Escorts Service Free Home DeliveryPooja 9892124323 : Call Girl in Juhu Escorts Service Free Home Delivery
Pooja 9892124323 : Call Girl in Juhu Escorts Service Free Home Delivery
 
The Economic History of the U.S. Lecture 23.pdf
The Economic History of the U.S. Lecture 23.pdfThe Economic History of the U.S. Lecture 23.pdf
The Economic History of the U.S. Lecture 23.pdf
 
Stock Market Brief Deck (Under Pressure).pdf
Stock Market Brief Deck (Under Pressure).pdfStock Market Brief Deck (Under Pressure).pdf
Stock Market Brief Deck (Under Pressure).pdf
 
Booking open Available Pune Call Girls Wadgaon Sheri 6297143586 Call Hot Ind...
Booking open Available Pune Call Girls Wadgaon Sheri  6297143586 Call Hot Ind...Booking open Available Pune Call Girls Wadgaon Sheri  6297143586 Call Hot Ind...
Booking open Available Pune Call Girls Wadgaon Sheri 6297143586 Call Hot Ind...
 
Indore Real Estate Market Trends Report.pdf
Indore Real Estate Market Trends Report.pdfIndore Real Estate Market Trends Report.pdf
Indore Real Estate Market Trends Report.pdf
 
Call Girls Koregaon Park Call Me 7737669865 Budget Friendly No Advance Booking
Call Girls Koregaon Park Call Me 7737669865 Budget Friendly No Advance BookingCall Girls Koregaon Park Call Me 7737669865 Budget Friendly No Advance Booking
Call Girls Koregaon Park Call Me 7737669865 Budget Friendly No Advance Booking
 
High Class Call Girls Nagpur Grishma Call 7001035870 Meet With Nagpur Escorts
High Class Call Girls Nagpur Grishma Call 7001035870 Meet With Nagpur EscortsHigh Class Call Girls Nagpur Grishma Call 7001035870 Meet With Nagpur Escorts
High Class Call Girls Nagpur Grishma Call 7001035870 Meet With Nagpur Escorts
 
The Economic History of the U.S. Lecture 21.pdf
The Economic History of the U.S. Lecture 21.pdfThe Economic History of the U.S. Lecture 21.pdf
The Economic History of the U.S. Lecture 21.pdf
 
Independent Call Girl Number in Kurla Mumbai📲 Pooja Nehwal 9892124323 💞 Full ...
Independent Call Girl Number in Kurla Mumbai📲 Pooja Nehwal 9892124323 💞 Full ...Independent Call Girl Number in Kurla Mumbai📲 Pooja Nehwal 9892124323 💞 Full ...
Independent Call Girl Number in Kurla Mumbai📲 Pooja Nehwal 9892124323 💞 Full ...
 

AT&T First-Quarter Earnings Package

  • 1. InvestorBriefing No. 260 | April 22, 2008 1st QUARTER 2008 AT&T Ramps Revenue Growth, Delivers Strong First-Quarter Results; Growth Highlighted by Gains in Wireless, Broadband and Enterprise Services Results mark AT&T’s AT&T Inc. reported strong first-quarter results highlighted by a significant ramp in consolidated revenue growth, 12th consecutive quarter led by improved results in wireless and enterprise, and of double-digit growth in further expansion of wireless margins. adjusted earnings per share. • Wireless revenues increased 18.3 percent versus the year-earlier first quarter, driven by strong subscriber gains and continued robust growth in wireless data services such as Internet access, e-mail, messaging, data access and media bundles. AT&T is the U.S. market leader in wireless with 71.4 million subscribers. Wireless margins expanded significantly, reflecting continued network and operational improvements. • Enterprise customer revenue growth took another step up, led by a 22.9 percent increase in revenues from Internet Protocol (IP)-based data services such as virtual private networks (VPNs), hosting and managed Internet services. AT&T is the industry leader in serving large business customers on six continents. First-Quarter EPS Reconciliation 1Q08 1Q07 Reported EPS . . . . . . . . . . . . . . . . . . ..................................................... $0.57 $0.45 Adjustments to results: Merger integration costs . . . . . . . . . . . . . . . . . . . . . . . . . . . . . . . . . . . . . . . . . . . . . . . . . . . . . . . . . . . . 0.02 Noncash merger-related costs . . . . . . . . . . . . . . . . . . . . . . . . . . . . . . . . . . . . . . . . . . . . . . . . . . . . . . . 0.13 0.21 Gains from wireless transactions . . . . . . . . . . . . . . . . . . . . . . . . . . . . . . . . . . . . . . . . . . . . . . . . . . . . . (0.04) Workforce reduction . . . . . . . . . . . . . . . . . . . . . . . . . . . . . . . . . . . . . . . . . . . . . . . . . . . . . . . . . . . . . . . 0.04 Adjusted EPS . . . . . . . . . . . . . . . . . . . . . . . . . . . . . . . . . . . . . . . . . . . . . . . . . . . . . . . . . . . . . . . . . . . . . . $0.74 $0.65 Pretax adjustments to earnings: in 1Q07, merger integration, noncash intangible amortization and purchase accounting effect totaling $2,306 million and a gain from wireless transactions of $(409) million; in 1Q08, noncash intangible amortization totaling $1,208 million and a workforce reduction charge of $374 million. Totals may not foot due to rounding.
  • 2. 2 InvestorBriefing | 1Q 2008 REPORTED RESULTS AT&T CONSOLIDATED ADJUSTED REVENUE GROWTH RATES Compared with results for the year-earlier Year-Over-Year, Pro Forma AT&T continues to quarter, AT&T’s reported operating expenses 4.6% accelerate growth for the first quarter of 2008 were $24.8 billion, in consolidated up from $24.3 billion; reported operating income was $6.0 billion, up from $4.7 billion; revenues, driven by 3.2% and AT&T’s reported operating income margin gains in wireless, 2.9% was 19.5 percent, up from 16.1 percent. broadband and AT&T’s reported first-quarter 2008 net enterprise services. 2.0% 1.7% income totaled $3.5 billion, up 21.5 percent from $2.8 billion in the year-earlier quarter, and reported earnings per diluted share totaled $0.57, up 26.7 percent from $0.45 in the first quarter of 2007. 1Q07 2Q07 3Q07 4Q07 1Q08 Revenues for 2007 are adjusted to exclude merger-related directory DOUBLE-DIGIT GROWTH IN accounting impacts. 2007 comparisons are to 2006 pro forma ADJUSTED EARNINGS PER SHARE results, which combine revenues from AT&T, BellSouth and Cingular Wireless consistently for all periods. AT&T’s adjusted results for the first quarter of 2008 exclude merger-related amortization • Broadband revenues continued their record expenses and costs associated with a of solid double-digit growth, reflecting workforce reduction. Adjusted results for subscriber gains and an increased number the first quarter of 2007 excluded merger- of subscribers who select higher-speed related costs and accounting effects as service. AT&T is the U.S. leader in broad- well as gains from wireless transactions. band service with 14.6 million connections. Compared with results for the year-earlier • AT&T U-verseSM TV subscriber growth quarter, AT&T’s adjusted operating expenses continued its strong ramp, with a first- for the first quarter of 2008 totaled quarter net gain of 148,000 to reach $23.2 billion, versus $22.4 billion; adjusted 379,000 in service. The company is on operating income was $7.6 billion, up from track to reach its target of more than $7.0 billion; and AT&T’s adjusted operating 1 million AT&T U-verse TV subscribers income margin was 24.6 percent, up from by year-end 2008. 23.7 percent. AT&T’s adjusted first-quarter 2008 net REVENUE GROWTH RAMP income totaled $4.5 billion, up 10.3 percent For the quarter ended March 31, 2008, AT&T’s from $4.1 billion in the year-earlier quarter, revenues totaled $30.7 billion, up 6.1 percent and adjusted earnings per diluted share versus reported results in the year-earlier totaled $0.74, up 13.8 percent from $0.65 quarter and up 4.6 percent compared with in the first quarter of 2007. first-quarter 2007 pro forma revenues, which AT&T’s merger integration and operational exclude merger-related accounting impacts cost initiatives continue on schedule. For the on directory revenues. This marks a substan- full year 2007, operating expense savings tial step up from year-over-year pro forma from BellSouth and AT&T Corp. merger revenue growth of 2.9 percent in the fourth integration efforts and previously outlined quarter of 2007 and 1.7 percent in the first operational initiatives totaled approximately quarter of 2007. $3.9 billion. AT&T expects these expense AT&T’s first-quarter revenue growth was savings to grow in 2008 by more than driven by improved growth rates in wireless, $2 billion dollars. enterprise and wholesale, combined with stable trends in regional revenues.
  • 3. 3 InvestorBriefing | 1Q 2008 ADDITIONAL BACKGROUND ON AT&T ADJUSTED OPERATING INCOME MARGIN ADJUSTED AND PRO FORMA RESULTS 24.6% AT&T’s adjusted earnings for the first Revenue growth 24.0% 23.9% quarter of 2008 exclude (1) noncash pretax and progress on 23.7% 23.7% amortization costs related to acquisitions productivity initiatives totaling $1.2 billion, or $0.13 per diluted combined to further share, and (2) a charge of $374 million, or expand margins in $0.04 per diluted share, associated with a the first quarter. workforce reduction previously disclosed in a Form 8-K filing. Adjusted results for the first quarter of 2007 excluded: (1) pretax merger-related integration costs totaling $245 million, or 1Q07 2Q07 3Q07 4Q07 1Q08 Reported 16.1% 16.8% 17.6% 18.1% 19.5% $0.02 per diluted share; (2) noncash, pretax Merger integration and amortization costs and other one-time items merger-related costs totaling $1.8 billion, or are excluded from adjusted operating income margins. $0.18 per diluted share; (3) a merger-related directory accounting impact of $301 million, CASH FROM OPERATIONS, or $0.03 per diluted share; and (4) a gain of SHARE REPURCHASES $409 million, or $0.04 per share, from Compared with results in the year-earlier wireless transactions. quarter, AT&T’s cash from operating activi- Advertising & Publishing results for 2007 ties for the first quarter of 2008 totaled were affected by accounting adjustments $5.0 billion, up from $4.6 billion; capital following AT&T’s late 2006 acquisition of expenditures totaled $4.2 billion, versus BellSouth. In accordance with purchase $3.3 billion; and free cash flow (cash from accounting rules, deferred revenues and operations minus capital expenditures) expenses for all BellSouth directories totaled $0.7 billion, compared with delivered prior to the close of the merger $1.3 billion. were eliminated from 2007 consolidated As it invests in the future of its business, results. This elimination of amortization AT&T continues to return substantial value reduced first-quarter 2007 consolidated to shareowners through dividends and revenues by $409 million and consolidated share repurchases. In the first quarter, operating expenses by $108 million. dividends paid totaled $2.4 billion and AT&T manages its print directory business shares repurchased totaled 111.6 million using amortized results. As a result, 2007 for $4.1 billion. AT&T ended the quarter amortized results are shown in the with 5.9 billion shares outstanding. Advertising & Publishing segment on AT&T’s Statement of Segment Income. STRONG BALANCE SHEET In 2008, consolidated and segment results AT&T’s balance sheet continues to be strong. reflect amortization accounting. At the end of the first quarter, AT&T’s long- term debt was $60.2 billion, and total debt was $73.5 billion. Cash and cash equivalents at the end of the quarter totaled $2.0 billion. AT&T’s first-quarter debt-to-total-capitali- zation ratio was 39.6 percent, and the company’s annualized debt-to-EBITDA was 1.6. AT&T expects its year-end 2008 debt-to-EBITDA ratio will be in the 1.3 to 1.5 range.
  • 4. 4 InvestorBriefing | 1Q 2008 Wireless AT&T delivered strong wireless growth in the first quarter, reflecting the AT&T’s first-quarter wireless company’s broad high-quality network, innovative services, attractive handset results were highlighted selection, extensive sales reach and continued improvements in operations. Results included improved revenue growth, expanded margins and strong by strong double-digit growth in operating income. revenue growth driven ACCELERATED WIRELESS REVENUE GROWTH AT&T’s first-quarter wireless revenues totaled $11.8 billion, up 18.3 percent by solid subscriber gains versus the year-earlier quarter. This marked AT&T’s seventh consecutive quarter of improved wireless revenue growth. Wireless service revenues, which exclude and robust growth in handset and accessory sales, grew 17.1 percent to $10.6 billion. Revenue growth was driven by strong subscriber gains and continued wireless data services. improvement in ARPU (average monthly revenues per subscriber). AT&T has now posted seven consecutive quarters of year-over-year growth in wireless service ARPU, which was $50.18 in the first quarter, up 2.0 percent versus the year-earlier quarter. Retail postpaid subscriber ARPU growth was even stronger, up approximately 5 percent. IMPROVED SUBSCRIBER GAINS AT&T’s first-quarter net gain in wireless subscribers totaled 1.3 million, up 104,000, or 8.7 percent, versus the year-earlier quarter. AT&T ended the quarter with 71.4 million subscribers in service. Total net adds in the first quarter were reduced by approximately 330,000 due to the shutdown of AT&T’s TDMA wireless network in late February. Retail postpaid net adds totaled 705,000 in the first quarter of 2008, up 3.7 percent versus net adds in the year-earlier first quarter. AT&T continued its strong record of wireless subscriber flow share with 5.0 million first-quarter gross subscriber additions, up from 4.3 million in the year-earlier quarter. Total average monthly subscriber churn, which includes postpaid, prepaid and reseller subscribers, was 1.7 percent, flat with the year-earlier quarter and with the fourth quarter of 2007. Retail postpaid churn was 1.2 percent, down from 1.3 percent in the year-earlier quarter and flat with the fourth quarter of 2007. ROBUST GROWTH IN WIRELESS DATA SERVICES AT&T‘s wireless data revenues grew 57.3 percent versus results in the year- earlier quarter to $2.3 billion, reflecting robust increases in Internet access, e-mail, messaging, data access and media bundles. Data now represents 21.5 percent of AT&T’s total wireless service revenues, up from 16.0 percent in the first quarter of 2007 and 10.9 percent in the first quarter of 2006.
  • 5. 5 InvestorBriefing | 1Q 2008 the company expects to deliver 3G services AT&T WIRELESS REVENUES to nearly 350 leading U.S. markets by the Year-Over-Year Growth AT&T posted its end of 2008, including all of the nation’s 18.3% 100 largest cities. seventh consecutive 16.3% quarter of accelerated 14.4% OPERATING INCOME GROWTH, 12.7% wireless revenue MARGIN EXPANSION 11.2% growth, reflecting Strong growth in wireless revenues, network solid subscriber gains efficiencies and operational improvements and robust adoption have driven substantial improvement in AT&T’s of data services. wireless operating income and margins. On a reported basis, AT&T’s first-quarter wireless operating expenses totaled 1Q07 2Q07 3Q07 4Q07 1Q08 $8.9 billion, and operating income was $3.0 billion, up 94.1 percent from During the first quarter, AT&T’s wireless $1.5 billion in the first quarter of 2007. customers sent more than 620 million On an adjusted basis, wireless operating multimedia messages and 44 billion text expenses totaled $8.3 billion, and operating messages, both volumes more than double income was $3.5 billion, up 38.5 percent totals in the year-earlier quarter. from $2.5 billion in the first quarter of 2007. AT&T expects continued robust growth AT&T’s reported wireless operating in wireless data services as more customers income margin was 25.0 percent, up from adopt integrated devices that deliver 15.2 percent in the year-earlier quarter, access to a broad array of applications and its adjusted wireless operating and content. At the end of the first quarter, income margin was 29.8 percent, up from 16 percent of AT&T’s postpaid wireless 25.5 percent in the year-earlier quarter. subscribers had an integrated device, up AT&T’s first-quarter wireless OIBDA service from 6 percent one year earlier. margin was 41.7 percent, the highest ever Data growth is also spurred by adoption achieved by the company’s wireless segment, of 3G-compatible devices. At the end of up from an unadjusted 37.5 percent and an the first quarter, 11 million AT&T customers adjusted 38.9 percent in the year-earlier had 3G devices. AT&T’s 3G network now quarter. (OIBDA service margin is operating includes 272 U.S. metropolitan areas, and income before depreciation and amortization, divided by total service revenues.) AT&T WIRELESS SUBSCRIBERS In millions LEADER IN WIRELESS NETWORKS, AT&T increased its 71.4 70.1 SERVICE INNOVATION wireless subscriber AT&T operates the United States’ largest base by more than 65.7 wireless digital voice and data network, and 9 million over 63.7 through roaming alliances around the world, 62.2 the past year. provides the largest global presence among U.S. wireless carriers. AT&T is moving quickly to create the next generation of wireless. In addition to its broad 3G network deployment, by the middle of this year, the company expects 1Q07 2Q07 3Q07 4Q07 1Q08 to complete its upgrade of the nation’s Subscriber increase in 4Q07 included 1.7 million subscribers added through Dobson acquisition. first High Speed Uplink Packet Access
  • 6. 6 InvestorBriefing | 1Q 2008 completed successful bids for prime B Block AT&T WIRELESS DATA REVENUES spectrum in the Federal Communications Dollars in billions AT&T’s wireless data Commission’s Auction 73. $2.3 The complementary nature of the spectrum revenues grew $2.0 AT&T acquired through the FCC auction and 57.3 percent year $1.8 $1.7 from Aloha Partners gives AT&T the capacity over year and now $1.5 to meet customer needs as the company represent 21.5 percent moves to higher-speed 4G (fourth-generation) of total wireless services. Upon final award of the auctioned service revenues. B Block spectrum, AT&T’s 700 MHz spectrum will cover 100 percent of the top 200 markets and 87 percent of the U.S. population. AT&T also sets the pace for innovation in 1Q07 2Q07 3Q07 4Q07 1Q08 wireless with a host of cutting-edge devices, content and services. In recent weeks, AT&T: (HSUPA)-enabled network in current 3G • Added to its HSUPA device lineup with the markets. The network allows AT&T’s launch of two new LaptopConnect cards HSUPA-enabled laptop users to send from Option, the GT Ultra and GT Ultra large files faster and take full advantage Express. The new cards deliver enhanced of the latest interactive Internet and mobile broadband performance across two business applications. popular notebook computer formats, PC AT&T also took major steps in the first Card and ExpressCard. Both the GT Ultra quarter to add valuable wireless spectrum. and GT Ultra Express are compatible with In February, AT&T completed its acquisition Microsoft Windows Vista, Windows XP, of spectrum licenses covering 196 million Windows 2000 and Apple® Mac® OS X people in 281 license areas from a subsidiary (version 10.4.10 or later) notebooks. of Aloha Partners, L.P. In March, AT&T • Joined with MediaFLO USA Inc. to intro- duce AT&T Mobile TV with FLO, a mobile AT&T ADJUSTED WIRELESS MARGINS television service featuring high-quality Operating Income Margin OIBDA Service Margin live programming. The mobile TV service AT&T’s wireless 41.7% will launch in May 2008 on two new OIBDA service margin exclusive handsets, the LG Vu™ and the expanded 280 Samsung Access™. AT&T Mobile TV will 38.9% basis points versus 29.8% deliver full-length television content and adjusted results 25.5% sporting events from top networks, for the first quarter including programming from leading of 2007. entertainment brands CBS Mobile, Comedy Central, ESPN Mobile TV, FOX Mobile, MTV, NBC 2GO, NBC News2Go and Nickelodeon. • Unveiled plans for a redesigned MEdia Mall, the company’s one-stop shopping 1Q08 1Q07 1Q08 1Q07 Unadjusted 41.7% 15.2% 25.0% 37.5% Results destination for mobile content. Since Merger integration and intangible amortization costs excluded launching on AT&T mobile handsets in from adjusted operating income margins: $1,022 million in 1Q07 December 2004, millions of customers and $568 million in 1Q08. Merger integration costs excluded from adjusted OIBDA service margins: $124 million in 1Q07. have visited MEdia Mall to obtain
  • 7. 7 InvestorBriefing | 1Q 2008 ringtones, games, videos and other access to YELLOWPAGES.COM, real-time applications, generating more than traffic updates and route information $1 billion in sales and helping to spawn and is the only mobile phone-based a wave of innovation among an ever- GPS service that provides integrated growing mobile developer community. speech recognition for address entry Like its predecessor, MEdia Mall 2.0 will and points of interest search, is currently feature more than 90,000 choices from available on BlackBerry® devices. more than 115 content providers. • Announced BusinessTalk, a new wireless • Successfully launched a new unlimited offer that brings the benefits of AT&T voice plan targeted to wireless users who FamilyTalk plans to small businesses, want the predictability of flat-rate pricing enabling them to share monthly Anytime for unlimited minutes. The plan is available Minutes for up to 40 employees. to new and existing wireless subscribers BusinessTalk plans are designed to for $99.99 a month for unlimited U.S. help small businesses better manage calling with no domestic roaming or long their monthly costs by reducing overage distance charges. charges and simplifying billing. AT&T • Introduced AT&T Navigator, a next- offers a wide range of wireless phones, generation navigation service available smart devices, LaptopConnect solutions on GPS-capable PDAs and handsets. and other services for small businesses, AT&T Navigator is designed to provide including mobile e-mail, GPS navigation clear and precise audible and visual and Push To Talk technology. turn-by-turn driving directions, including full-color moving maps, using GPS directly from a customer’s wireless phone. AT&T Navigator, which offers mobile
  • 8. 8 InvestorBriefing | 1Q 2008 Wireline First-quarter revenues in AT&T’s wireline segment totaled $17.6 billion versus First-quarter results in $18.0 billion in the year-earlier quarter. This reflects a return to revenue growth AT&T’s wired operations in the company’s enterprise business, substantial improvement in wholesale revenue trends and stable revenue trends in regional business and consumer were highlighted by operations. Excluding revenues from national mass markets, the small remainder of the improved enterprise growth, former AT&T’s stand-alone long distance and local bundled business, wireline revenues increased slightly versus the year-earlier quarter and sequentially. a double-digit increase AT&T expects further stabilization in overall wireline revenue trends during the remainder of 2008 as enterprise continues to grow, wholesale trends in broadband revenues show further improvement and AT&T U-verse services gain additional scale. Compared with results for the year-earlier first quarter, on a reported basis, and a further ramp in AT&T wireline operating expenses totaled $14.8 billion, versus $15.1 billion; operating income was $2.8 billion, versus $2.9 billion; and AT&T’s wireline operating U-verse TV subscribers. income margin was 16.1 percent, which was unchanged versus the first quarter of 2007. Adjusted wireline results for the first quarter of 2007 exclude merger-related integration and amortization expenses. Adjusted wireline results for the first quarter of 2008 exclude only merger-related amortization expenses. Compared with results for the year-earlier first quarter, adjusted wireline operating expenses totaled $14.4 billion, unchanged from $14.4 billion; adjusted operating income was $3.3 billion, versus $3.6 billion; and AT&T’s adjusted wireline operating income margin was 18.5 percent, versus 20.1 percent. Moving through 2008, AT&T expects wireline expenses and margins to benefit from ongoing cost initiatives and improved IP economics. The following wireline highlights include ongoing shifts in customer categories to reflect AT&T’s management of customer relationships. FURTHER STEP UP IN ENTERPRISE GROWTH AT&T delivered further improvement in enterprise revenue growth in the first quarter, led by a 22.9 percent increase in enterprise IP data revenues, including areas such as VPNs, managed Internet services and hosting. Total enterprise revenues continued their ramp and were up 1.2 percent versus results for the first quarter of 2007. This compares with year-over-year pro forma declines of 2.0 percent in the fourth quarter of 2007 and 3.9 percent in the first quarter of 2007.
  • 9. 9 InvestorBriefing | 1Q 2008 Also in the first quarter, AT&T announced AT&T TOTAL ENTERPRISE REVENUE GROWTH RATES it is joining forces with SAP America Inc. in 2 a three-year marketing agreement under AT&T’s enterprise 1.2% which AT&T will serve as a primary SAP® 1 revenue growth hosting partner, providing independent continues to be driven 0 hosting services for large business customers (0.2)% by solid demand, headquartered in North America. -1 a premier global Recent major enterprise contract wins (1.7)% network and a -2 include a five-year agreement with Royal (2.0)% broad portfolio of Dutch Shell, which calls for AT&T to provide, -3 advanced services. manage and maintain Shell’s worldwide (3.9)% -4 communications infrastructure while also managing the company’s global mobility 1Q07 2Q07 3Q07 4Q07 1Q08 Enterprise service revenue growth (3.0)% (0.7)% 0.4% 1.5% 2.1% needs. This is one of the largest commercial 2007 comparisons are to 2006 pro forma results, which combine contracts ever signed by AT&T and the results from the former BellSouth and AT&T and exclude revenues largest agreement signed with a company from acquired operations. headquartered in Europe. This agreement Enterprise service revenues, which exclude with Shell follows a series of other large CPE sales and acquisition impacts, grew wins in the past year, including deals 2.1 percent, following a 1.5 percent increase with Starbucks, General Motors, the in the preceding quarter and a decline of U.S. Department of the Treasury and IBM. 3.0 percent in the first quarter of 2007. REGIONAL BUSINESS GROWTH With solid demand and sales momentum, AT&T expects to deliver positive growth in AT&T’s regional business revenues increased total enterprise revenues throughout 2008. 2.6 percent in the first quarter to $3.2 billion, AT&T is the premier provider for enterprise with continued growth in both voice and customers, delivering networking services data services. Regional business service and solutions to multinational corporations, revenues, which exclude CPE sales, grew U.S. governmental agencies and regionally 3.4 percent. based domestic companies. AT&T continues Regional business data revenues, which to take the initiative to expand and enhance make up 30.5 percent of the category, grew its enterprise capabilities. 6.3 percent, led by strong growth in Ethernet For example, in March AT&T announced services and by 15.2 percent growth in that it plans to invest $1 billion in 2008 to IP data services, including gains in broad- extend its global network reach and capacity, band, managed Internet and VPN services. globalize its portfolio of business services Regional business revenues from small and embed the latest utility computing and and midsize firms increased approximately other technologies in the network so that 5 percent. AT&T’s broad portfolio of companies can deliver real-time applications communications services for small and to their customers, suppliers and partners. midsize businesses includes wireless, Major projects include new subsea fiber broadband Internet access, business optic cable capacity to Japan and Asia, new e-mail services, Web hosting, unified core MPLS (MultiProtocol Label Switching) messaging, remote data storage and routers in Europe, Asia and the United States, network security options. and new network-to-network connections to extend network reach into high-growth markets in Asia Pacific, Eastern Europe and South America.
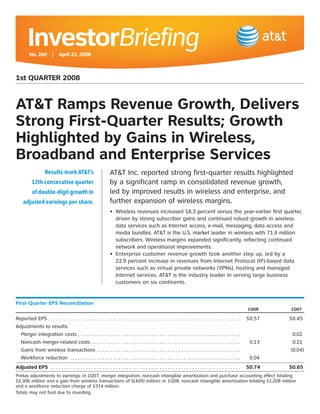
  • 10. 10 InvestorBriefing | 1Q 2008 In April, AT&T announced the availability AT&T U-VERSE TV CONNECTIONS IN SERVICE of new turnkey Web hosting solutions and In thousands Web site design services developed specifi- 379 AT&T ramped growth cally for small and midsize businesses. in its advanced Using these services, companies can easily IP-based TV service, and cost-effectively launch a new or improve with a net gain of an existing Web site, sell products or 231 148,000 subscribers services online, build an online community, in the first quarter. manage company e-mail, distribute digital content, host a gaming server or run many 126 other business applications. The new offerings are targeted to organizations 51 that need more than shared server space 13 and applications but do not require the 1Q07 2Q07 3Q07 4Q07 1Q08 complex multiserver environment of enterprise hosting. These offerings expanded in the first quarter with the launch of AT&T Business STABLE REGIONAL CONSUMER in a BoxSM, a service that harnesses the REVENUES, ACCELERATED power of IP communications to simplify VIDEO RAMP IT operations for smaller and midsize First-quarter regional consumer results businesses and branch offices of large continued trends of recent quarters, with businesses. The service features a single improved growth in broadband and Advanced device equipped with all necessary data TV services offsetting traditional voice access ports and connectors and delivers VoIP line pressures, resulting in stable revenues. functionality through AT&T Voice DNASM, Regional consumer revenues totaled Internet access routing with built-in firewall $5.5 billion, down 0.4 percent versus results protection, VPN capabilities, Wi-Fi data for the year-earlier quarter. access capabilities and local area network Regional consumer revenue connections connectivity with Power Over Ethernet (retail voice, high speed Internet and connections. video) totaled 49.3 million at the end of the first quarter of 2008. This compares with 49.3 million at the end of the first AT&T BROADBAND CONNECTIONS In millions quarter 2007 and 49.4 million at the end 14.6 AT&T added 491,000 of the fourth quarter of 2007. Gains in broadband connections 14.2 broadband and video connections totaled in the first quarter 2.6 million over the past year, and 13.8 and 1.8 million over consumer IP data revenues, which include the past year. revenues from broadband and AT&T 13.3 U-verse services, increased 18.5 percent 12.9 versus results for the year-earlier quarter. Reflecting growth in broadband and video, average monthly revenues per consumer primary line have increased steadily over the past several quarters, reaching $60.16 in the 1Q07 2Q07 3Q07 4Q07 1Q08 first quarter, up 5.4 percent year over year.
  • 11. 11 InvestorBriefing | 1Q 2008 from any PC; an online voice mailbox so that AT&T AVERAGE MONTHLY REVENUES PER customers can listen to, manage and forward CONSUMER PRIMARY LINE voice mail from the online portal; and the AT&T’S regional $60.16 ability to check call history or click-to-call consumer ARPU has $59.14 from their U-verse TV screen. $58.62 ramped steadily over $58.15 the past several $57.08 BROADBAND GROWTH quarters, reflecting AT&T continues to deliver solid double-digit growth in broadband growth in broadband. AT&T’s broadband and TV service. revenues totaled $1.4 billion in the first quarter, up 13.2 percent versus the year- earlier quarter. In the first quarter, total high speed Internet connections, which include DSL, 1Q07 2Q07 3Q07 4Q07 1Q08 U-verse enabled AT&T High Speed Internet and satellite broadband services, increased Consumer broadband revenues continue by 491,000, and AT&T ended the first to grow at a solid double-digit pace, and quarter with 14.6 million consumer and consumer broadband net adds improved business high speed Internet connections, from recent quarters, reflecting the success up 1.8 million, or 13.9 percent, over the of new wireless/broadband bundles and the past year. rapid expansion of AT&T U-verse services. This growth reflects the quality and broad Growth in AT&T U-verse TV service, the availability of AT&T’s broadband services, the company’s next-generation IP-based video ramp in AT&T U-verse service, which has a service, continued its strong ramp during high broadband attach rate, and innovations the first quarter, achieving a net subscriber such as the launch last year of a stand-alone gain of 148,000 to reach 379,000 in service. high speed Internet service, also available AT&T expects a further ramp in the quarters as part of a new wireless and broadband ahead and is on track to reach its target of service bundle. more than 1 million subscribers by the end To boost bandwidth choices, AT&T of 2008. announced plans to offer AT&T High Speed Total video connections, which include Internet Max in February 2008. The new tier, AT&T U-verse service and bundled satellite available exclusively to AT&T U-verse television service, increased by 264,000 customers across the country, will deliver in the quarter to reach 2.6 million. more bandwidth with speeds up to 10 Mbps AT&T also broke new ground in the first downstream and up to 1.5 Mbps upstream. quarter by expanding its launch of AT&T To add convenience and portability for U-verse Voice services in Sacramento, broadband users, in January, AT&T and Kansas City, Austin, San Diego and Starbucks announced plans to deliver Connecticut. The service offers a host of AT&T Wi-FiSM service at more than 7,000 features that integrate AT&T wired and company-operated Starbucks locations wireless services including: combined AT&T across the United States. Starbucks and U-verse Voice and wireless voice mail with AT&T will offer a mix of free and paid Wi-Fi U-verse Messaging, which provides a single offerings at Starbucks stores. The initiative voice mailbox that can be accessed from any will further expand the AT&T Wi-Fi network, phone line or PC; U-verse Central, an online already the largest in the United States, to management portal that gives users the more than 17,000 U.S. hot spots and more option to manage their call preferences, than 71,000 globally. voice mail, contacts, call history and more
  • 12. 12 InvestorBriefing | 1Q 2008 To capitalize on tremendous demand for WHOLESALE additional data capacity and IP-related AT&T is a leading global provider of whole- services, in February, AT&T announced that sale services, delivering a full portfolio of it is expanding capacity to deliver key network, voice, data and IP solutions to services such as long-haul private line carriers, wireless operators, cable providers, and Managed Internet Services in most of systems integrators, Internet service the 26 carrier-neutral hotels in which it providers and content providers. has a presence nationwide. Carrier-neutral In the first quarter, AT&T delivered a hotels are facilities at which multiple significant improvement in wholesale carriers interconnect and make their revenue trends, with total wholesale telecommunications services available revenues of $3.4 billion, representing a to their customers. decline of 3.9 percent versus results for the In April, AT&T announced the availability year-earlier quarter. This marks a step up of new Voice over Internet Protocol from declines in the 7 percent to 8 percent services for wholesale customers. These range over the past several quarters, as include a Gigabit Ethernet connectivity comparisons have reflected concessions interface for AT&T Voice Over IP Connect associated with AT&T’s acquisition of Service and the AT&T BusinessDirect® BellSouth Corp. and industry shifts as major portal for AT&T Global Hubbing IP consolidated carriers move traffic Access customers. to their own networks. Volume demand from wireless carriers, NATIONAL MASS MARKETS Internet service providers and content Mass market revenues totaled $730 million providers continues to accelerate, and in the first quarter, representing a decline AT&T expects that wholesale revenues will of 33.2 percent year over year. Results are continue to stabilize in 2008, as merger as expected and reflect the 2004 decision conditions pass their one-year anniversary to discontinue proactive marketing in this and carrier traffic migration nears space and AT&T’s strategy of migrating completion. customers within its regional footprint to its In addition, AT&T and IBM have announced regional platforms to deliver better service an agreement that calls for AT&T to become and a broader array of service options. the primary global network management National mass markets, which represented services provider to IBM, which will use 4.1 percent of total wireline revenues in AT&T’s global telecommunications and the first quarter, accounted for more than network management services internally 100 percent of AT&T’s year-over-year and provide these services to customers. decline in total wireline revenues. As a result, AT&T expects to receive up to $5 billion of additional revenues over the five-year term of the agreement, largely in the wholesale customer category. These revenues are expected to ramp in mid-2008.
  • 13. 13 InvestorBriefing | 1Q 2008 WIRELINE VOICE SERVICES PRODUCT CATEGORIES AT&T’s first-quarter wireline voice revenues, which include retail local voice and long WIRELINE DATA SERVICES distance as well as wholesale voice, totaled AT&T’s data revenues, which include results $9.9 billion, representing a decline of from several customer categories, grew 7.1 percent versus results for the first quarter 5.9 percent versus results for the year-earlier of 2007. This comparison is consistent with first quarter to $6.2 billion. results in recent quarters, reflecting the Data growth was led by an 18.2 percent industrywide migration of voice usage increase in revenues from IP-based services, from wired to wireless platforms, customer with continued gains in high speed Internet, transitions to broadband and VoIP services managed Internet, VPN and hosting services. and increased local voice competition. Data transport service revenues increased 0.7 percent, and packet switched data revenues, which include Frame Relay and ATM services, were down 10.7 percent, consistent with industry trends. In the first quarter, 73.0 percent of AT&T’s data revenues came from retail business and consumer customers. These retail data revenues were up 7.9 percent versus results for the year-earlier quarter.
  • 14. 14 InvestorBriefing | 1Q 2008 Advertising & Publishing AT&T’s Advertising & Publishing segment offers businesses a full suite of local AT&T is a leader in local search options including print and Internet Yellow Pages in addition to Web site search with more than design and search engine marketing. AT&T’s Advertising & Publishing operations deliver print directories to 1,250 print directories and more than 83 million residences and businesses in 22 states and have a premier online presence nationwide with YELLOWPAGES.COM, which offers YELLOWPAGES.COM, consumers access to local business information, the latest business listings, city guides, maps and driving directions. Combined, these print and online its fast-growing online products receive approximately 5 billion consumer searches a year for local business information and provide more than 1 million advertisers with search service. valuable sales leads to help their businesses grow. Advertising & Publishing revenue trends over the past several quarters have been generally stable, with print declines reflecting expected migration to electronic search, largely offset by rapid growth in YELLOWPAGES.COM. In the first quarter of 2008, Advertising & Publishing’s Internet revenues increased 41.1 percent versus the year-earlier quarter and 12.9 percent sequentially. In March, AT&T announced a distribution agreement with Microsoft Corp. that will put YELLOWPAGES.COM’s comprehensive advertising listings and content in front of consumers who use Microsoft’s local search sites. The agreement, launched in early April, gives YELLOWPAGES.COM advertisers exposure through Microsoft’s search pages within the Live Search and Live Search Maps properties, including MSN Yellow Pages. Compared with reported results in the year-earlier quarter, Advertising & Publishing revenues totaled $1.4 billion, unchanged from a reported $1.4 billion; operating expenses totaled $999 million, up from $976 million; and operating income totaled $418 million, compared with $467 million. Adjusted results for Advertising & Publishing exclude merger-related noncash amortization costs in both quarters. Compared with results in the year-earlier quarter, first-quarter 2008 adjusted operating expenses totaled $797 million, up from $744 million, and operating income totaled $620 million, compared with $699 million.
  • 15. 15 InvestorBriefing | 1Q 2008 Other AT&T’s Other segment includes results from AT&T’s Sterling Commerce AT&T’s Other segment operations and AT&T’s customer information services operations, both of includes results from its which are included in segment revenues and operating expenses. Customer information services include operator services and directory assistance. Sterling Commerce unit, Sterling Commerce is one of the world’s largest providers of multienterprise collaboration solutions. The company serves the retail, consumer packaged customer information goods, manufacturing, financial services, health care and telecommunications industries. services and equity The Other segment includes AT&T’s proportionate share of results from Telmex and América Móvil, which are shown in the Equity in Net Income of investments in Telmex Affiliates line for this segment. AT&T’s equity interest in each company is more than 8 percent. and América Móvil. América Móvil is one of the leading providers of telecommunications services in Latin America, with more than 153 million wireless subscribers in countries throughout the region, including 50 million in Mexico, at the end of 2007. Telmex is the leading telecommunications company in Mexico. Telmex and its subsidiaries provide a wide range of telecommunications services, data and video transmission, Internet access and integrated telecommunications solutions. Telmex also offers telecommunications services through its international subsidiaries in countries including Argentina, Brazil, Chile, Colombia, Ecuador, Peru and Uruguay. On a reported basis, Other segment income totaled $15 million in the first quarter, versus $252 million in the year-earlier quarter. Other segment results for the first quarter of 2008 include the company’s $374 million workforce reduction charge. Segment revenues totaled $544 million, unchanged from the first quarter of 2007. Equity in Net Income of Affiliates totaled $241 million, up from $172 million in the year-earlier quarter. Adjusted Other segment income, which excludes merger-related and workforce reduction costs, was $406 million, compared with $287 million in the first quarter of 2007.
  • 16. 16 InvestorBriefing | 1Q 2008 AT&T Inc. Consolidated Statements of Income (Unaudited) (Dollars in Millions, Except per Share Amounts) Three Months Ended 3/31/08 3/31/07 % Change Operating Revenues Voice $ 9,693 $10,455 -7.3% Data 5,972 5,655 5.6% Wireless service 10,605 9,070 16.9% Directory 1,398 1,022 36.8% Other 3,076 2,767 11.2% Total Operating Revenues 30,744 28,969 6.1% Operating Expenses Cost of services and sales (exclusive of depreciation and amortization shown separately below) 11,775 11,252 4.6% Selling, general and administrative 8,086 7,437 8.7% Depreciation and amortization 4,903 5,616 -12.7% Total Operating Expenses 24,764 24,305 1.9% Operating Income 5,980 4,664 28.2% Interest Expense 865 873 -0.9% Equity in Net Income of Affiliates 243 173 40.5% Other Income (Expense) – Net 33 504 -93.5% Income Before Income Taxes 5,391 4,468 20.7% Income Taxes 1,930 1,620 19.1% Net Income $ 3,461 $ 2,848 21.5% Basic Earnings Per Share $ 0.58 $ 0.46 26.1% Weighted Average Common Shares Outstanding (000,000) 5,997 6,224 -3.6% Diluted Earnings Per Share $ 0.57 $ 0.45 26.7% Weighted Average Common Shares Outstanding with Dilution (000,000) 6,033 6,266 -3.7%
  • 17. 17 InvestorBriefing | 1Q 2008 AT&T Inc. Statements of Segment Income (Unaudited) (Dollars in Millions) Three Months Ended 3/31/08 3/31/07 % Change Wireless Segment Operating Revenues Service $10,645 $ 9,092 17.1% Equipment 1,180 905 30.4% Total Segment Operating Revenues 11,825 9,997 18.3% Segment Operating Expenses Cost of services and equipment sales 4,110 3,670 12.0% Selling, general and administrative 3,279 2,913 12.6% Depreciation and amortization 1,480 1,891 -21.7% Total Segment Operating Expenses 8,869 8,474 4.7% Segment Operating Income 2,956 1,523 94.1% Equity in Net Income of Affiliates 2 7 -71.4% Minority Interest (60) (48) -25.0% Segment Income $ 2,898 $ 1,482 95.5% Wireline Segment Operating Revenues Voice $ 9,919 $10,677 -7.1% Data 6,205 5,862 5.9% Other 1,500 1,447 3.7% Total Segment Operating Revenues 17,624 17,986 -2.0% Segment Operating Expenses Cost of sales 7,616 7,558 0.8% Selling, general and administrative 4,005 4,093 -2.2% Depreciation and amortization 3,170 3,440 -7.8% Total Segment Operating Expenses 14,791 15,091 -2.0% Segment Income $ 2,833 $ 2,895 -2.1% Advertising & Publishing Segment Operating Revenues $ 1,417 $ 1,443 -1.8% Segment Operating Expenses Cost of sales 444 455 -2.4% Selling, general and administrative 343 279 22.9% Depreciation and amortization 212 242 -12.4% Total Segment Operating Expenses 999 976 2.4% Segment Income $ 418 $ 467 -10.5% Other Segment Operating Revenues $ 544 $ 544 — Segment Operating Expenses 770 464 65.9% Segment Operating Income (Loss) (226) 80 — Equity in Net Income of Affiliates 241 172 40.1% Segment Income $ 15 $ 252 -94.0%
  • 18. 18 InvestorBriefing | 1Q 2008 AT&T Inc. Consolidated Balance Sheets (Dollars in Millions, Except per Share Amounts) 3/31/08 12/31/07 Assets (Unaudited) Current Assets Cash and cash equivalents $ 1,963 $ 1,970 Accounts receivable – net of allowances for uncollectibles of $1,361 and $1,364 15,697 16,185 Prepaid expenses 1,610 1,524 Deferred income taxes 1,934 2,044 Other current assets 2,742 2,963 Total current assets 23,946 24,686 Property, Plant and Equipment – Net 96,238 95,890 Goodwill 70,815 70,713 Licenses 40,711 37,985 Customer Lists and Relationships – Net 13,692 14,505 Other Intangible Assets – Net 5,877 5,912 Investments in Equity Affiliates 2,578 2,270 Postemployment Benefit 17,645 17,291 Other Assets 6,697 6,392 Total Assets $278,199 $275,644 Liabilities and Stockholders’ Equity Current Liabilities Debt maturing within one year $ 13,301 $ 6,860 Accounts payable and accrued liabilities 18,590 21,399 Advanced billing and customer deposits 3,677 3,571 Accrued taxes 4,186 5,027 Dividends payable 2,375 2,417 Total current liabilities 42,129 39,274 Long-Term Debt 60,189 57,255 Deferred Credits and Other Noncurrent Liabilities Deferred income taxes 25,203 24,939 Postemployment benefit obligation 24,510 24,011 Unamortized investment tax credits 144 150 Other noncurrent liabilities 13,766 14,648 Total deferred credits and other noncurrent liabilities 63,623 63,748 Stockholders’ Equity Common shares issued ($1 par value) 6,495 6,495 Capital in excess of par value 91,598 91,638 Retained earnings 34,311 33,297 Treasury shares (at cost) (19,590) (15,683) Accumulated other comprehensive loss (556) (380) Total stockholders’ equity 112,258 115,367 Total Liabilities and Stockholders’ Equity $278,199 $275,644
  • 19. 19 InvestorBriefing | 1Q 2008 AT&T Inc. Consolidated Statements of Cash Flows (Unaudited) (Dollars in Millions, Increase (Decrease) in Cash and Cash Equivalents) Three Months Ended 3/31/08 3/31/07 Operating Activities Net income $ 3,461 $ 2,848 Adjustments to reconcile net income to net cash provided by operating activities: Depreciation and amortization 4,903 5,616 Undistributed earnings from investments in equity affiliates (225) (156) Provision for uncollectible accounts 480 376 Amortization of investment tax credits (6) (8) Deferred income tax expense 569 65 Net gain on sales of investments (46) — Gain on license exchange — (409) Changes in operating assets and liabilities: Accounts receivable (150) 237 Other current assets 142 (748) Accounts payable and accrued liabilities (4,654) (3,232) Stock-based compensation tax benefit (7) (47) Other – net 490 71 Total adjustments 1,496 1,765 Net Cash Provided by Operating Activities 4,957 4,613 Investing Activities Construction and capital expenditures (4,247) (3,338) Acquisitions, net of cash acquired (3,662) (198) Dispositions 47 209 Proceeds from sale of securities, net of investments 131 518 Other 32 7 Net Cash Used in Investing Activities (7,699) (2,802) Financing Activities Net change in short-term borrowings with original maturities of three months or less 5,786 (2,989) Issuance of long-term debt 3,972 5,924 Repayment of long-term debt (613) (227) Purchase of treasury shares (4,071) (3,005) Issuance of treasury shares 103 687 Dividends paid (2,422) (2,218) Stock-based compensation tax benefit 7 47 Other (27) (84) Net Cash Provided by (Used in) Financing Activities 2,735 (1,865) Net decrease in cash and cash equivalents (7) (54) Cash and cash equivalents beginning of year 1,970 2,418 Cash and Cash Equivalents End of Period $ 1,963 $ 2,364