
Recomendados
Más contenido relacionado
La actualidad más candente
La actualidad más candente (12)
Destacado
Destacado (20)
Similar a nationwide 2Q08 Sub-Prime/Alt-A Disclosure
Similar a nationwide 2Q08 Sub-Prime/Alt-A Disclosure (20)
Más de finance11
Más de finance11 (20)
Último
Último (20)
nationwide 2Q08 Sub-Prime/Alt-A Disclosure
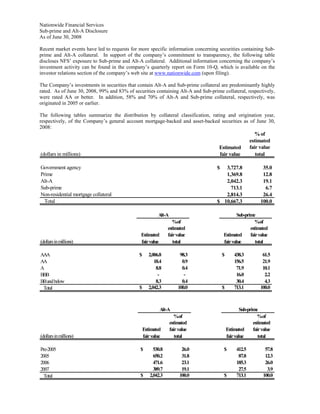
- 1. Nationwide Financial Services Sub-prime and Alt-A Disclosure As of June 30, 2008 Recent market events have led to requests for more specific information concerning securities containing Sub- prime and Alt-A collateral. In support of the company’s commitment to transparency, the following table discloses NFS’ exposure to Sub-prime and Alt-A collateral. Additional information concerning the company’s investment activity can be found in the company’s quarterly report on Form 10-Q, which is available on the investor relations section of the company’s web site at www.nationwide.com (upon filing). The Company’s investments in securities that contain Alt-A and Sub-prime collateral are predominantly highly rated. As of June 30, 2008, 99% and 83% of securities containing Alt-A and Sub-prime collateral, respectively, were rated AA or better. In addition, 58% and 70% of Alt-A and Sub-prime collateral, respectively, was originated in 2005 or earlier. The following tables summarize the distribution by collateral classification, rating and origination year, respectively, of the Company’s general account mortgage-backed and asset-backed securities as of June 30, 2008: % of estimated fair value Estimated (dollars in millions) fair value total Government agency $ 3,727.8 35.0 Prime 1,369.8 12.8 Alt-A 2,042.3 19.1 Sub-prime 713.1 6.7 Non-residential mortgage collateral 2,814.3 26.4 Total $ 10,667.3 100.0 Alt-A Sub-prime %of %of estimated estimated Estimated fair value Estimated fair value (dollars in millions) fair value total fair value total $ 2,006.8 98.3 $ 438.3 61.5 AAA 18.4 0.9 156.5 21.9 AA 8.8 0.4 71.9 10.1 A - - 16.0 2.2 BBB 8.3 0.4 30.4 4.3 BB and below $ 2,042.3 100.0 $ 713.1 100.0 Total Alt-A Sub-prime %of %of estimated estimated Estimated fair value Estimated fair value (dollars in millions) fair value total fair value total $ 530.8 26.0 $ 412.5 57.8 Pre-2005 650.2 31.8 87.8 12.3 2005 471.6 23.1 185.3 26.0 2006 389.7 19.1 27.5 3.9 2007 $ 2,042.3 100.0 $ 713.1 100.0 Total