
Recomendados
Recomendados
Más contenido relacionado
Destacado
Destacado (20)
Más de finance13
Más de finance13 (20)
Último
Último (20)
ual Fleet Facts / Financial Highlights / Operating Statistics
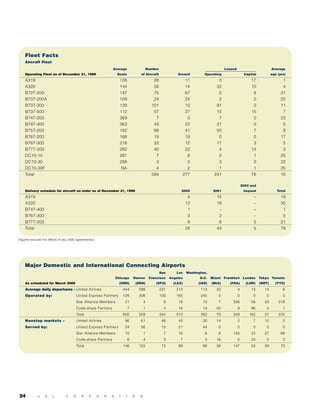
- 1. Fleet Facts Aircraft Fleet Average Number Leased Average Operating Fleet as of December 31, 1999 Seats of Aircraft Owned Operating Capital age (yrs) A319 126 28 11 0 17 1 A320 144 56 14 32 10 4 B727-200 147 75 67 0 8 21 B737-200A 109 24 24 0 0 20 B737-300 129 101 10 91 0 11 B737-500 112 57 27 15 15 7 B747-200 369 7 0 7 0 23 B747-400 363 43 22 21 0 5 B757-200 182 98 41 50 7 8 B767-200 168 19 19 0 0 17 B767-300 218 32 12 17 3 5 B777-200 292 40 22 4 14 3 DC10-10 287 7 6 0 1 25 DC10-30 298 3 0 3 0 22 DC10-30F NA 4 2 1 1 20 Total 594 277 241 76 10 2002 and Delivery schedule for aircraft on order as of December 31, 1999 2000 2001 beyond Total A319 4 15 – 19 A320 12 18 – 30 B747-400 1 – – 1 B767-300 3 2 – 5 B777-200 8 8 5 21 Total 28 43 5 76 Figures exclude the effects of any 2000 agreement(s). Major Domestic and International Connecting Airports San Los Washington, Chicago Denver Francisco Angeles D.C. Miami Frankfurt London Tokyo Toronto As scheduled for March 2000 (ORD) (DEN) (SFO) (LAX) (IAD) (MIA) (FRA) (LHR) (NRT) (YYZ) Average daily departures – United Airlines 444 298 231 213 113 22 4 13 14 6 Operated by: United Express Partners 128 206 100 165 245 0 0 0 0 0 Star Alliance Members 21 4 9 16 10 7 336 56 23 218 Code-share Partners 7 1 4 16 14 50 9 96 0 1 Total 600 509 344 410 382 79 349 165 37 225 Nonstop markets – United Airlines 96 61 48 45 35 14 2 7 12 2 Served by: United Express Partners 34 56 15 21 44 0 0 0 0 0 Star Alliance Members 10 1 7 16 6 8 140 23 27 66 Code-share Partners 6 4 3 7 3 16 5 23 0 2 Total 146 122 73 89 88 38 147 53 39 70 24 U A L C O R P O R A T I O N
- 2. Financial Highlights Year ended December 31 In millions, except per share 1999 1998 1997 Financial highlights – Operating revenues $17,561 $17,378 $18,027 generally accepted Operating expenses $16,083 $16,119 $16,636 accounting principles Earnings from operations $ 1,478 $ 1,259 $ 1,391 basis Earnings before extraordinary item $ 821 $ 958 $ 1,238 Net earnings $ 821 $ 949 $ 1,235 Per share, diluted: Earnings before B747 write-down, gains on sales $ 6.83 $ 6.64 $ 5.87 and extraordinary item B747 write-down(1) – – (0.09) Gains on sales, net(2) – 2.40 4.19 Extraordinary loss, net – (0.09) (0.03) Net earnings $ 6.83 $ 8.95 $ 9.94 Average number of common shares assumed outstanding 105.2 97.4 111.6 Operating revenues $17,561 $17,378 $18,027 Financial highlights – pro forma fully Operating expenses $15,254 $15,132 $15,880 distributed basis (3) Earnings from operations $ 2,307 $ 2,246 $ 2,147 Earnings before extraordinary item $ 1,308 $ 1,555 $ 1,668 Net earnings $ 1,308 $ 1,546 $ 1,665 Per share, diluted: Earnings before B747 write-down, gains on sales $ 10.24 $ 9.97 $ 10.06 and extraordinary item B747 write-down(1) – – (0.08) Gains on sales, net – 1.79 3.75 (2) Extraordinary loss, net – (0.07) (0.02) Net earnings $ 10.24 $ 11.69 $ 13.71 Average number of common shares assumed outstanding 126.8 131.4 120.7 (1) See page 40, Note 1g, for further details. (2) See page 41, Note 5, for further details. (3) See page 33 for further explanation of the methodology. 2.8 2.8 3.2 2.4 2.6 2.5 2.4 1.5 1.6 1.1 1995 1996 1997 1998 1999 1995 1996 1997 1998 1999 Operating Cash Flow Capital Expenditures (in billions of dollars) (in billions of dollars) 58% 53% 51% 47% 46% 41% 39% 35% 1Q 98 2Q 98 3Q 98 4Q 98 1Q 99 2Q 99 3Q 99 4Q 99 E-TicketSM Usage
- 3. Operating Statistics Year ended December 31 1999 1998 1997 Revenue passengers (millions) 87 84 87 United Airlines operating statistics Revenue passenger miles (millions) 124,609 121,426 125,465 Available seat miles (millions) 174,008 169,110 176,686 Passenger load factor – system 71.6% 71.8% 71.0% Domestic 71.8% 71.2% 70.1% Pacific 71.5% 71.6% 72.3% Atlantic 76.3% 78.9% 76.8% Latin America 60.5% 65.3% 63.4% Breakeven passenger load factor 64.9% 66.0% 64.9% Breakeven passenger load factor excluding ESOP charges 61.0% 61.4% 61.5% Passenger revenue per passenger mile (yield) 12.36¢ 12.55¢ 12.48¢ Operating revenue per available seat mile 10.07¢ 10.25¢ 10.17¢ Operating expenses per available seat mile 9.24¢ 9.53¢ 9.41¢ Operating expenses excluding ESOP charges per available seat mile 8.76¢ 8.94¢ 8.98¢ Revenue ton miles (millions) 15,424 15,004 15,604 Cargo ton miles (millions) 2,963 2,862 3,065 Available ton miles (millions) 26,390 24,940 27,130 Average price per gallon of jet fuel 59.0¢ 69.5¢ 57.9¢ Gallons of jet fuel consumed (millions) 3,029 2,964 3,065 Number of aircraft in operating fleet at end of year 577 575 594 Average age of aircraft in years at end of year 9.8 10.8 9.9 8.98 8.94 8.91 8.76 10.25 8.55 10.17 10.07 10.02 9.39 1995 1996 1997 1998 1999 1995 1996 1997 1998 1999 Operating Revenue Performance Operating Expense Excluding ESOP Charges Per Available Seat Mile: Unit Revenue Per Available Seat Mile: Unit Cost (in cents) (in cents) Latin America 5.1% Atlantic 12.5% Pacific 17.4% Domestic 65.0% Capacity by Region (available seat miles; percent of system)