
Recomendados
Más contenido relacionado
La actualidad más candente
La actualidad más candente (19)
Destacado
Destacado (15)
Similar a unisys 3Q06_SPR
Similar a unisys 3Q06_SPR (17)
Más de finance36
Último
Último (20)
unisys 3Q06_SPR
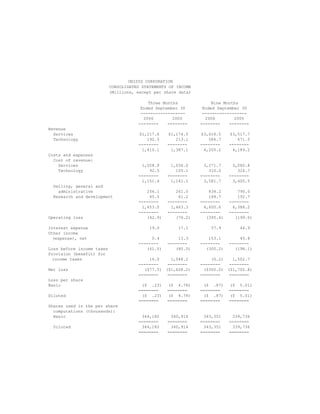
- 1. UNISYS CORPORATION CONSOLIDATED STATEMENTS OF INCOME (Millions, except per share data) Three Months Nine Months Ended September 30 Ended September 30 ------------------ ------------------ 2006 2005 2006 2005 -------- -------- -------- -------- Revenue Services $1,217.6 $1,174.0 $3,618.5 $3,517.7 Technology 192.5 213.1 586.7 671.5 -------- -------- -------- -------- 1,410.1 1,387.1 4,205.2 4,189.2 Costs and expenses Cost of revenue: Services 1,058.9 1,036.0 3,271.7 3,080.8 Technology 92.5 105.1 310.0 324.7 -------- -------- -------- -------- 1,151.4 1,141.1 3,581.7 3,405.5 Selling, general and administrative 256.1 261.0 834.2 790.0 Research and development 45.5 61.2 184.7 192.7 -------- -------- -------- -------- 1,453.0 1,463.3 4,600.6 4,388.2 -------- -------- -------- -------- Operating loss (42.9) (76.2) (395.4) (199.0) Interest expense 19.0 17.1 57.9 44.9 Other income (expense), net 0.4 13.3 153.1 45.8 -------- -------- -------- -------- Loss before income taxes (61.5) (80.0) (300.2) (198.1) Provision (benefit) for income taxes 16.0 1,548.2 (0.2) 1,502.7 -------- -------- -------- -------- Net loss ($77.5) ($1,628.2) ($300.0) ($1,700.8) ======== ======== ======== ======== Loss per share Basic ($ .23) ($ 4.78) ($ .87) ($ 5.01) ======== ======== ======== ======== Diluted ($ .23) ($ 4.78) ($ .87) ($ 5.01) ======== ======== ======== ======== Shares used in the per share computations (thousands): Basic 344,182 340,914 343,351 339,736 ======== ======== ======== ======== Diluted 344,182 340,914 343,351 339,736 ======== ======== ======== ========
- 2. UNISYS CORPORATION SEGMENT RESULTS (Millions) Elimi- Total nations Services* Technology* -------- -------- -------- ---------- Three Months Ended September 30, 2006 ------------------ Customer revenue $1,410.1 $1,217.6 $192.5 Intersegment ($76.5) 3.6 72.9 -------- -------- -------- -------- Total revenue $1,410.1 ($76.5) $1,221.2 $265.4 ======== ======== ======== ======== Gross profit percent 18.3% 13.9% 46.3% ======== ======== ======== Operating (loss) profit percent (3.0%) (1.3%) 5.5% ======== ======== ======== Three Months Ended September 30, 2005 ------------------ Customer revenue $1,387.1 $1,174.0 $213.1 Intersegment ($57.1) 4.5 52.6 -------- -------- -------- -------- Total revenue $1,387.1 ($57.1) $1,178.5 $265.7 ======== ======== ======== ======== Gross profit percent 17.7% 11.3% 42.4% ======== ======== ======== Operating loss percent (5.5%) (5.1%) (5.9%) ======== ======== ======== Nine Months Ended September 30, 2006 ------------------ Customer revenue $4,205.2 $3,618.5 $586.7 Intersegment ($172.3) 10.8 161.5 -------- -------- -------- -------- Total revenue $4,205.2 ($172.3) $3,629.3 $748.2 ======== ======== ======== ======== Gross profit percent 14.8% 14.4% 42.1% ======== ======== ======== Operating loss percent (9.4%) (1.0%) (3.6%) ======== ======== ======== Nine Months Ended September 30, 2005 ------------------ Customer revenue $4,189.2 $3,517.7 $671.5 Intersegment ($192.7) 14.2 178.5 -------- -------- -------- -------- Total revenue $4,189.2 ($192.7) $3,531.9 $850.0 ======== ======== ======== ======== Gross profit percent 18.7% 11.5% 45.0% ======== ======== ======== Operating loss percent (4.8%) (5.1%) (1.1%) ======== ======== ======== * 2006 results exclude charges for cost reductions and related actions booked in March 2006, June 2006 and September 2006
- 3. UNISYS CORPORATION CONSOLIDATED BALANCE SHEETS (Millions) September 30, December 31, 2006 2005 ---------- ---------- Assets Current assets Cash and cash equivalents $612.0 $642.5 Accounts and notes receivable, net 1,139.9 1,111.5 Inventories Parts and finished equipment 100.3 103.4 Work in process and materials 88.4 90.7 Deferred income taxes 112.2 68.2 Prepaid expense and other current assets 157.0 137.0 ---------- ---------- Total 2,209.8 2,153.3 ---------- ---------- Properties 1,346.3 1,320.8 Less accumulated depreciation and amortization 998.8 934.4 ---------- ---------- Properties, net 347.5 386.4 ---------- ---------- Outsourcing assets, net 410.6 416.0 Marketable software, net 307.7 327.6 Investments at equity 1.1 207.8 Prepaid pension cost 1,298.0 66.1 Deferred income taxes 138.4 138.4 Goodwill 191.3 192.0 Other long-term assets 137.8 141.3 ---------- ---------- Total $5,042.2 $4,028.9 ========== ========== Liabilities and stockholders' equity (deficit) Current liabilities Notes payable $0.8 $18.1 Current maturities of long-term debt 0.6 58.8 Accounts payable 377.7 444.6 Other accrued liabilities 1,469.2 1,293.3 ---------- ---------- Total 1,848.3 1,814.8 ---------- ---------- Long-term debt 1,049.2 1,049.0 Accrued pension liabilities 353.8 506.9 Other long-term liabilities 662.7 690.8 Stockholders' equity (deficit) Common stock 3.5 3.4 Accumulated deficit (2,408.1) (2,108.1) Other capital 3,937.7 3,917.0 Accumulated other comprehensive loss (404.9) (1,844.9) ---------- ---------- Stockholders' equity (deficit) 1,128.2 (32.6) ---------- ---------- Total $5,042.2 $4,028.9 ========== ==========
- 4. UNISYS CORPORATION CONSOLIDATED STATEMENTS OF CASH FLOWS (Millions) Nine Months Ended September 30 ------------------- 2006 2005 ------- ------- Cash flows from operating activities Net loss ($300.0) ($1,700.8) Add (deduct) items to reconcile net loss to net cash (used for) provided by operating activities: Equity loss (income) 4.3 (3.8) Employee stock compensation expense 4.8 .2 Depreciation and amortization of properties 88.1 89.7 Depreciation and amortization of outsourcing assets 100.5 96.0 Amortization of marketable software 98.7 91.6 Gain on sale of NUL shares and other assets (153.2) (15.8) Loss on the tender of debt 10.7 (Increase) decrease in deferred income taxes, net (44.0) 1,474.5 Decrease in receivables, net 8.0 20.7 Decrease in inventories 5.2 19.6 Increase (decrease) in accounts payable and other accrued liabilities 69.8 (245.9) (Decrease) increase in other liabilities (64.8) 199.4 Decrease (increase) in other assets 21.2 (48.8) Other 22.7 35.2 ------- ------- Net cash (used for) provided by operating activities (138.7) 22.5 ------- ------- Cash flows from investing activities Proceeds from investments 5,617.8 5,758.9 Purchases of investments (5,620.7) (5,746.2) Investment in marketable software (81.2) (93.7) Capital additions of properties (48.2) (84.9) Capital additions of outsourcing assets (68.9) (115.7) Purchases of businesses (.5) Proceeds from sale of NUL shares and other assets 380.6 23.4 ------- ------- Net cash provided by (used for) investing activities 179.4 (258.7) ------- ------- Cash flows from financing activities Net (reduction in) proceeds from short-term borrowings (17.3) 3.8 Proceeds from employee stock plans .9 12.8 Payments of long-term debt (57.9) (500.2) Proceeds from issuance of long-term debt 541.5 Financing fees (4.6) ------- ------- Net cash (used for) provided by financing activities (78.9) 57.9 ------- ------- Effect of exchange rate changes on cash and cash equivalents 7.7 (16.1) ------- ------- Decrease in cash and cash equivalents (30.5) (194.4) Cash and cash equivalents, beginning of period 642.5 660.5 ------- ------- Cash and cash equivalents, end of period $612.0 $466.1 ======= =======