SlideShare una empresa de Scribd logo
1 de 32
Descargar para leer sin conexión
discussion
             Financial

             The following discussion and analysis provides information that manage-
                                                                                                  Return on Beginning Equity                         Total Return to Shareholders
             ment believes is useful in understanding Ecolab’s operating results, cash
             flows and financial position. The discussion should be read in conjunction
                                                                                                   (Percent)                                         (Percent)
             with the consolidated financial statements and related notes.
                                                                                                    34.9%                                            31.9%
                                                                                                                                                                                                  24.3%
                                                                                                                                                                  21.0%
             Forward-Looking Statements                                                                                 27.1%
                                                                                                                                                     28.6%
                                                                                                               25.5%              24.9%      23.8%
                                                                                                                                                                            11.6%
             This financial discussion and other portions of this Annual Report to                                                                                 9.3%
                                                                                                                                                                                        (5.6)%
             Shareholders contain various “Forward-Looking Statements” within the
             meaning of the Private Securities Litigation Reform Act of 1995. These
                                                                                                                                                                            (9.1)%
             include expectations concerning business progress and expansion, business                                                                                                  (11.9)%

             acquisitions, debt repayments, susceptibility to changes in technology,                                                                                                              (23.4)%
                                                                                                    1998       1999     2000      2001       2002     1998        1999      2000        2001      2002
             global economic conditions and liquidity requirements. These statements,
             which represent Ecolab’s expectations or beliefs concerning various future            Net income divided by beginning equity.            Share appreciation plus dividends
                                                                                                                                                                 S&P 500 Total Return
             events, are based on current expectations. Therefore, they involve a number
             of risks and uncertainties that could cause actual results to differ materially
                                                                                                (i) a transitional impairment charge from the adoption of Statement of
             from those of such Forward-Looking Statements. These risks and uncertain-
                                                                                                Financial Accounting Standards (SFAS) No. 142 of $4.0 million after tax
             ties include the vitality of the hospitality, foodservice and travel industries;
                                                                                                ($0.03 per diluted share), (ii) a one-time gain from benefit plan changes of
             restraints on pricing flexibility due to competitive factors and customer and
                                                                                                $3.5 million after tax ($0.03 per diluted share), (iii) special charges related
             vendor consolidations; changes in oil or raw material prices or unavailability
                                                                                                to restructuring and the integration of European operations of $32.4 million
             of adequate and reasonably priced raw materials; the occurrence of capacity
                                                                                                after tax ($0.25 per diluted share) and (iv) a gain from discontinued opera-
             constraints or the loss of a key supplier; the effect of future acquisitions
TURN IT UP


                                                                                                tions of $1.9 million after tax ($0.01 per diluted share). Comparison of
             or divestitures or other corporate transactions; the company’s ability to
                                                                                                results with those of 2001 is also affected by the adoption of SFAS No. 142
             achieve plans for past acquisitions; the costs and effects of complying with:
                                                                                                (the elimination of goodwill amortization) and the acquisition and consolida-
             (i) laws and regulations relating to the environment and to the manufacture,
                                                                                                tion of the former European joint venture at the end of 2001. If the European
             storage, distribution, efficacy and labeling of the company’s products and (ii)
                                                                                                operations had been consolidated with Ecolab for 2001, the effect would
             changes in tax, fiscal, governmental and other regulatory policies; economic
20
                                                                                                have been an increase in diluted income per share of $0.03 for 2001. In
             factors such as the worldwide economy, interest rates and currency move-
                                                                                                addition, if SFAS No. 142 had been applied to 2001 operating results,
             ments, including, in particular, the company’s exposure to foreign currency
ECOLAB


                                                                                                including the joint venture on a consolidated basis, diluted income per
             risk; the occurrence of (a) litigation or claims, (b) the loss or insolvency of
                                                                                                common share would have increased by $0.15 for 2001. Excluding the
             a major customer or distributor, (c) war, (d) natural or manmade disasters
                                                                                                items previously mentioned from both 2002 and 2001, diluted income per
             (including material acts of terrorism or other hostilities which impact the
                                                                                                share from ongoing operations on a pro forma basis increased 13 percent
             company’s markets) and, (e) severe weather conditions affecting the food-
                                                                                                to $1.84 in 2002 from $1.63 in 2001.
             service, hospitality and travel industries; loss of, or changes in, executive
                                                                                                s Return on beginning shareholders’ equity was 24 percent for 2002
             management; the company’s ability to continue product introductions and
                                                                                                compared with 25 percent in 2001. Adjusting for the unusual items in
             technological innovations; and other uncertainties or risks reported from
                                                                                                2002, return on beginning shareholders’ equity was 27 percent. This
             time-to-time in the company’s reports to the Securities and Exchange
                                                                                                was the eleventh consecutive year the company exceeded its long-term
             Commission. In addition, the company notes that its stock price can be
                                                                                                financial objective of a 20 percent return on beginning shareholders’ equity.
             affected by fluctuations in quarterly earnings. There can be no assurances
                                                                                                s The company maintained its debt rating within the “A” categories of the
             that the company’s earnings levels will meet investors’ expectations.
                                                                                                major rating agencies during 2002.
                                                                                                s For the third consecutive year, as well as for the past ten out of twelve
             2002 Overview
                                                                                                years, the company’s stock price out performed the Standard & Poor’s 500
             In 2002, Ecolab achieved a strong financial performance, posting double-
                                                                                                index. Ecolab’s stock price increased 23 percent during 2002 compared with
             digit net income growth, strong cash flow increases, a healthy return on
                                                                                                a decrease of 23 percent in the Standard & Poor’s 500 index. Including cash
             investment and an improved balance sheet. Moreover, the company did
                                                                                                dividends, Ecolab’s total return to shareholders was 24 percent for 2002.
             this against a challenging global economic environment, utilizing aggres-
                                                                                                s Net sales for 2002 reached an all-time high of $3.4 billion and increased
             sive actions, new product and service introductions and the effective
                                                                                                47 percent over 2001. Net sales for 2002 include sales of $0.9 billion for
             implementation of its successful Circle the Customer – Circle the Globe
                                                                                                European operations, which was acquired as of year-end 2001. Net sales
             growth strategy to expand its market potential. The following discusses
                                                                                                for 2002 increased 7 percent compared with pro forma sales for 2001,
             these actions and others in more detail:
                                                                                                including the European joint venture.
             s Diluted net income per share was $1.60 for 2002, up 10 percent from

             $1.45 in 2001. Several unusual items affect the comparability in 2002 and
             2001 net income and earnings per share. For 2002, these items include
s Operating income was $396 million for 2002, an increase of 24 percent        customer incentive offerings, possibly resulting in a reduction of gross
from $318 million in 2001. This includes operating income of $84 million       profit margins at the time the incentive is offered.
for European operations. Operating income represented 11.6 percent of net           Management estimates sales returns and allowances by analyzing his-
sales, down from last year’s 13.7 percent. Excluding unusual items (special    torical returns and credits, and applies these trend rates to the most recent
charges in 2002 and elimination of goodwill amortization and consolidation     12 months’ sales data to calculate estimated reserves for future credits.
of the European joint venture in 2001), pro forma operating income for         Management estimates the allowance for doubtful accounts by analyzing
2002 increased 9 percent over 2001. Pro forma operating income was             accounts receivable balances by age, applying historical trend rates to the
13.0 percent of net sales in 2002 compared with 12.7 percent in 2001.          most recent 12 months’ sales, less actual write-offs to date. In addition,
s The company increased its annual cash dividend rate for the eleventh         management’s estimates also include separately providing for 100 percent
consecutive year. The cash dividend was increased 7 percent in December        of specific customer balances when it is deemed probable that the balance
2002 to an annual rate of $0.58 per common share.                              is uncollectible. Actual results could differ from these estimates under dif-
s During 2002, the company completed the plans announced in early              ferent assumptions.
2002 to undertake restructuring and cost saving actions and activities              Management’s current estimated ranges of liabilities related to pending
to integrate the newly acquired European operations. The company’s 2002        litigation and environmental claims are based on management’s best esti-
results also include the impact of acquisitions completed during the year,     mate of probable future costs. The company has recorded the amounts
including Audits International, Kleencare Hygiene and Terminix, Ltd., in       that represent the points in the ranges that management believes are most
order to continue to broaden its product and service offerings in line with    probable or the minimum amounts when no amount within the range is a
its Circle the Customer – Circle the Globe strategy.                           better estimate than any other amount. Potential insurance reimbursements
                                                                               are not anticipated in the company’s accruals for environmental liabilities.
Critical Accounting Policies and Estimates                                     While the final resolution of litigation and environmental contingencies
Management’s discussion and analysis of its financial condition and results     could result in amounts different than current accruals, and therefore


                                                                                                                                                               TURN IT UP
of operations are based upon the company’s consolidated financial state-        have an impact on the company’s consolidated financial results in a future
ments, which have been prepared in accordance with accounting principles       reporting period, management believes the ultimate outcome will not have
generally accepted in the United States of America. The preparation of these   a significant effect on the company’s consolidated results of operations,
financial statements requires management to make certain estimates and          financial position or cash flows.
assumptions that affect the reported amounts of assets and liabilities as           Pension and other postretirement benefit obligations are actuarially
                                                                                                                                                               21
of the date of the financial statements and the reported revenues and           determined. These calculations include assumptions related to the discount
expenses during the reporting period. Management bases these estimates         rate, projected salary and health care increases and the expected return


                                                                                                                                                               ECOLAB
on historical experience and various other evidence and assumptions that       on assets. The company is self-insured in North America for most workers
are believed to be reasonable under the circumstances, the results of which    compensation, general liability and automotive liability losses subject to
form the basis for making judgments about the recorded values of certain       per occurrence and aggregate annual liability limitations. The company is
assets and liabilities. Actual results could differ from these estimates.      insured for losses in excess of these limitations. The company is also self-
    Management believes the company’s critical accounting policies and         insured for health care claims for eligible participating employees subject
areas that require more significant judgments and estimates used in the         to certain deductibles and limitations. The company determines its liabili-
preparation of its consolidated financial statements to be:                     ties for claims incurred but not reported on an actuarial basis. A change in
s revenue recognition, including the effects of customer based programs        these assumptions could cause actual results to differ from those reported.
and incentives;                                                                     Management judgment is required in determining the provision for
s estimating valuation allowances and accrued liabilities, specifically sales   income taxes, deferred tax assets and liabilities and any valuation allowance
returns and allowances, the allowance for doubtful accounts and litigation     recorded against net deferred tax assets. As part of the process of preparing
and environmental accruals;                                                    the company’s consolidated financial statements, management is required
s the determination of actuarially determined liabilities related to pension   to estimate income taxes in each of the jurisdictions in which the company
plans, other postretirement benefit obligations and self-insurance reserves;    operates. This process involves estimating actual current tax exposure
s accounting for income taxes;                                                 together with assessing temporary differences resulting from differing treat-
s valuation and useful lives of long-lived and intangible assets; and          ment of items for tax and book accounting purposes. These differences
s determining functional currencies for the purpose of consolidating our       result in deferred tax assets and liabilities, which are included within the
International operations.                                                      company’s consolidated balance sheet. Management must then assess
    The company recognizes revenue on product sales at the time title          the likelihood that deferred tax assets will be recovered from future taxable
transfers to the customer. The company records estimated reductions to         income and to the extent management believes that recovery is not likely,
revenue for customer programs and incentive offerings including pricing        a valuation allowance must be established. To the extent that a valuation
arrangements, promotions and other volume-based incentives. If market          allowance is established or increased, an expense within the tax provision
conditions were to decline, the company may take actions to increase           is included in the statement of operations.
Financial discussion

                 Management periodically reviews its long-lived and intangible assets for       Financial results for 2002 include several unusual items, most notably
             impairment and assesses whether significant events or changes in business           (i) a transitional impairment charge from the adoption of SFAS No. 142,
             circumstances indicate that the carrying value of the assets may not be            (ii) a one-time gain from benefit plan changes, (iii) special charges related
             recoverable. An impairment loss is recognized when the carrying amount of          to restructuring and the integration of European operations and (iv) a gain
             an asset exceeds the anticipated future undiscounted cash flows expected            from discontinued operations. Comparison of results with those of 2001 is
             to result from the use of the asset and its eventual disposition. The amount       also affected by the adoption of SFAS No. 142 (the elimination of goodwill
             of the impairment loss to be recorded, if any, is calculated by the excess of      amortization) and the acquisition and consolidation of the former European
             the asset’s carrying value over its estimated fair value. Management also          joint venture at the end of 2001. The company has published certain histor-
             periodically reassesses the estimated remaining useful lives of its long-lived     ical unaudited pro forma financial information for 2001 to assist investors
             assets. Changes to estimated useful lives would impact the amount of               in understanding the pro forma effects of the adoption of SFAS No. 142,
             depreciation and amortization expense recorded in earnings.                        and the acquisition of the former European joint venture, as well as the
                 In 2002, SFAS No. 142, “Goodwill and Other Intangible Assets” became           effects of certain reclassifying adjustments.
             effective and as a result, the company ceased to amortize goodwill in                   In connection with adopting Emerging Issues Task Force (EITF) 01-09,
             2002. The company estimates the impact of discontinuing the amortization           Accounting for Consideration Given by a Vendor to a Customer, the company
             of goodwill to have increased net income by approximately $28.8 million,           reclassified certain customer incentive costs from selling, general and
             or $0.22 per diluted share for the year ended December 31, 2002. The               administrative expenses to a component of revenue at the beginning of
             company was required to perform an initial impairment review of its good-          2002. Prior year results have been reclassified for consistency purposes,
             will in 2002 under the guidelines of SFAS 142. The result of testing good-         the impact of which decreased previously reported revenue by approximately
             will for impairment was a non-cash charge of $4.0 million ($0.03 per               $34 million for each of the years ended December 31, 2001 and 2000. Also,
             share). All of the impairment charge relates to the Africa/Export reporting        at the beginning of 2002, the company reclassified repair part costs from
             unit due to the difficult economic environment in that region. Management           selling, general and administrative expenses to cost of sales. Prior year
             has continued to review its goodwill for impairment on a reporting unit            costs have been reclassified to increase cost of sales by $31 million for
             basis under the guidelines of SFAS No. 142 on an annual basis.                     2001 and $30 million for 2000. These reclassifications had no impact on
                 In preparing the consolidated financial statements, the company is              previously reported net income or shareholders’ equity. The following man-
TURN IT UP


             required to translate the financial statements of its foreign subsidiaries from     agement discussion reflects these reclassifications.
             the currency in which they keep their accounting records, generally the local           The non-GAAP financial measures included in the following tables are
             currency, into United States dollars. Assets and liabilities of these operations   not presented pursuant to Article 11 (pro forma financial information) of
             are translated at the exchange rates in effect at each fiscal year end. The         Regulation S-X and should be read in conjunction with the reported results
             translation adjustments related to assets and liabilities that arise from the      determined in accordance with accounting principles generally accepted
22
             use of differing exchange rates from period to period are included in accu-        in the United States of America. They are provided to assist in the reader’s
             mulated other comprehensive loss in shareholders’ equity. Income statement         understanding of the impact of unusual items on the comparability of the
ECOLAB


             accounts are translated at the average rates of exchange prevailing during         company’s operations for the years ended December 31, 2002 and 2001.
             the year. The different exchange rates from period to period impact the            The tables below reconcile as reported amounts (U.S. GAAP amounts) to pro
             amount of reported income from the company’s International operations.             forma amounts as adjusted for special charges related to the restructuring
                                                                                                and integration of European operations, a one-time gain from benefit plan
             Operating Results                                                                  changes, a transitional impairment charge from the adoption of SFAS No. 142
                                                                                                and a gain from discontinued operations.
             Consolidated
                                                                                                  Supplemental 2002 Pro Forma Consolidated
               (thousands, except per share)             2002          2001           2000        Operating Results Information
               Net sales                           $3,403,585    $2,320,710     $2,230,661                                                                                             Excluding
                                                                                                  Year Ended December 31, 2002                                        Unusual           Unusual
               Operating income                    $ 395,866     $ 318,179      $ 343,139
                                                                                                  (thousands, except per share)                      Total              Items*             Items
               Income
                                                                                                  Operating income                            $ 395,866           $ 46,008         $ 441,874
                  Continuing operations
                                                                                                  Interest expense, net                           (43,895)                             (43,895)
                     before change in accounting   $ 211,890     $ 188,170      $ 208,555
                                                                                                  Income before income taxes                      351,971             46,008           397,979
                  Change in accounting                 (4,002)                      (2,428)
                                                                                                  Provision for income taxes                   (140,081)           (17,121)         (157,202)
                  Discontinued operations               1,882
                                                                                                  Change in accounting                             (4,002)             4,002
                  Net income                       $ 209,770     $ 188,170      $ 206,127
                                                                                                  Discontinued operations                           1,882             (1,882)
               Diluted income per common share
                                                                                                  Net income                                  $ 209,770           $ 31,007         $ 240,777
                  Continuing operations
                     before change in accounting   $     1.62    $     1.45     $     1.58        Diluted net income per
                                                                                                      common share                            $      1.60         $     0.24       $      1.84
                  Change in accounting                  (0.03)                       (0.02)
                  Discontinued operations                0.01                                    * Unusual items include special charges related to restructuring activities and the integration
                                                                                                   of European operations of $51.8 million, a one-time gain from benefit plan changes of $5.8
                  Net income                       $     1.60    $     1.45     $     1.56
                                                                                                   million, a change in accounting for the transitional impairment charge from the adoption of
                                                                                                   SFAS No. 142 of $4.0 million and a gain from discontinued operations of $1.9 million.
global workforce during 2002, the closing of several facilities, the discontin-
  Supplemental Diluted Earnings Per Share Information
                                                                                  uance of selected product lines and other actions. The expected cost savings
                                                         2002
  (Diluted earnings per share)                                          2001
                                                                                  related to restructuring activities began in 2002 and are expected to have
  Pro forma income from ongoing operations              $ 1.84        $ 1.63
                                                                                  their full impact beginning in 2003. Restructuring savings were approx-
  Pro forma adjustments:
                                                                                  imately $16 million ($10 million after tax, or $0.08 per diluted share) in 2002.
     Acquisition of European joint venture                             (0.03)
                                                                                  Beginning in 2003, the company expects annual pretax savings of $25 mil-
     Adoption of SFAS No. 142 – to eliminate
                                                                                  lion to $30 million ($15 million to $18 million after tax). The company expects
        goodwill amortization                                          (0.15)
                                                                                  to reinvest some of these savings in the business. Further details related to
     Special charges                                     (0.25)
                                                                                  these restructuring expenses are included in Note 3 of the notes to consoli-
     One-time gain from benefit plan changes              0.03
                                                                                  dated financial statements.
     Adoption of SFAS No. 142 – transitional
        impairment charge                                (0.03)                        Operating income for 2002 was $396 million and increased by 24 per-
     Discontinued operations                             0.01                     cent over operating income of $318 million in 2001. As a percentage of net
  Net income, as reported                               $ 1.60        $ 1.45      sales, operating income was 11.6 percent compared with 2001 operating
                                                                                  income of 13.7 percent on an as reported basis. Excluding special charges,
    Consolidated net sales reached $3.4 billion for 2002, an increase of          operating income for 2002 was $442 million, or 13.0 percent of net sales.
47 percent over net sales of $2.3 billion in 2001. Business acquisitions,         This compared to 2001 pro forma operating income (reflecting the consolida-
primarily the acquisition of the European joint venture, contributed to the       tion of the European joint venture and elimination of goodwill amortization)
overall sales growth for 2002. Excluding acquisitions, primarily the European     of $404 million, or 12.7 percent of net sales. This comparison of operating
joint venture, consolidated net sales increased 4 percent in 2002. Sales          income margins reflects tight cost controls, savings from cost reduction
growth was experienced in most of the company’s divisions. Changes in             initiatives, and the sale of new products.
currency translation negatively impacted the consolidated sales growth                 In addition to continuing operations, a legal issue related to the disposal
rate by approximately 1 percentage point for 2002. Sales results reflected         of a business in 1992 was resolved during 2002, resulting in the recogni-
aggressive selling efforts, the benefits of investments in sales force training    tion of a gain from discontinued operations of approximately $1.9 million
and productivity tools, and new products, which were partially offset by the      (net of income tax benefit of $1.1 million) or $0.01 per diluted share.


                                                                                                                                                                     TURN IT UP
poor economic environment.                                                             The company’s net income for 2002 was $210 million. Net income
    The company’s consolidated gross profit margin was 50.4 percent of net         included restructuring charges of $32.4 million after tax, a curtailment gain
sales for 2002, which decreased from a gross profit margin of 51.7 percent         of $3.5 million after tax, a gain from discontinued operations of $1.9 million
in 2001. Cost of sales included restructuring costs of $9.0 million for the       after tax and a SFAS No. 142 transitional impairment charge of $4.0 million
year ended December 31, 2002. Excluding these restructuring charges, the          after tax. Excluding these items, after-tax income for 2002 was $241 mil-
                                                                                                                                                                     23
gross profit margin was 50.7 percent for 2002. The gross profit margin was          lion, an increase of 28 percent over net income of $188 million in 2001.
also negatively affected by the acquisition and consolidation of the European     This improvement reflected good operating income growth in most of the


                                                                                                                                                                     ECOLAB
joint venture. The gross profit margin for 2001 on a pro forma basis (reflect-      divisions, the additional operating income generated by the acquisition of
ing the European joint venture on a consolidated basis) was 50.2 percent.         the European joint venture and the elimination of goodwill amortization. This
Ecolab’s gross profit margin benefited from product mix improvements and            was partially offset by higher net interest expense due to increased borrow-
cost reduction actions.                                                           ings primarily to finance the company’s acquisition of the European joint ven-
    Selling, general and administrative expenses for 2002 were 37.7 per-          ture. Currency translation benefited diluted net income by $0.02 per share for
cent of net sales, a decrease from total selling, general and administrative      2002. As a percentage of net sales, after-tax income for 2002 was 6.2 per-
expenses of 38.0 percent of net sales in 2001. The selling, general and           cent. Excluding the unusual items previously mentioned, after-tax income
administrative expense margin on a pro forma basis (reflecting the consoli-        for 2002 was 7.1 percent of net sales, down from 8.1 percent in 2001 due
dation of the European joint venture and the elimination of goodwill amortiza-    to the addition of Europe.
tion) for 2001 was 37.5 percent. This increase in 2002 over the prior year is
                                                                                  2001 compared with 2000
partially due to stronger sales and income, which resulted in higher commis-
                                                                                  The non-GAAP financial measures included in the following table are
sions and incentive-based compensation. This increase was partially offset
                                                                                  not presented pursuant to Article 11 (pro forma financial information) of
by tight cost controls and savings related to restructuring activities in 2002.
                                                                                  Regulation S-X and should be read in conjunction with the reported results
    During the first quarter of 2002, management approved various restruc-
                                                                                  determined in accordance with accounting principles generally accepted
turing and other cost-saving actions, including costs to integrate the
                                                                                  in the United States of America. It is provided to assist in the reader’s under-
company’s European operations, in order to streamline and improve the
                                                                                  standing of the impact of unusual items on the comparability of the com-
company’s global operations. These actions resulted in pre-tax charges of
                                                                                  pany’s operations for the year ended December 31, 2000. The table below
$51.8 million ($32.4 million after tax, or $0.25 per diluted share) in 2002.
                                                                                  reconciles as reported amounts (U.S. GAAP amounts) to pro forma amounts
These charges were partially offset by a curtailment gain of $5.8 million
                                                                                  as adjusted for the gain on the sale of Jackson, special charges and the
($3.5 million after tax, or $0.03 per diluted share) attributable to certain
                                                                                  cumulative effect of a change in accounting for revenue recognition.
benefit plan changes. The restructuring included a reduction of the company’s
Financial discussion

                                                                                                                   The company’s net income for 2001 was $188 million, a decrease of
               Supplemental 2000 Pro Forma Consolidated
                                                                                                               9 percent compared with net income of $206 million for 2000. Excluding
               Operating Results Information
                                                                                                               the unusual items from 2000, net income for 2001 decreased 5 percent
                                                                                                   Excluding
                                                                                                               from $198 million. The decrease in net income reflected the effects of a
               Year Ended December 31, 2000                                      Unusual            Unusual
               (thousands, except per share)                     Total             Items*              Items   difficult economic environment, lower gross margins, higher net interest
               Operating income                           $ 343,139           $(18,788)        $ 324,351       expense, lower equity in the earnings of Henkel-Ecolab and the negative
               Interest expense, net                          (24,605)                             (24,605)    impact of foreign currency translation. As a percentage of net sales, after-
               Income before income taxes                     318,534          (18,788)            299,746     tax income for 2001 was 8.1 percent, down from 8.9 percent in 2000,
               Provision for income taxes                   (129,495)            8,111          (121,384)
                                                                                                               excluding the unusual items previously mentioned.
               Equity in earnings of Henkel-Ecolab             19,516                               19,516
               Change in accounting                            (2,428)           2,428
                                                                                                               Operating Segment Performance
               Net income                                 $ 206,127           $ (8,249)        $ 197,878
               Diluted net income per                                                                            (thousands)                             2002           2001          2000
               common share                               $      1.56         $ (0.06)         $      1.50
                                                                                                                 Net sales
              * Unusual items include the gain on the sale of the Jackson MSC, Inc. business of $25.9 mil-
                                                                                                                    United States
               lion, special charges of $7.1 million and the cumulative effect of a change in accounting for
                                                                                                                        Cleaning & Sanitizing      $1,615,171    $1,548,882     $1,498,381
               revenue recognition of $2.4 million.
                                                                                                                        Other Services                308,329       273,020        248,317
                 Consolidated net sales reached $2.3 billion for 2001, an increase of                                   Total United States         1,923,500      1,821,902     1,746,698
             4 percent over net sales of over $2.2 billion in 2000. Sales increased in                              International Cleaning
                                                                                                                        & Sanitizing                1,427,418       472,113        420,031
             nearly all of the company’s divisions. Business acquisitions also contributed
                                                                                                                        Total                       3,350,918      2,294,015     2,166,729
             to the overall sales growth for 2001. Businesses acquired in 2001 and the
                                                                                                                    Effect of foreign currency
             annualized effect of businesses acquired and disposed of in 2000 accounted
                                                                                                                       translation                     52,667        26,695         63,932
             for approximately 2 percentage points of the growth in consolidated sales                              Consolidated                   $3,403,585    $2,320,710     $2,230,661
             for 2001. Changes in currency translation negatively impacted the consoli-                          Operating income
TURN IT UP


             dated sales growth rate by approximately 2 percentage points for 2001.                                 United States
             Sales results reflected benefits from aggressive sales efforts, new account                                  Cleaning & Sanitizing      $ 271,838     $ 246,936      $ 249,182
             growth, new products, and additional programs to solve customer cleaning                                   Other Services                 33,051        29,338         25,515
             needs. These benefits were partially offset by a poor economic environment                                  Total United States           304,889       276,274        274,697
             and a slowdown in the travel and hospitality markets following the                                     International Cleaning
                                                                                                                        & Sanitizing                  131,376        44,181         41,399
             September 11 terrorist attacks.
24
                                                                                                                        Total                         436,265       320,455        316,096
                 The company’s consolidated gross profit margin was 51.7 percent of
                                                                                                                    Corporate                         (46,008)        (4,938)       18,491
ECOLAB


             net sales for 2001, which decreased from a gross profit margin of 52.6
                                                                                                                    Effect of foreign currency
             percent in 2000. The comparison reflected lower fuel costs and restructur-
                                                                                                                       translation                      5,609         2,662          8,552
             ing costs in 2001. These effects were offset by increased raw material
                                                                                                                    Consolidated                   $ 395,866     $ 318,179      $ 343,139
             costs, unfavorable sales mix, fixed costs growing faster than unit volume,                           Operating income as a percent
             foreign currency effects and general cost increases.                                                  of net sales
                 Selling, general and administrative expenses for 2001 were 38.0 per-                               United States
             cent of net sales, a decrease from total selling, general and administrative                               Cleaning & Sanitizing            16.8%          15.9%         16.6%
             expenses of 38.2 percent of net sales in 2000. Selling, general and admin-                                 Other Services                   10.7           10.7          10.3
             istrative expenses in 2000 included $4.4 million of income for reductions                                  Total                            15.9           15.2          15.7
                                                                                                                    International Cleaning
             in probable losses related to certain environmental matters partially offset
                                                                                                                        & Sanitizing                      9.2%           9.4%          9.9%
             by $4 million of expenses related to a large distributor. Selling, general and
             administrative expense improvements for 2001 primarily reflected the bene-                         The company’s operating segments have similar products and services and
             fits of a tighter focus on discretionary costs and synergies from acquisitions,                    the company is organized to manage its operations geographically. The
             which were partially offset by investments in the sales and service force,                        company’s operating segments have been aggregated into three reportable
             investments in acquisitions and increased retirement plan and medical costs.                      segments: United States Cleaning & Sanitizing, United States Other Services,
                 Operating income for 2001 was $318 million and decreased 7 percent                            and International Cleaning & Sanitizing. The company evaluates the perfor-
             from $343 million in 2000. This is a decrease of 2 percent from 2000 when                         mance of its International operations based on fixed management rates
             excluding the unusual items that occurred during 2000. Business acquisi-                          of currency exchange. Therefore, International sales and operating income
             tions had a minimal effect on operating income for 2001. As a percentage                          totals, as well as the International financial information included in this
             of net sales, operating income was 13.7 percent compared with 2000                                financial discussion, are based on translation into U.S. dollars at the fixed
             operating income of 14.5 percent, excluding unusual items. This decrease                          currency exchange rates used by management for 2002. All other account-
             in operating income reflects the poor economic environment and a slow-                             ing policies of the reportable segments are consistent with accounting prin-
             down in the travel and hospitality markets.                                                       ciples generally accepted in the United States of America and the accounting
policies of the company described in Note 2 of the notes to consolidated                          reflected good growth driven primarily by the non-travel portion of the
financial statements. Additional information about the company’s reportable                        business. Trends in sales to the travel related business showed improve-
segments is included in Note 16 of the notes to consolidated financial state-                      ment over the course of 2002. Sales of Kay’s U.S. operations increased
ments. The following chart presents the comparative percentage change in                          over the prior year with strong growth in both its food retail business and
net sales for each of the company’s operating segments (excluding Europe)                         sales to the quickservice market. Textile Care sales increased from the
for 2002 and 2001. European operations have been excluded since they                              prior year due to increased sales to existing customers as well as sales
were consolidated for the first time in 2002, making percentage compar-                            to new customers. Professional Products sales decreased in 2002 due to
isons not applicable.                                                                             both a decline in the core sales of the Janitorial market and a decrease in
                                                                                                  the non-core specialty business reflecting a planned restructuring of the
                                                                    Percent Change                JaniSource business. Professional Products’ sales, however, were positively
  Sales Growth Information                                          From Prior Year
                                                                                                  impacted at the end of 2002 due to a long-term supply agreement that
                                                                    2002               2001
                                                                                                  became effective in December 2002. Water Care Services sales decreased
  Net sales
                                                                                                  from the prior year due to customer cost cutting and consolidations. Water
     United States Cleaning & Sanitizing
                                                                                                  Care also continues to exit non-core markets. Vehicle Care sales growth for
            Institutional                                              6%                    3%
                                                                                                  2002 was primarily due to new business with major oil companies as well
            Kay                                                        9                     8
                                                                                                  as new product introductions. Food & Beverage sales increased slightly
            Textile Care                                               3                    (5)
                                                                                                  from the prior year with good growth in sales to the dairy, beverage and
            Professional Products                                     (4)                    7
                                                                                                  meat and poultry markets which were offset by weak Agri sales.
            Water Care Services                                       (3)                    5
            Vehicle Care                                               3                     9
            Food & Beverage                                            1                     1
                                                                                                    United States Other Services
     Total United States Cleaning & Sanitizing                         4%                    3%
     United States Other Services                                                                   Sales (Dollars in millions)      Business Mix (Percent)
            Pest Elimination                                           7%                    8%
                                                                                                                              $308
            GCS Service                                               19                    33


                                                                                                                                                                                       TURN IT UP
                                                                                                                                                              s Pest Elimination 60%
                                                                                                                  $273
                                                                                                      $248
     Total United States Other Services                               13%                   10%                                                               s GCS Service 40%
     Total United States                                               6%                    4%
     International Cleaning & Sanitizing
            Asia Pacific                                                2%                    9%
            Latin America                                             10                    13
                                                                                                                                                                                       25
            Canada                                                     5                     7
                                                                                                      2000       2001        2002              2002
            Africa/Export and Other                                    5                    32


                                                                                                                                                                                       ECOLAB
     Total International
            Cleaning & Sanitizing (excluding Europe)                   5%                   12%
                                                                                                      Sales of United States Other Services operations increased 13 percent
     Consolidated (excluding Europe)                                   5%                    4%
                                                                                                  to $308 million in 2002, from $273 million in 2001. Excluding the effects of
                                                                                                  business acquisitions, sales increased 4 percent for 2002. Pest Elimination’s
                                                                                                  sales in 2002 included strong growth in non-contract services, which was
  United States Cleaning & Sanitizing
                                                                                                  partially offset by a slowdown in the growth of contract services. GCS
  Sales (Dollars in millions)         Business Mix (Percent)                                      Service sales growth increased over the prior year, reflecting the continued
                                                                                                  expansion of its operations through acquisitions and a focus on integrating
                            $1,615
                  $1,549
   $1,498
                                                               s Institutional 60%                past acquisitions. Excluding the effects of businesses acquired, GCS sales
                                                               s Food & Beverage 17%
                                                                                                  decreased 1 percent for 2002. The results reflected the division’s focus on
                                                               s Kay 9%
                                                               s Professional Products 6%         standardizing operating procedures and the impact of the hospitality slow-
                                                               s Textile Care 3%
                                                                                                  down on the GCS business. United States Other Services also includes
                                                               s Vehicle Care 3%
                                                               s Water Care Services 2%
                                                                                                  modest sales from the addition of EcoSure operations in January 2002.
                                                                                                      Management rate-based sales of the company’s International Cleaning
                                                                                                  & Sanitizing operations reached $1.4 billion for 2002, an increase of 202
    2000          2001      2002                2002
                                                                                                  percent over sales of $0.5 billion in 2001. International Cleaning & Sanitizing
                                                                                                  includes European sales of $0.9 billion for 2002. Prior to 2002, the company
     Sales of the company’s United States Cleaning & Sanitizing operations
                                                                                                  included the results of the former European joint venture operations in its
were $1.6 billion in 2002 and increased 4 percent over net sales of $1.5
                                                                                                  financial statements using the equity method of accounting. Excluding
billion in 2001. Business acquisitions had no effect on the growth in sales
                                                                                                  Europe’s sales, International Cleaning & Sanitizing sales growth was 5 percent
for 2002. Sales benefited from good growth in sales of U.S. Institutional
                                                                                                  for 2002. Excluding all business acquisitions and divestitures, sales also
and Kay operations. U.S. Institutional operations sales growth during 2002
                                                                                                  increased 5 percent in 2002. European sales, although not consolidated prior
Financial discussion

                                                                                                             Operating income of International Cleaning & Sanitizing operations rose
               International Cleaning & Sanitizing                                                       197 percent to $131 million in 2002 from operating income of $44 million
                                                                                                         in 2001. The International operating income margin decreased from 9.4
               Sales (Dollars in millions)       Business Mix (Percent)
                                                                                                         percent in 2001 to 9.2 percent in 2002. Operating income in 2001 does not
                                                                                                         reflect the effect of SFAS No. 142 and includes $5.3 million of amortization
                                        $1,427
                                                                          s Europe 65%
                                                                                                         expense related to goodwill. Excluding acquisitions and including the pro
                                                                          s Asia Pacific 17%
                                                                          s Latin America 7%
                                                                                                         forma effects of SFAS No.142 on 2001, operating income for 2002 increased
                                                                          s Canada 6%
                                                                                                         10 percent over the prior year. Excluding acquisitions (primarily Europe) and
                                                                          s Africa/Export and Other 5%
                             $472
                 $420
                                                                                                         including the pro forma effects of SFAS No. 142 on last year, the operating
                                                                                                         income margin for International increased to 11.1 percent of net sales from
                                                                                                         10.5 percent in 2001. Significant operating income growth and margin
                 2000       2001        2002               2002
                                                                                                         improvement from Asia Pacific, Latin America and Canada contributed to
                                                                                                         the increase. The company added 510 sales-and-service associates to its
                                                                                                         International Cleaning & Sanitizing operations, including Europe, during 2002.
             to 2002, increased 8 percent over 2001 due to good growth in sales to the
                                                                                                             Operating income margins of the company’s International operations
             food and beverage markets and European acquisitions. For the Asia Pacific
                                                                                                         are less than the operating income margins realized for the company’s
             region, Japan, New Zealand and China showed good sales growth for the
                                                                                                         U.S. operations. The lower International margins are due to higher costs
             year while Australia’s sales declined due to the sale of its Hygiene Services
                                                                                                         of importing raw materials and finished goods, increased investments in
             business. Asia Pacific sales increased 3 percent in 2002, excluding business
                                                                                                         dispensing equipment and the additional costs caused by the difference
             acquisitions and divestitures. The increase in Asia Pacific sales was primar-
                                                                                                         in scale of International operations where several operating locations are
             ily from the institutional and food and beverage markets. Latin America
                                                                                                         smaller in size, as well as to the additional cost of operating in numerous
             sales increased 8 percent in 2002, excluding business acquisitions, with
                                                                                                         and diverse foreign jurisdictions. Proportionately larger investments in sales,
             good growth in all countries except Venezuela due to the economic impact
                                                                                                         technical support and administrative personnel are also necessary in order
             of the devaluation of its currency. Sales in Canada increased over the prior
                                                                                                         to facilitate growth of International operations.
             year due to good growth in sales to the institutional market. Sales of the
TURN IT UP


             Africa/Export and Other region increased in 2002 reflecting weakness in                      2001 compared with 2000
             Israel offset by good growth in South Africa and other operations.                          Sales of the company’s United States Cleaning & Sanitizing operations
                  Operating income of the company’s United States Cleaning & Sanitizing                  were $1.5 billion in 2001 and increased 3 percent over net sales in 2000.
             operations was $272 million in 2002, an increase of 10 percent from oper-                   Business acquisitions accounted for approximately 1 percentage point of
             ating income of $247 million in 2001. As a percentage of net sales, operat-                 the growth in sales for 2001. Sales reflected solid growth in the company’s
26
             ing income increased from 15.9 percent in 2001 to 16.8 percent in 2002.                     Kay, Professional Products and Vehicle Care operations. The sales improve-
             The improvement in reported operating income margins reflected tight cost
ECOLAB


                                                                                                         ment also reflected benefits from new products and services, as well as
             controls, savings from cost reduction initiatives, the sale of new products                 aggressive sales efforts and programs. Net selling price increases during
             and the impact of adopting SFAS No. 142. Operating income in 2001                           2001 were not significant. U.S. Institutional operations sales growth during
             does not reflect the effect of SFAS No. 142, and thus includes amortization                  2001 reflected modest growth in its specialty, housekeeping and Ecotemp
             expenses related to goodwill of $10.6 million. If the provisions of SFAS No.                programs, which were partially offset by the continuing slow down in the
             142 had been applied retroactively to January 1, 2001, operating income                     economy and the weaker demand in the lodging and restaurant markets
             for the United States Cleaning & Sanitizing operations would have increased                 due to the events of September 11, 2001. Excluding the acquisition of
             6 percent and the operating income margin for the U.S. Cleaning & Sanitizing                Facilitec, Institutional’s sales increased 2 percent for 2001. Sales of Kay’s
             operations would have been 16.6 percent for 2001. The company added                         U.S. operations increased over 2000 with significant growth in its food retail
             115 sales-and-service associates to its United States Cleaning & Sanitizing                 business and good growth in sales to the quickservice market. Excluding
             operations during 2002.                                                                     the acquisition of Southwest Sanitary Distributing Company (SSDC) in
                  Operating income of United States Other Services operations increased                  February 2000, Kay’s sales for 2001 increased 5 percent over 2000. Textile
             13 percent to $33 million in 2002. The operating income margin for United                   Care sales decreased in 2001 due to exiting selected businesses and a very
             States Other Services was 10.7 percent for both 2002 and 2001. Operating                    competitive market. Professional Products’ sales increased in 2001 with
             income in 2001 does not reflect the effect of SFAS No. 142 and includes                      good growth in its healthcare and janitorial sales. Professional Products’
             $1.9 million of amortization expense related to goodwill. Excluding acquisi-                sales have been positively impacted by long-term supply agreements in
             tions and the effects of SFAS No. 142, operating income increased 3 per-                    its janitorial business. Water Care Services’ sales increased over 2000 with
             cent over 2001. Excluding acquisitions and including the pro forma effects                  good growth in sales to the food and beverage and hospitality markets.
             of SFAS No. 142 on the prior year, the operating income margin for United                   Vehicle Care sales growth for 2001 was primarily due to new products
             States Other Services was 11.4 percent for both 2002 and 2001. Pest                         and additional business with major oil company chains. Food & Beverage
             Elimination had strong operating income growth due to increased produc-                     U.S. sales increased in 2001 with good growth in the beverage market.
             tivity and cost controls. Operating income for GCS declined due to continued                     Sales of the United States Other Services operations increased 10 per-
             investments in the division’s infrastructure and systems. During 2002, the                  cent to $273 million in 2001, from $248 million in 2000. Excluding the
             company added 75 sales-and-service associates to its United States Other                    effects of businesses acquired and disposed of, sales increased 7 percent
             Services operations.                                                                        for 2001. Pest Elimination’s sales in 2001 included solid growth in contract
                                                                                                         services, slightly offset by a slowdown in non-contract services due to
economic conditions. GCS Service sales growth increased over last year          Henkel-Ecolab joint venture. On November 30, 2001, Ecolab purchased
reflecting the continued expansion of its operations through acquisitions.       the remaining 50 percent interest of Henkel-Ecolab it did not previously
Excluding the effects of businesses acquired, GCS sales increased 4 percent     own from Henkel KGaA. Additional details related to this purchase are
for 2001. In the fourth quarter of 2000, the company sold its Jackson dish-     included in Note 5 of the notes to consolidated financial statements.
machine manufacturing business.                                                     Ecolab consolidated Henkel-Ecolab’s operations effective with the
     Management rate-based sales of the company’s International Cleaning &      November 30, 2001 acquisition date and end of Henkel-Ecolab’s fiscal year
Sanitizing operations reached $472 million for 2001, an increase of 12 per-     for 2001. Because the company consolidates its International operations on
cent over sales of $420 million in 2000. Business acquisitions accounted        the basis of their November 30 fiscal year ends, Henkel-Ecolab’s balance
for approximately 5 percentage points of the sales increase in 2001 for         sheet was consolidated with Ecolab’s balance sheet as of year-end 2001.
International Cleaning & Sanitizing operations. Excluding business acquisi-     The income statement for the European operations was consolidated with
tions, Asia Pacific sales increased 8 percent with double-digit sales growth     Ecolab’s operations beginning in 2002.
in New Zealand and East Asia and good growth in Japan. The increase in
                                                                                2001 compared with 2000
Asia Pacific sales was primarily from the food and beverage and institutional
                                                                                The company included the results of Henkel-Ecolab operations in its financial
markets. Latin America sales increased 7 percent in 2001, excluding busi-
                                                                                statements using the equity method of accounting through November 30,
ness acquisitions, with good growth in almost all countries. Sales in Canada
                                                                                2001. The company’s equity in earnings of Henkel-Ecolab, which included
increased in 2001 due to strong growth in sales to the institutional and food
                                                                                royalty income and goodwill amortization, was $16 million in 2001, a
and beverage markets. Sales of the Africa/Export region increased sharply
                                                                                decrease of 19 percent when compared to $20 million in 2000. When
in 2001 due to strong results in South Africa and the full-year sales effect
                                                                                measured in euros, net income of Henkel-Ecolab for 2001 decreased 13
of a business, which was acquired in September 2000.
                                                                                percent and reflected lower sales volumes driven by slowing economies
     Operating income of the company’s United States Cleaning & Sanitizing
                                                                                and increasing raw material, energy and other costs, which were partially
operations was $247 million in 2001, a decrease of 1 percent from operating
                                                                                offset by price increases.
income of $249 million in 2000. Business acquisitions had little effect on
                                                                                    Henkel-Ecolab sales, although not consolidated in Ecolab’s financial
operating income for 2001. Operating income included strong growth for
                                                                                statements, increased 4 percent in 2001 when measured in euros. Sales
Professional Products and Water Care Services with moderate growth in


                                                                                                                                                               TURN IT UP
                                                                                reflected the impact of Europe’s slowing economies and reduced orders
Kay and Vehicle Care operations. Operating income of Institutional, Food &
                                                                                from distributors as they lowered inventory levels. When measured in U.S.
Beverage and Textile Care was lower than the prior year. As a percentage of
                                                                                dollars, Henkel-Ecolab sales were flat when compared to 2000 due to the
net sales, operating income decreased from 16.6 percent in 2000 to 15.9
                                                                                negative effects of a stronger U.S. dollar.
percent in 2001. Operating income margins declined due to lower sales
volume, unfavorable sales mix, increased storage and handling costs and
                                                                                Corporate                                                                      27
increased raw material costs. The company added 50 sales-and-service
                                                                                Corporate operating expense totaled $46.0 million in 2002, compared with
associates to its United States Cleaning & Sanitizing operations during 2001.


                                                                                                                                                               ECOLAB
                                                                                corporate operating expense of $4.9 million in 2001 and corporate operat-
     Operating income of United States Other Services operations increased
                                                                                ing income of $18.5 million in 2000. Prior to 2002, corporate operating
15 percent to $29 million in 2001. Excluding operating income of businesses
                                                                                expense included overhead costs directly related to the former European
acquired in 2001 and the annualized effect of businesses acquired and
                                                                                joint venture. In 2002, these expenses were included in the International
disposed of in 2000, operating income for 2001 increased 20 percent.
                                                                                Cleaning & Sanitizing operating segment. The amount remaining in corporate
Both Pest Elimination and GCS reported double-digit increases in operating
                                                                                operating expense in 2002 included restructuring and merger integration
income. The operating income margin of United States Other Services
                                                                                costs of $51.8 million, which were partially offset by a curtailment gain of
operations was 10.7 percent, which is up from 10.3 percent of net sales
                                                                                $5.8 million related to benefit plan changes. In 2000, corporate operating
in 2000. This increase reflected GCS’ efforts to improve income by focusing
                                                                                income also included the $25.9 million gain on the sale of the Jackson
on operational efficiencies, as well as Pest Elimination’s increased produc-
                                                                                business, special charges of $7.1 million and income of $4.4 million for
tivity, more efficient use of products and cost controls. During 2001, the
                                                                                net reductions in probable losses related to certain environmental matters.
company added 120 sales-and-service associates to its United States
Other Services operations.
                                                                                Interest and Income Taxes
     Operating income of International Cleaning & Sanitizing operations
                                                                                Net interest expense of $44 million for 2002 increased 54 percent over net
rose 7 percent to $44 million in 2001 from operating income of $41 million
                                                                                interest expense of $28 million in 2001. This increase is primarily due to
in 2000. The effects of businesses acquired accounted for approximately
                                                                                higher debt levels incurred at year-end 2001 to finance the acquisition of
1 percentage point of the growth in operating income for 2001. The
                                                                                the remaining 50 percent interest of Henkel-Ecolab which Ecolab did not
International operating income margin decreased from 9.9 percent in 2000
                                                                                previously own.
to 9.4 percent in 2001. While the Latin America and Africa/Export regions
                                                                                    Net interest expense for 2001 was $28 million, an increase of 16 percent
showed operating income margin improvement, the margins for Asia Pacific
                                                                                over net interest expense of $25 million in 2000. This increase reflected
and Canada declined due to higher raw material costs. Excluding associates
                                                                                higher debt levels during the year, including the additional debt incurred
added by Henkel-Ecolab, the company added 160 sales-and-service asso-
                                                                                late in the year to purchase the remaining 50 percent of Henkel-Ecolab.
ciates to its International Cleaning & Sanitizing operations during 2001.
                                                                                    The company’s effective income tax rate was 39.8 percent for 2002,
                                                                                compared with effective income tax rates in 2001 and 2000 of 40.5 percent
Henkel-Ecolab
                                                                                and 40.7 percent, respectively. Excluding the effects of special charges in
Prior to November 30, 2001, the company operated cleaning and sanitizing
                                                                                2002, the estimated annual effective income tax rate related to ongoing
businesses in Europe through a 50 percent economic interest in the
Financial discussion

             operations was 39.5 percent. This decrease from prior years was principally                                                  long-term debt. In February
                                                                                                   Cash Provided by
             due to the adoption of SFAS No. 142 at the beginning of 2002, which elimi-                                                   2002, the company refinanced
                                                                                                   Operating Activities
             nated the amortization of goodwill and related income tax effects. Overall                                                   $266 million of commercial
                                                                                                     (Dollars in millions)
             effective rates on International operations were higher in 2002, principally                                                 paper borrowings through the
                                                                                                                                     $423
             due to the addition of the European joint venture. This was partially offset                                                 issuance of euro 300 million of
                                                                                                                                $364
             by lower state income tax rates in 2002. Excluding the effects of the sale                                                   Euronotes. As of December 31,
                                                                                                                           $315
                                                                                                                 $293
             of Jackson and restructuring expenses in 2000, the effective income tax                                                      2002 the ratio of total debt to
                                                                                                       $236

             rate was 40.5 percent in 2000.                                                                                               capitalization was 39 percent,
                                                                                                                                          down from 46 percent at year-
             Financial Position                                                                                                           end 2001 and compared with
             The company’s debt continued to be rated within the “A” categories by the                                                    33 percent at year-end 2000.
                                                                                                      1998       1999      2000 2001 2002
             major rating agencies during 2002. Significant changes in the company’s                                                       The lower debt to capitalization
             financial position during 2002 and 2001 included the following:                                                               rate in 2002 is due to repay-
             s Total assets reached nearly $2.9 billion at December 31, 2002, an                 ments made during the year while the higher debt to capitalization ratio for
             increase of 14 percent over total assets of $2.5 billion at year-end 2001.          2001 compared to 2000 was due to funding for the company’s acquisition
             Accounts receivable have increased 8 percent since year-end 2001, primarily         of the Henkel-Ecolab joint venture.
             due to the effect of business acquisitions during the year as well as due to
             the effect of exchange rates. Other assets have increased significantly              Cash Flows
             since year-end 2001 due to payments totaling approximately $125 million             Cash provided by operating activities reached a new high of $423 million
             to fund the company’s U.S. pension plan during 2002. Other current liabili-         for 2002, an increase from $364 million in 2001 and $315 million in 2000.
             ties have increased since year-end 2001 primarily due to an increase in             Operating cash flows for 2002 reflected the additional cash flows from
             restructuring accruals and due to the effect of exchange rates.                     businesses acquired, primarily the European joint venture, as well as the
                  During 2001 total assets increased to $2.5 billion at year-end 2001            improvement in accounts receivable and days sales outstanding. The
             from $1.7 billion at year-end 2000. At year-end 2001, the balance sheet of          operating cash flow for 2001 increased over 2000 due to a reduction in
TURN IT UP


             Henkel-Ecolab was consolidated with the company’s balance sheet due to              year-end accounts receivable and the additional cash flows generated
             the acquisition of the remaining 50 percent of Henkel-Ecolab from Henkel            by business acquisitions. Changes in net operating asset levels negatively
             KGaA. Total assets as of November 30, 2001 increased approximately $0.7             affected the operating cash flow by approximately $70 million in 2002,
             billion as a result of this acquisition and the consolidation of Henkel-Ecolab.     positively impacted it by $10 million in 2001 and negatively affected it by
             s Working capital levels increased to $150 million at December 31, 2002             approximately $2 million in 2000.
28
             from $102 million at year-end 2001 reflecting a significant decrease in                   Cash flows used for investing activities included capital expenditures
             short-term debt from the prior year. Working capital levels at year-end 2001        of $213 million in 2002, $158 million in 2001 and $150 million in 2000.
ECOLAB


             of $102 million were up from $69 million at year-end 2000 reflecting lower           Worldwide additions of merchandising equipment, primarily cleaning and
             levels of current liabilities prior to the Henkel-Ecolab acquisition, as well as    sanitizing product dispensers, accounted for approximately 70 percent of
             increases in accounts receivable and inventory due to the consolidation of          each year’s capital expenditures. Merchandising equipment is depreciated
             Europe’s balance sheet for the first time as of year-end 2001. During 2001,          over 3 to 7 year lives. Cash used for businesses acquired included Terminix
             short-term debt increased approximately $97 million due to the issuance             Ltd. and Kleencare Hygiene in 2002, Henkel-Ecolab in 2001 and Spartan
             of commercial paper to finance the acquisition of Henkel-Ecolab.                     and Facilitec in 2000. Investing cash flow activity also included the proceeds
             s Total debt was $700 million at December 31, 2002 and decreased from               from the sale of the Jackson business in 2000.
             total debt of $746 million at year-end 2001. This decrease in total debt                Financing cash flow activity included cash used to reacquire shares and
             during 2002 is principally due to debt repayments made during the year.             pay dividends and cash provided and used through the company’s debt
             Total debt at year-end 2000 was $371 million. During 2001, commercial               arrangements. In May 2000, the company announced a program to repur-
             paper borrowings were incurred to fund the acquisition of the remaining             chase up to $200 million of its common stock. Share repurchases totaled
             50 percent of the Henkel-Ecolab joint venture. At December 31, 2001,                $9 million in 2002, $32 million in 2001 and $187 million in 2000. These
             the company classified $266 million of commercial paper borrowings as                repurchases were funded with operating cash flows and additional debt. In
                                                                                                 December 2000, the company announced an authorization to repurchase
                                                                                                 up to 5 million additional shares of common stock.
                Total Debt to Capitalization
                                                                                                     In 2002, the company increased its annual dividend rate for the
                                                                                                 eleventh consecutive year. The company has paid dividends on its common
                (Percent)                   (Percent)
                                                                                                 stock for 66 consecutive years. Cash dividends declared per share of com-
                            46%
                                                                                                 mon stock, by quarter, for each of the last three years were as follows:
                                                                    s Shareholders’ Equity 61%
                                   39%
                                                                    s Total Debt 39%
                  33%

                                                                                                   Cash Dividends Declared
                                                                                                                      First     Second         Third      Fourth
                                                                                                                    Quarter     Quarter      Quarter     Quarter        Year

                                                                                                   2002            $0.135      $0.135       $0.135      $0.145       $0.55
                                                                                                   2001             0.13        0.13         0.13         0.135       0.525
                  2000      2001   2002                 2002                                       2000             0.12        0.12         0.12         0.13        0.49
ecolab  2002FinancialDiscuss

Más contenido relacionado

Destacado

Dcr Trendline June 2015
Dcr Trendline June 2015Dcr Trendline June 2015
Dcr Trendline June 2015ss
 
IPS Group Financial services presentation
IPS Group Financial services presentationIPS Group Financial services presentation
IPS Group Financial services presentationIPSGroupUK
 
Témoignages des membres d'ERO/RTO
Témoignages des membres d'ERO/RTOTémoignages des membres d'ERO/RTO
Témoignages des membres d'ERO/RTOSusannah Maxcy
 
Coincidence or not
Coincidence or notCoincidence or not
Coincidence or notcpugh5345
 
CEM Asia Summit: Design Thinking Workshop
CEM Asia Summit: Design Thinking WorkshopCEM Asia Summit: Design Thinking Workshop
CEM Asia Summit: Design Thinking WorkshopSAP Customer Experience
 
Eda Story So far
Eda Story So farEda Story So far
Eda Story So farkirtidesai
 
commercial bank and its functions.
commercial bank and its functions.commercial bank and its functions.
commercial bank and its functions.Abhishek Thakur
 
Hays Global Gender Diversity Report 2016
Hays Global Gender Diversity Report 2016Hays Global Gender Diversity Report 2016
Hays Global Gender Diversity Report 2016Hays
 

Destacado (14)

Cambio climático
Cambio climáticoCambio climático
Cambio climático
 
Dcr Trendline June 2015
Dcr Trendline June 2015Dcr Trendline June 2015
Dcr Trendline June 2015
 
12
1212
12
 
IPS Group Financial services presentation
IPS Group Financial services presentationIPS Group Financial services presentation
IPS Group Financial services presentation
 
Cibo deserunt
Cibo deseruntCibo deserunt
Cibo deserunt
 
Curriculum vitae
Curriculum vitaeCurriculum vitae
Curriculum vitae
 
Témoignages des membres d'ERO/RTO
Témoignages des membres d'ERO/RTOTémoignages des membres d'ERO/RTO
Témoignages des membres d'ERO/RTO
 
Coincidence or not
Coincidence or notCoincidence or not
Coincidence or not
 
CEM Asia Summit: Design Thinking Workshop
CEM Asia Summit: Design Thinking WorkshopCEM Asia Summit: Design Thinking Workshop
CEM Asia Summit: Design Thinking Workshop
 
Eda Story So far
Eda Story So farEda Story So far
Eda Story So far
 
commercial bank and its functions.
commercial bank and its functions.commercial bank and its functions.
commercial bank and its functions.
 
Hays Global Gender Diversity Report 2016
Hays Global Gender Diversity Report 2016Hays Global Gender Diversity Report 2016
Hays Global Gender Diversity Report 2016
 
Surge Pricing in Uber
Surge Pricing in UberSurge Pricing in Uber
Surge Pricing in Uber
 
Cipla Global Ltd.
Cipla Global Ltd.Cipla Global Ltd.
Cipla Global Ltd.
 

Similar a ecolab 2002FinancialDiscuss

HMS Group presentation, Morgan Stanley EMEA Conference (April 2011)
HMS Group presentation, Morgan Stanley EMEA Conference (April 2011)HMS Group presentation, Morgan Stanley EMEA Conference (April 2011)
HMS Group presentation, Morgan Stanley EMEA Conference (April 2011)HMS Group
 
3Q_2007_Financial_Review
3Q_2007_Financial_Review3Q_2007_Financial_Review
3Q_2007_Financial_Reviewfinance45
 
Supp slides q4_2012_v4_26_feb_1900h
Supp slides q4_2012_v4_26_feb_1900hSupp slides q4_2012_v4_26_feb_1900h
Supp slides q4_2012_v4_26_feb_1900hdgiplcorponline
 
2006 Nationwide Annual Report
2006 Nationwide Annual Report2006 Nationwide Annual Report
2006 Nationwide Annual Reportfinance11
 
The Relevance and Value of a “Storage Hypervisor”
The Relevance and Value of a “Storage Hypervisor”The Relevance and Value of a “Storage Hypervisor”
The Relevance and Value of a “Storage Hypervisor”IBM India Smarter Computing
 
ecolab Financial
ecolab  Financialecolab  Financial
ecolab Financialfinance37
 
RYDERFINAL1Q06EarningsReport
RYDERFINAL1Q06EarningsReportRYDERFINAL1Q06EarningsReport
RYDERFINAL1Q06EarningsReportfinance44
 
RYDERFINAL1Q06EarningsReport
RYDERFINAL1Q06EarningsReportRYDERFINAL1Q06EarningsReport
RYDERFINAL1Q06EarningsReportfinance44
 
Ryder System, Inc. 3Q 2011 Earnings
Ryder System, Inc. 3Q 2011 EarningsRyder System, Inc. 3Q 2011 Earnings
Ryder System, Inc. 3Q 2011 EarningsRyder System, Inc.
 
Earnings Conference Call Presentation (color)
 Earnings Conference Call Presentation (color) Earnings Conference Call Presentation (color)
Earnings Conference Call Presentation (color)finance1
 
Chevron Q4 2008 earnings release
Chevron Q4 2008 earnings releaseChevron Q4 2008 earnings release
Chevron Q4 2008 earnings releaseearningsreport
 
SLM CorpUBSPresentation051208Final
SLM CorpUBSPresentation051208FinalSLM CorpUBSPresentation051208Final
SLM CorpUBSPresentation051208Finalfinance42
 
csx 2007_JP_Morgan_Conference-REF23640
csx  2007_JP_Morgan_Conference-REF23640csx  2007_JP_Morgan_Conference-REF23640
csx 2007_JP_Morgan_Conference-REF23640finance27
 
csx 2007_JP_Morgan_Conference-REF23640
csx  2007_JP_Morgan_Conference-REF23640csx  2007_JP_Morgan_Conference-REF23640
csx 2007_JP_Morgan_Conference-REF23640finance27
 
2007 - Second Quarter Results 2007
2007 - Second Quarter Results 20072007 - Second Quarter Results 2007
2007 - Second Quarter Results 2007Embraer RI
 
Earnings Presentation 3Q11
Earnings Presentation  3Q11Earnings Presentation  3Q11
Earnings Presentation 3Q11CSURIWEB
 
Earnings release 1 q11 presentation
Earnings release 1 q11 presentationEarnings release 1 q11 presentation
Earnings release 1 q11 presentationEquatorialRI
 
Product plan fiat_2012_2016
Product plan fiat_2012_2016Product plan fiat_2012_2016
Product plan fiat_2012_2016Autoblog.it
 
Q1 2009 Earning Report of Canadian Pacific Railway Ltd.
Q1 2009 Earning Report of Canadian Pacific Railway Ltd. Q1 2009 Earning Report of Canadian Pacific Railway Ltd.
Q1 2009 Earning Report of Canadian Pacific Railway Ltd. earningreport earningreport
 

Similar a ecolab 2002FinancialDiscuss (20)

HMS Group presentation, Morgan Stanley EMEA Conference (April 2011)
HMS Group presentation, Morgan Stanley EMEA Conference (April 2011)HMS Group presentation, Morgan Stanley EMEA Conference (April 2011)
HMS Group presentation, Morgan Stanley EMEA Conference (April 2011)
 
Q1 2009 Earning Report of HNI Corporation
Q1 2009 Earning Report of HNI CorporationQ1 2009 Earning Report of HNI Corporation
Q1 2009 Earning Report of HNI Corporation
 
3Q_2007_Financial_Review
3Q_2007_Financial_Review3Q_2007_Financial_Review
3Q_2007_Financial_Review
 
Supp slides q4_2012_v4_26_feb_1900h
Supp slides q4_2012_v4_26_feb_1900hSupp slides q4_2012_v4_26_feb_1900h
Supp slides q4_2012_v4_26_feb_1900h
 
2006 Nationwide Annual Report
2006 Nationwide Annual Report2006 Nationwide Annual Report
2006 Nationwide Annual Report
 
The Relevance and Value of a “Storage Hypervisor”
The Relevance and Value of a “Storage Hypervisor”The Relevance and Value of a “Storage Hypervisor”
The Relevance and Value of a “Storage Hypervisor”
 
ecolab Financial
ecolab  Financialecolab  Financial
ecolab Financial
 
RYDERFINAL1Q06EarningsReport
RYDERFINAL1Q06EarningsReportRYDERFINAL1Q06EarningsReport
RYDERFINAL1Q06EarningsReport
 
RYDERFINAL1Q06EarningsReport
RYDERFINAL1Q06EarningsReportRYDERFINAL1Q06EarningsReport
RYDERFINAL1Q06EarningsReport
 
Ryder System, Inc. 3Q 2011 Earnings
Ryder System, Inc. 3Q 2011 EarningsRyder System, Inc. 3Q 2011 Earnings
Ryder System, Inc. 3Q 2011 Earnings
 
Earnings Conference Call Presentation (color)
 Earnings Conference Call Presentation (color) Earnings Conference Call Presentation (color)
Earnings Conference Call Presentation (color)
 
Chevron Q4 2008 earnings release
Chevron Q4 2008 earnings releaseChevron Q4 2008 earnings release
Chevron Q4 2008 earnings release
 
SLM CorpUBSPresentation051208Final
SLM CorpUBSPresentation051208FinalSLM CorpUBSPresentation051208Final
SLM CorpUBSPresentation051208Final
 
csx 2007_JP_Morgan_Conference-REF23640
csx  2007_JP_Morgan_Conference-REF23640csx  2007_JP_Morgan_Conference-REF23640
csx 2007_JP_Morgan_Conference-REF23640
 
csx 2007_JP_Morgan_Conference-REF23640
csx  2007_JP_Morgan_Conference-REF23640csx  2007_JP_Morgan_Conference-REF23640
csx 2007_JP_Morgan_Conference-REF23640
 
2007 - Second Quarter Results 2007
2007 - Second Quarter Results 20072007 - Second Quarter Results 2007
2007 - Second Quarter Results 2007
 
Earnings Presentation 3Q11
Earnings Presentation  3Q11Earnings Presentation  3Q11
Earnings Presentation 3Q11
 
Earnings release 1 q11 presentation
Earnings release 1 q11 presentationEarnings release 1 q11 presentation
Earnings release 1 q11 presentation
 
Product plan fiat_2012_2016
Product plan fiat_2012_2016Product plan fiat_2012_2016
Product plan fiat_2012_2016
 
Q1 2009 Earning Report of Canadian Pacific Railway Ltd.
Q1 2009 Earning Report of Canadian Pacific Railway Ltd. Q1 2009 Earning Report of Canadian Pacific Railway Ltd.
Q1 2009 Earning Report of Canadian Pacific Railway Ltd.
 

Más de finance37

western digital q105iis
western digital  q105iiswestern digital  q105iis
western digital q105iisfinance37
 
western digital q205iis
western digital  q205iiswestern digital  q205iis
western digital q205iisfinance37
 
western digital q305iis
western digital  q305iiswestern digital  q305iis
western digital q305iisfinance37
 
western digital q405iis
western digital  q405iiswestern digital  q405iis
western digital q405iisfinance37
 
western digital q106iis
western digital  q106iiswestern digital  q106iis
western digital q106iisfinance37
 
western digital q206iis
western digital  q206iiswestern digital  q206iis
western digital q206iisfinance37
 
western digital q306iis
western digital  q306iiswestern digital  q306iis
western digital q306iisfinance37
 
western digital q406iis
western digital  q406iiswestern digital  q406iis
western digital q406iisfinance37
 
western digital q107iis
western digital  q107iiswestern digital  q107iis
western digital q107iisfinance37
 
western digital q207iis
western digital  q207iiswestern digital  q207iis
western digital q207iisfinance37
 
western digital q307iis
western digital  q307iiswestern digital  q307iis
western digital q307iisfinance37
 
western digital Q407iis
western digital  Q407iiswestern digital  Q407iis
western digital Q407iisfinance37
 
western digital q108iis
western digital  q108iiswestern digital  q108iis
western digital q108iisfinance37
 
western digital q208iis
western digital  q208iiswestern digital  q208iis
western digital q208iisfinance37
 
western digital q308iis
western digital  q308iiswestern digital  q308iis
western digital q308iisfinance37
 
western digital q408iis
western digital  q408iiswestern digital  q408iis
western digital q408iisfinance37
 
western digital q109iis
western digital  q109iiswestern digital  q109iis
western digital q109iisfinance37
 
western digital q209iis
western digital  q209iiswestern digital  q209iis
western digital q209iisfinance37
 
western digital ap95
western digital  ap95western digital  ap95
western digital ap95finance37
 
western digital annual96
western digital  annual96western digital  annual96
western digital annual96finance37
 

Más de finance37 (20)

western digital q105iis
western digital  q105iiswestern digital  q105iis
western digital q105iis
 
western digital q205iis
western digital  q205iiswestern digital  q205iis
western digital q205iis
 
western digital q305iis
western digital  q305iiswestern digital  q305iis
western digital q305iis
 
western digital q405iis
western digital  q405iiswestern digital  q405iis
western digital q405iis
 
western digital q106iis
western digital  q106iiswestern digital  q106iis
western digital q106iis
 
western digital q206iis
western digital  q206iiswestern digital  q206iis
western digital q206iis
 
western digital q306iis
western digital  q306iiswestern digital  q306iis
western digital q306iis
 
western digital q406iis
western digital  q406iiswestern digital  q406iis
western digital q406iis
 
western digital q107iis
western digital  q107iiswestern digital  q107iis
western digital q107iis
 
western digital q207iis
western digital  q207iiswestern digital  q207iis
western digital q207iis
 
western digital q307iis
western digital  q307iiswestern digital  q307iis
western digital q307iis
 
western digital Q407iis
western digital  Q407iiswestern digital  Q407iis
western digital Q407iis
 
western digital q108iis
western digital  q108iiswestern digital  q108iis
western digital q108iis
 
western digital q208iis
western digital  q208iiswestern digital  q208iis
western digital q208iis
 
western digital q308iis
western digital  q308iiswestern digital  q308iis
western digital q308iis
 
western digital q408iis
western digital  q408iiswestern digital  q408iis
western digital q408iis
 
western digital q109iis
western digital  q109iiswestern digital  q109iis
western digital q109iis
 
western digital q209iis
western digital  q209iiswestern digital  q209iis
western digital q209iis
 
western digital ap95
western digital  ap95western digital  ap95
western digital ap95
 
western digital annual96
western digital  annual96western digital  annual96
western digital annual96
 

Último

The Economic History of the U.S. Lecture 23.pdf
The Economic History of the U.S. Lecture 23.pdfThe Economic History of the U.S. Lecture 23.pdf
The Economic History of the U.S. Lecture 23.pdfGale Pooley
 
Solution Manual for Principles of Corporate Finance 14th Edition by Richard B...
Solution Manual for Principles of Corporate Finance 14th Edition by Richard B...Solution Manual for Principles of Corporate Finance 14th Edition by Richard B...
Solution Manual for Principles of Corporate Finance 14th Edition by Richard B...ssifa0344
 
Solution Manual for Financial Accounting, 11th Edition by Robert Libby, Patri...
Solution Manual for Financial Accounting, 11th Edition by Robert Libby, Patri...Solution Manual for Financial Accounting, 11th Edition by Robert Libby, Patri...
Solution Manual for Financial Accounting, 11th Edition by Robert Libby, Patri...ssifa0344
 
VIP Independent Call Girls in Andheri 🌹 9920725232 ( Call Me ) Mumbai Escorts...
VIP Independent Call Girls in Andheri 🌹 9920725232 ( Call Me ) Mumbai Escorts...VIP Independent Call Girls in Andheri 🌹 9920725232 ( Call Me ) Mumbai Escorts...
VIP Independent Call Girls in Andheri 🌹 9920725232 ( Call Me ) Mumbai Escorts...dipikadinghjn ( Why You Choose Us? ) Escorts
 
TEST BANK For Corporate Finance, 13th Edition By Stephen Ross, Randolph Weste...
TEST BANK For Corporate Finance, 13th Edition By Stephen Ross, Randolph Weste...TEST BANK For Corporate Finance, 13th Edition By Stephen Ross, Randolph Weste...
TEST BANK For Corporate Finance, 13th Edition By Stephen Ross, Randolph Weste...ssifa0344
 
VIP Independent Call Girls in Mira Bhayandar 🌹 9920725232 ( Call Me ) Mumbai ...
VIP Independent Call Girls in Mira Bhayandar 🌹 9920725232 ( Call Me ) Mumbai ...VIP Independent Call Girls in Mira Bhayandar 🌹 9920725232 ( Call Me ) Mumbai ...
VIP Independent Call Girls in Mira Bhayandar 🌹 9920725232 ( Call Me ) Mumbai ...dipikadinghjn ( Why You Choose Us? ) Escorts
 
VIP Independent Call Girls in Bandra West 🌹 9920725232 ( Call Me ) Mumbai Esc...
VIP Independent Call Girls in Bandra West 🌹 9920725232 ( Call Me ) Mumbai Esc...VIP Independent Call Girls in Bandra West 🌹 9920725232 ( Call Me ) Mumbai Esc...
VIP Independent Call Girls in Bandra West 🌹 9920725232 ( Call Me ) Mumbai Esc...dipikadinghjn ( Why You Choose Us? ) Escorts
 
06_Joeri Van Speybroek_Dell_MeetupDora&Cybersecurity.pdf
06_Joeri Van Speybroek_Dell_MeetupDora&Cybersecurity.pdf06_Joeri Van Speybroek_Dell_MeetupDora&Cybersecurity.pdf
06_Joeri Van Speybroek_Dell_MeetupDora&Cybersecurity.pdfFinTech Belgium
 
The Economic History of the U.S. Lecture 17.pdf
The Economic History of the U.S. Lecture 17.pdfThe Economic History of the U.S. Lecture 17.pdf
The Economic History of the U.S. Lecture 17.pdfGale Pooley
 
Top Rated Pune Call Girls Dighi ⟟ 6297143586 ⟟ Call Me For Genuine Sex Servi...
Top Rated  Pune Call Girls Dighi ⟟ 6297143586 ⟟ Call Me For Genuine Sex Servi...Top Rated  Pune Call Girls Dighi ⟟ 6297143586 ⟟ Call Me For Genuine Sex Servi...
Top Rated Pune Call Girls Dighi ⟟ 6297143586 ⟟ Call Me For Genuine Sex Servi...Call Girls in Nagpur High Profile
 
( Jasmin ) Top VIP Escorts Service Dindigul 💧 7737669865 💧 by Dindigul Call G...
( Jasmin ) Top VIP Escorts Service Dindigul 💧 7737669865 💧 by Dindigul Call G...( Jasmin ) Top VIP Escorts Service Dindigul 💧 7737669865 💧 by Dindigul Call G...
( Jasmin ) Top VIP Escorts Service Dindigul 💧 7737669865 💧 by Dindigul Call G...dipikadinghjn ( Why You Choose Us? ) Escorts
 
20240429 Calibre April 2024 Investor Presentation.pdf
20240429 Calibre April 2024 Investor Presentation.pdf20240429 Calibre April 2024 Investor Presentation.pdf
20240429 Calibre April 2024 Investor Presentation.pdfAdnet Communications
 
Vip Call US 📞 7738631006 ✅Call Girls In Sakinaka ( Mumbai )
Vip Call US 📞 7738631006 ✅Call Girls In Sakinaka ( Mumbai )Vip Call US 📞 7738631006 ✅Call Girls In Sakinaka ( Mumbai )
Vip Call US 📞 7738631006 ✅Call Girls In Sakinaka ( Mumbai )Pooja Nehwal
 
VIP Independent Call Girls in Mumbai 🌹 9920725232 ( Call Me ) Mumbai Escorts ...
VIP Independent Call Girls in Mumbai 🌹 9920725232 ( Call Me ) Mumbai Escorts ...VIP Independent Call Girls in Mumbai 🌹 9920725232 ( Call Me ) Mumbai Escorts ...
VIP Independent Call Girls in Mumbai 🌹 9920725232 ( Call Me ) Mumbai Escorts ...dipikadinghjn ( Why You Choose Us? ) Escorts
 
Top Rated Pune Call Girls Sinhagad Road ⟟ 6297143586 ⟟ Call Me For Genuine S...
Top Rated  Pune Call Girls Sinhagad Road ⟟ 6297143586 ⟟ Call Me For Genuine S...Top Rated  Pune Call Girls Sinhagad Road ⟟ 6297143586 ⟟ Call Me For Genuine S...
Top Rated Pune Call Girls Sinhagad Road ⟟ 6297143586 ⟟ Call Me For Genuine S...Call Girls in Nagpur High Profile
 
02_Fabio Colombo_Accenture_MeetupDora&Cybersecurity.pptx
02_Fabio Colombo_Accenture_MeetupDora&Cybersecurity.pptx02_Fabio Colombo_Accenture_MeetupDora&Cybersecurity.pptx
02_Fabio Colombo_Accenture_MeetupDora&Cybersecurity.pptxFinTech Belgium
 
The Economic History of the U.S. Lecture 26.pdf
The Economic History of the U.S. Lecture 26.pdfThe Economic History of the U.S. Lecture 26.pdf
The Economic History of the U.S. Lecture 26.pdfGale Pooley
 
Gurley shaw Theory of Monetary Economics.
Gurley shaw Theory of Monetary Economics.Gurley shaw Theory of Monetary Economics.
Gurley shaw Theory of Monetary Economics.Vinodha Devi
 

Último (20)

The Economic History of the U.S. Lecture 23.pdf
The Economic History of the U.S. Lecture 23.pdfThe Economic History of the U.S. Lecture 23.pdf
The Economic History of the U.S. Lecture 23.pdf
 
Solution Manual for Principles of Corporate Finance 14th Edition by Richard B...
Solution Manual for Principles of Corporate Finance 14th Edition by Richard B...Solution Manual for Principles of Corporate Finance 14th Edition by Richard B...
Solution Manual for Principles of Corporate Finance 14th Edition by Richard B...
 
Solution Manual for Financial Accounting, 11th Edition by Robert Libby, Patri...
Solution Manual for Financial Accounting, 11th Edition by Robert Libby, Patri...Solution Manual for Financial Accounting, 11th Edition by Robert Libby, Patri...
Solution Manual for Financial Accounting, 11th Edition by Robert Libby, Patri...
 
VIP Independent Call Girls in Andheri 🌹 9920725232 ( Call Me ) Mumbai Escorts...
VIP Independent Call Girls in Andheri 🌹 9920725232 ( Call Me ) Mumbai Escorts...VIP Independent Call Girls in Andheri 🌹 9920725232 ( Call Me ) Mumbai Escorts...
VIP Independent Call Girls in Andheri 🌹 9920725232 ( Call Me ) Mumbai Escorts...
 
TEST BANK For Corporate Finance, 13th Edition By Stephen Ross, Randolph Weste...
TEST BANK For Corporate Finance, 13th Edition By Stephen Ross, Randolph Weste...TEST BANK For Corporate Finance, 13th Edition By Stephen Ross, Randolph Weste...
TEST BANK For Corporate Finance, 13th Edition By Stephen Ross, Randolph Weste...
 
VIP Independent Call Girls in Mira Bhayandar 🌹 9920725232 ( Call Me ) Mumbai ...
VIP Independent Call Girls in Mira Bhayandar 🌹 9920725232 ( Call Me ) Mumbai ...VIP Independent Call Girls in Mira Bhayandar 🌹 9920725232 ( Call Me ) Mumbai ...
VIP Independent Call Girls in Mira Bhayandar 🌹 9920725232 ( Call Me ) Mumbai ...
 
VIP Independent Call Girls in Bandra West 🌹 9920725232 ( Call Me ) Mumbai Esc...
VIP Independent Call Girls in Bandra West 🌹 9920725232 ( Call Me ) Mumbai Esc...VIP Independent Call Girls in Bandra West 🌹 9920725232 ( Call Me ) Mumbai Esc...
VIP Independent Call Girls in Bandra West 🌹 9920725232 ( Call Me ) Mumbai Esc...
 
06_Joeri Van Speybroek_Dell_MeetupDora&Cybersecurity.pdf
06_Joeri Van Speybroek_Dell_MeetupDora&Cybersecurity.pdf06_Joeri Van Speybroek_Dell_MeetupDora&Cybersecurity.pdf
06_Joeri Van Speybroek_Dell_MeetupDora&Cybersecurity.pdf
 
The Economic History of the U.S. Lecture 17.pdf
The Economic History of the U.S. Lecture 17.pdfThe Economic History of the U.S. Lecture 17.pdf
The Economic History of the U.S. Lecture 17.pdf
 
Top Rated Pune Call Girls Dighi ⟟ 6297143586 ⟟ Call Me For Genuine Sex Servi...
Top Rated  Pune Call Girls Dighi ⟟ 6297143586 ⟟ Call Me For Genuine Sex Servi...Top Rated  Pune Call Girls Dighi ⟟ 6297143586 ⟟ Call Me For Genuine Sex Servi...
Top Rated Pune Call Girls Dighi ⟟ 6297143586 ⟟ Call Me For Genuine Sex Servi...
 
( Jasmin ) Top VIP Escorts Service Dindigul 💧 7737669865 💧 by Dindigul Call G...
( Jasmin ) Top VIP Escorts Service Dindigul 💧 7737669865 💧 by Dindigul Call G...( Jasmin ) Top VIP Escorts Service Dindigul 💧 7737669865 💧 by Dindigul Call G...
( Jasmin ) Top VIP Escorts Service Dindigul 💧 7737669865 💧 by Dindigul Call G...
 
20240429 Calibre April 2024 Investor Presentation.pdf
20240429 Calibre April 2024 Investor Presentation.pdf20240429 Calibre April 2024 Investor Presentation.pdf
20240429 Calibre April 2024 Investor Presentation.pdf
 
Vip Call US 📞 7738631006 ✅Call Girls In Sakinaka ( Mumbai )
Vip Call US 📞 7738631006 ✅Call Girls In Sakinaka ( Mumbai )Vip Call US 📞 7738631006 ✅Call Girls In Sakinaka ( Mumbai )
Vip Call US 📞 7738631006 ✅Call Girls In Sakinaka ( Mumbai )
 
VIP Independent Call Girls in Mumbai 🌹 9920725232 ( Call Me ) Mumbai Escorts ...
VIP Independent Call Girls in Mumbai 🌹 9920725232 ( Call Me ) Mumbai Escorts ...VIP Independent Call Girls in Mumbai 🌹 9920725232 ( Call Me ) Mumbai Escorts ...
VIP Independent Call Girls in Mumbai 🌹 9920725232 ( Call Me ) Mumbai Escorts ...
 
Top Rated Pune Call Girls Sinhagad Road ⟟ 6297143586 ⟟ Call Me For Genuine S...
Top Rated  Pune Call Girls Sinhagad Road ⟟ 6297143586 ⟟ Call Me For Genuine S...Top Rated  Pune Call Girls Sinhagad Road ⟟ 6297143586 ⟟ Call Me For Genuine S...
Top Rated Pune Call Girls Sinhagad Road ⟟ 6297143586 ⟟ Call Me For Genuine S...
 
From Luxury Escort Service Kamathipura : 9352852248 Make on-demand Arrangemen...
From Luxury Escort Service Kamathipura : 9352852248 Make on-demand Arrangemen...From Luxury Escort Service Kamathipura : 9352852248 Make on-demand Arrangemen...
From Luxury Escort Service Kamathipura : 9352852248 Make on-demand Arrangemen...
 
02_Fabio Colombo_Accenture_MeetupDora&Cybersecurity.pptx
02_Fabio Colombo_Accenture_MeetupDora&Cybersecurity.pptx02_Fabio Colombo_Accenture_MeetupDora&Cybersecurity.pptx
02_Fabio Colombo_Accenture_MeetupDora&Cybersecurity.pptx
 
The Economic History of the U.S. Lecture 26.pdf
The Economic History of the U.S. Lecture 26.pdfThe Economic History of the U.S. Lecture 26.pdf
The Economic History of the U.S. Lecture 26.pdf
 
Call Girls in New Ashok Nagar, (delhi) call me [9953056974] escort service 24X7
Call Girls in New Ashok Nagar, (delhi) call me [9953056974] escort service 24X7Call Girls in New Ashok Nagar, (delhi) call me [9953056974] escort service 24X7
Call Girls in New Ashok Nagar, (delhi) call me [9953056974] escort service 24X7
 
Gurley shaw Theory of Monetary Economics.
Gurley shaw Theory of Monetary Economics.Gurley shaw Theory of Monetary Economics.
Gurley shaw Theory of Monetary Economics.
 

ecolab 2002FinancialDiscuss

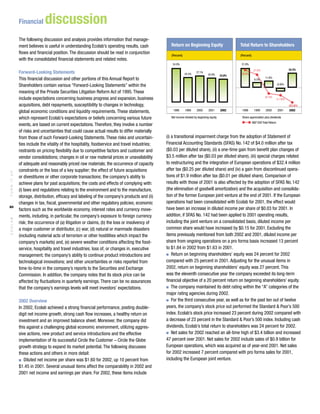
  • 1. discussion Financial The following discussion and analysis provides information that manage- Return on Beginning Equity Total Return to Shareholders ment believes is useful in understanding Ecolab’s operating results, cash flows and financial position. The discussion should be read in conjunction (Percent) (Percent) with the consolidated financial statements and related notes. 34.9% 31.9% 24.3% 21.0% Forward-Looking Statements 27.1% 28.6% 25.5% 24.9% 23.8% 11.6% This financial discussion and other portions of this Annual Report to 9.3% (5.6)% Shareholders contain various “Forward-Looking Statements” within the meaning of the Private Securities Litigation Reform Act of 1995. These (9.1)% include expectations concerning business progress and expansion, business (11.9)% acquisitions, debt repayments, susceptibility to changes in technology, (23.4)% 1998 1999 2000 2001 2002 1998 1999 2000 2001 2002 global economic conditions and liquidity requirements. These statements, which represent Ecolab’s expectations or beliefs concerning various future Net income divided by beginning equity. Share appreciation plus dividends S&P 500 Total Return events, are based on current expectations. Therefore, they involve a number of risks and uncertainties that could cause actual results to differ materially (i) a transitional impairment charge from the adoption of Statement of from those of such Forward-Looking Statements. These risks and uncertain- Financial Accounting Standards (SFAS) No. 142 of $4.0 million after tax ties include the vitality of the hospitality, foodservice and travel industries; ($0.03 per diluted share), (ii) a one-time gain from benefit plan changes of restraints on pricing flexibility due to competitive factors and customer and $3.5 million after tax ($0.03 per diluted share), (iii) special charges related vendor consolidations; changes in oil or raw material prices or unavailability to restructuring and the integration of European operations of $32.4 million of adequate and reasonably priced raw materials; the occurrence of capacity after tax ($0.25 per diluted share) and (iv) a gain from discontinued opera- constraints or the loss of a key supplier; the effect of future acquisitions TURN IT UP tions of $1.9 million after tax ($0.01 per diluted share). Comparison of or divestitures or other corporate transactions; the company’s ability to results with those of 2001 is also affected by the adoption of SFAS No. 142 achieve plans for past acquisitions; the costs and effects of complying with: (the elimination of goodwill amortization) and the acquisition and consolida- (i) laws and regulations relating to the environment and to the manufacture, tion of the former European joint venture at the end of 2001. If the European storage, distribution, efficacy and labeling of the company’s products and (ii) operations had been consolidated with Ecolab for 2001, the effect would changes in tax, fiscal, governmental and other regulatory policies; economic 20 have been an increase in diluted income per share of $0.03 for 2001. In factors such as the worldwide economy, interest rates and currency move- addition, if SFAS No. 142 had been applied to 2001 operating results, ments, including, in particular, the company’s exposure to foreign currency ECOLAB including the joint venture on a consolidated basis, diluted income per risk; the occurrence of (a) litigation or claims, (b) the loss or insolvency of common share would have increased by $0.15 for 2001. Excluding the a major customer or distributor, (c) war, (d) natural or manmade disasters items previously mentioned from both 2002 and 2001, diluted income per (including material acts of terrorism or other hostilities which impact the share from ongoing operations on a pro forma basis increased 13 percent company’s markets) and, (e) severe weather conditions affecting the food- to $1.84 in 2002 from $1.63 in 2001. service, hospitality and travel industries; loss of, or changes in, executive s Return on beginning shareholders’ equity was 24 percent for 2002 management; the company’s ability to continue product introductions and compared with 25 percent in 2001. Adjusting for the unusual items in technological innovations; and other uncertainties or risks reported from 2002, return on beginning shareholders’ equity was 27 percent. This time-to-time in the company’s reports to the Securities and Exchange was the eleventh consecutive year the company exceeded its long-term Commission. In addition, the company notes that its stock price can be financial objective of a 20 percent return on beginning shareholders’ equity. affected by fluctuations in quarterly earnings. There can be no assurances s The company maintained its debt rating within the “A” categories of the that the company’s earnings levels will meet investors’ expectations. major rating agencies during 2002. s For the third consecutive year, as well as for the past ten out of twelve 2002 Overview years, the company’s stock price out performed the Standard & Poor’s 500 In 2002, Ecolab achieved a strong financial performance, posting double- index. Ecolab’s stock price increased 23 percent during 2002 compared with digit net income growth, strong cash flow increases, a healthy return on a decrease of 23 percent in the Standard & Poor’s 500 index. Including cash investment and an improved balance sheet. Moreover, the company did dividends, Ecolab’s total return to shareholders was 24 percent for 2002. this against a challenging global economic environment, utilizing aggres- s Net sales for 2002 reached an all-time high of $3.4 billion and increased sive actions, new product and service introductions and the effective 47 percent over 2001. Net sales for 2002 include sales of $0.9 billion for implementation of its successful Circle the Customer – Circle the Globe European operations, which was acquired as of year-end 2001. Net sales growth strategy to expand its market potential. The following discusses for 2002 increased 7 percent compared with pro forma sales for 2001, these actions and others in more detail: including the European joint venture. s Diluted net income per share was $1.60 for 2002, up 10 percent from $1.45 in 2001. Several unusual items affect the comparability in 2002 and 2001 net income and earnings per share. For 2002, these items include
  • 2. s Operating income was $396 million for 2002, an increase of 24 percent customer incentive offerings, possibly resulting in a reduction of gross from $318 million in 2001. This includes operating income of $84 million profit margins at the time the incentive is offered. for European operations. Operating income represented 11.6 percent of net Management estimates sales returns and allowances by analyzing his- sales, down from last year’s 13.7 percent. Excluding unusual items (special torical returns and credits, and applies these trend rates to the most recent charges in 2002 and elimination of goodwill amortization and consolidation 12 months’ sales data to calculate estimated reserves for future credits. of the European joint venture in 2001), pro forma operating income for Management estimates the allowance for doubtful accounts by analyzing 2002 increased 9 percent over 2001. Pro forma operating income was accounts receivable balances by age, applying historical trend rates to the 13.0 percent of net sales in 2002 compared with 12.7 percent in 2001. most recent 12 months’ sales, less actual write-offs to date. In addition, s The company increased its annual cash dividend rate for the eleventh management’s estimates also include separately providing for 100 percent consecutive year. The cash dividend was increased 7 percent in December of specific customer balances when it is deemed probable that the balance 2002 to an annual rate of $0.58 per common share. is uncollectible. Actual results could differ from these estimates under dif- s During 2002, the company completed the plans announced in early ferent assumptions. 2002 to undertake restructuring and cost saving actions and activities Management’s current estimated ranges of liabilities related to pending to integrate the newly acquired European operations. The company’s 2002 litigation and environmental claims are based on management’s best esti- results also include the impact of acquisitions completed during the year, mate of probable future costs. The company has recorded the amounts including Audits International, Kleencare Hygiene and Terminix, Ltd., in that represent the points in the ranges that management believes are most order to continue to broaden its product and service offerings in line with probable or the minimum amounts when no amount within the range is a its Circle the Customer – Circle the Globe strategy. better estimate than any other amount. Potential insurance reimbursements are not anticipated in the company’s accruals for environmental liabilities. Critical Accounting Policies and Estimates While the final resolution of litigation and environmental contingencies Management’s discussion and analysis of its financial condition and results could result in amounts different than current accruals, and therefore TURN IT UP of operations are based upon the company’s consolidated financial state- have an impact on the company’s consolidated financial results in a future ments, which have been prepared in accordance with accounting principles reporting period, management believes the ultimate outcome will not have generally accepted in the United States of America. The preparation of these a significant effect on the company’s consolidated results of operations, financial statements requires management to make certain estimates and financial position or cash flows. assumptions that affect the reported amounts of assets and liabilities as Pension and other postretirement benefit obligations are actuarially 21 of the date of the financial statements and the reported revenues and determined. These calculations include assumptions related to the discount expenses during the reporting period. Management bases these estimates rate, projected salary and health care increases and the expected return ECOLAB on historical experience and various other evidence and assumptions that on assets. The company is self-insured in North America for most workers are believed to be reasonable under the circumstances, the results of which compensation, general liability and automotive liability losses subject to form the basis for making judgments about the recorded values of certain per occurrence and aggregate annual liability limitations. The company is assets and liabilities. Actual results could differ from these estimates. insured for losses in excess of these limitations. The company is also self- Management believes the company’s critical accounting policies and insured for health care claims for eligible participating employees subject areas that require more significant judgments and estimates used in the to certain deductibles and limitations. The company determines its liabili- preparation of its consolidated financial statements to be: ties for claims incurred but not reported on an actuarial basis. A change in s revenue recognition, including the effects of customer based programs these assumptions could cause actual results to differ from those reported. and incentives; Management judgment is required in determining the provision for s estimating valuation allowances and accrued liabilities, specifically sales income taxes, deferred tax assets and liabilities and any valuation allowance returns and allowances, the allowance for doubtful accounts and litigation recorded against net deferred tax assets. As part of the process of preparing and environmental accruals; the company’s consolidated financial statements, management is required s the determination of actuarially determined liabilities related to pension to estimate income taxes in each of the jurisdictions in which the company plans, other postretirement benefit obligations and self-insurance reserves; operates. This process involves estimating actual current tax exposure s accounting for income taxes; together with assessing temporary differences resulting from differing treat- s valuation and useful lives of long-lived and intangible assets; and ment of items for tax and book accounting purposes. These differences s determining functional currencies for the purpose of consolidating our result in deferred tax assets and liabilities, which are included within the International operations. company’s consolidated balance sheet. Management must then assess The company recognizes revenue on product sales at the time title the likelihood that deferred tax assets will be recovered from future taxable transfers to the customer. The company records estimated reductions to income and to the extent management believes that recovery is not likely, revenue for customer programs and incentive offerings including pricing a valuation allowance must be established. To the extent that a valuation arrangements, promotions and other volume-based incentives. If market allowance is established or increased, an expense within the tax provision conditions were to decline, the company may take actions to increase is included in the statement of operations.
  • 3. Financial discussion Management periodically reviews its long-lived and intangible assets for Financial results for 2002 include several unusual items, most notably impairment and assesses whether significant events or changes in business (i) a transitional impairment charge from the adoption of SFAS No. 142, circumstances indicate that the carrying value of the assets may not be (ii) a one-time gain from benefit plan changes, (iii) special charges related recoverable. An impairment loss is recognized when the carrying amount of to restructuring and the integration of European operations and (iv) a gain an asset exceeds the anticipated future undiscounted cash flows expected from discontinued operations. Comparison of results with those of 2001 is to result from the use of the asset and its eventual disposition. The amount also affected by the adoption of SFAS No. 142 (the elimination of goodwill of the impairment loss to be recorded, if any, is calculated by the excess of amortization) and the acquisition and consolidation of the former European the asset’s carrying value over its estimated fair value. Management also joint venture at the end of 2001. The company has published certain histor- periodically reassesses the estimated remaining useful lives of its long-lived ical unaudited pro forma financial information for 2001 to assist investors assets. Changes to estimated useful lives would impact the amount of in understanding the pro forma effects of the adoption of SFAS No. 142, depreciation and amortization expense recorded in earnings. and the acquisition of the former European joint venture, as well as the In 2002, SFAS No. 142, “Goodwill and Other Intangible Assets” became effects of certain reclassifying adjustments. effective and as a result, the company ceased to amortize goodwill in In connection with adopting Emerging Issues Task Force (EITF) 01-09, 2002. The company estimates the impact of discontinuing the amortization Accounting for Consideration Given by a Vendor to a Customer, the company of goodwill to have increased net income by approximately $28.8 million, reclassified certain customer incentive costs from selling, general and or $0.22 per diluted share for the year ended December 31, 2002. The administrative expenses to a component of revenue at the beginning of company was required to perform an initial impairment review of its good- 2002. Prior year results have been reclassified for consistency purposes, will in 2002 under the guidelines of SFAS 142. The result of testing good- the impact of which decreased previously reported revenue by approximately will for impairment was a non-cash charge of $4.0 million ($0.03 per $34 million for each of the years ended December 31, 2001 and 2000. Also, share). All of the impairment charge relates to the Africa/Export reporting at the beginning of 2002, the company reclassified repair part costs from unit due to the difficult economic environment in that region. Management selling, general and administrative expenses to cost of sales. Prior year has continued to review its goodwill for impairment on a reporting unit costs have been reclassified to increase cost of sales by $31 million for basis under the guidelines of SFAS No. 142 on an annual basis. 2001 and $30 million for 2000. These reclassifications had no impact on In preparing the consolidated financial statements, the company is previously reported net income or shareholders’ equity. The following man- TURN IT UP required to translate the financial statements of its foreign subsidiaries from agement discussion reflects these reclassifications. the currency in which they keep their accounting records, generally the local The non-GAAP financial measures included in the following tables are currency, into United States dollars. Assets and liabilities of these operations not presented pursuant to Article 11 (pro forma financial information) of are translated at the exchange rates in effect at each fiscal year end. The Regulation S-X and should be read in conjunction with the reported results translation adjustments related to assets and liabilities that arise from the determined in accordance with accounting principles generally accepted 22 use of differing exchange rates from period to period are included in accu- in the United States of America. They are provided to assist in the reader’s mulated other comprehensive loss in shareholders’ equity. Income statement understanding of the impact of unusual items on the comparability of the ECOLAB accounts are translated at the average rates of exchange prevailing during company’s operations for the years ended December 31, 2002 and 2001. the year. The different exchange rates from period to period impact the The tables below reconcile as reported amounts (U.S. GAAP amounts) to pro amount of reported income from the company’s International operations. forma amounts as adjusted for special charges related to the restructuring and integration of European operations, a one-time gain from benefit plan Operating Results changes, a transitional impairment charge from the adoption of SFAS No. 142 and a gain from discontinued operations. Consolidated Supplemental 2002 Pro Forma Consolidated (thousands, except per share) 2002 2001 2000 Operating Results Information Net sales $3,403,585 $2,320,710 $2,230,661 Excluding Year Ended December 31, 2002 Unusual Unusual Operating income $ 395,866 $ 318,179 $ 343,139 (thousands, except per share) Total Items* Items Income Operating income $ 395,866 $ 46,008 $ 441,874 Continuing operations Interest expense, net (43,895) (43,895) before change in accounting $ 211,890 $ 188,170 $ 208,555 Income before income taxes 351,971 46,008 397,979 Change in accounting (4,002) (2,428) Provision for income taxes (140,081) (17,121) (157,202) Discontinued operations 1,882 Change in accounting (4,002) 4,002 Net income $ 209,770 $ 188,170 $ 206,127 Discontinued operations 1,882 (1,882) Diluted income per common share Net income $ 209,770 $ 31,007 $ 240,777 Continuing operations before change in accounting $ 1.62 $ 1.45 $ 1.58 Diluted net income per common share $ 1.60 $ 0.24 $ 1.84 Change in accounting (0.03) (0.02) Discontinued operations 0.01 * Unusual items include special charges related to restructuring activities and the integration of European operations of $51.8 million, a one-time gain from benefit plan changes of $5.8 Net income $ 1.60 $ 1.45 $ 1.56 million, a change in accounting for the transitional impairment charge from the adoption of SFAS No. 142 of $4.0 million and a gain from discontinued operations of $1.9 million.
  • 4. global workforce during 2002, the closing of several facilities, the discontin- Supplemental Diluted Earnings Per Share Information uance of selected product lines and other actions. The expected cost savings 2002 (Diluted earnings per share) 2001 related to restructuring activities began in 2002 and are expected to have Pro forma income from ongoing operations $ 1.84 $ 1.63 their full impact beginning in 2003. Restructuring savings were approx- Pro forma adjustments: imately $16 million ($10 million after tax, or $0.08 per diluted share) in 2002. Acquisition of European joint venture (0.03) Beginning in 2003, the company expects annual pretax savings of $25 mil- Adoption of SFAS No. 142 – to eliminate lion to $30 million ($15 million to $18 million after tax). The company expects goodwill amortization (0.15) to reinvest some of these savings in the business. Further details related to Special charges (0.25) these restructuring expenses are included in Note 3 of the notes to consoli- One-time gain from benefit plan changes 0.03 dated financial statements. Adoption of SFAS No. 142 – transitional impairment charge (0.03) Operating income for 2002 was $396 million and increased by 24 per- Discontinued operations 0.01 cent over operating income of $318 million in 2001. As a percentage of net Net income, as reported $ 1.60 $ 1.45 sales, operating income was 11.6 percent compared with 2001 operating income of 13.7 percent on an as reported basis. Excluding special charges, Consolidated net sales reached $3.4 billion for 2002, an increase of operating income for 2002 was $442 million, or 13.0 percent of net sales. 47 percent over net sales of $2.3 billion in 2001. Business acquisitions, This compared to 2001 pro forma operating income (reflecting the consolida- primarily the acquisition of the European joint venture, contributed to the tion of the European joint venture and elimination of goodwill amortization) overall sales growth for 2002. Excluding acquisitions, primarily the European of $404 million, or 12.7 percent of net sales. This comparison of operating joint venture, consolidated net sales increased 4 percent in 2002. Sales income margins reflects tight cost controls, savings from cost reduction growth was experienced in most of the company’s divisions. Changes in initiatives, and the sale of new products. currency translation negatively impacted the consolidated sales growth In addition to continuing operations, a legal issue related to the disposal rate by approximately 1 percentage point for 2002. Sales results reflected of a business in 1992 was resolved during 2002, resulting in the recogni- aggressive selling efforts, the benefits of investments in sales force training tion of a gain from discontinued operations of approximately $1.9 million and productivity tools, and new products, which were partially offset by the (net of income tax benefit of $1.1 million) or $0.01 per diluted share. TURN IT UP poor economic environment. The company’s net income for 2002 was $210 million. Net income The company’s consolidated gross profit margin was 50.4 percent of net included restructuring charges of $32.4 million after tax, a curtailment gain sales for 2002, which decreased from a gross profit margin of 51.7 percent of $3.5 million after tax, a gain from discontinued operations of $1.9 million in 2001. Cost of sales included restructuring costs of $9.0 million for the after tax and a SFAS No. 142 transitional impairment charge of $4.0 million year ended December 31, 2002. Excluding these restructuring charges, the after tax. Excluding these items, after-tax income for 2002 was $241 mil- 23 gross profit margin was 50.7 percent for 2002. The gross profit margin was lion, an increase of 28 percent over net income of $188 million in 2001. also negatively affected by the acquisition and consolidation of the European This improvement reflected good operating income growth in most of the ECOLAB joint venture. The gross profit margin for 2001 on a pro forma basis (reflect- divisions, the additional operating income generated by the acquisition of ing the European joint venture on a consolidated basis) was 50.2 percent. the European joint venture and the elimination of goodwill amortization. This Ecolab’s gross profit margin benefited from product mix improvements and was partially offset by higher net interest expense due to increased borrow- cost reduction actions. ings primarily to finance the company’s acquisition of the European joint ven- Selling, general and administrative expenses for 2002 were 37.7 per- ture. Currency translation benefited diluted net income by $0.02 per share for cent of net sales, a decrease from total selling, general and administrative 2002. As a percentage of net sales, after-tax income for 2002 was 6.2 per- expenses of 38.0 percent of net sales in 2001. The selling, general and cent. Excluding the unusual items previously mentioned, after-tax income administrative expense margin on a pro forma basis (reflecting the consoli- for 2002 was 7.1 percent of net sales, down from 8.1 percent in 2001 due dation of the European joint venture and the elimination of goodwill amortiza- to the addition of Europe. tion) for 2001 was 37.5 percent. This increase in 2002 over the prior year is 2001 compared with 2000 partially due to stronger sales and income, which resulted in higher commis- The non-GAAP financial measures included in the following table are sions and incentive-based compensation. This increase was partially offset not presented pursuant to Article 11 (pro forma financial information) of by tight cost controls and savings related to restructuring activities in 2002. Regulation S-X and should be read in conjunction with the reported results During the first quarter of 2002, management approved various restruc- determined in accordance with accounting principles generally accepted turing and other cost-saving actions, including costs to integrate the in the United States of America. It is provided to assist in the reader’s under- company’s European operations, in order to streamline and improve the standing of the impact of unusual items on the comparability of the com- company’s global operations. These actions resulted in pre-tax charges of pany’s operations for the year ended December 31, 2000. The table below $51.8 million ($32.4 million after tax, or $0.25 per diluted share) in 2002. reconciles as reported amounts (U.S. GAAP amounts) to pro forma amounts These charges were partially offset by a curtailment gain of $5.8 million as adjusted for the gain on the sale of Jackson, special charges and the ($3.5 million after tax, or $0.03 per diluted share) attributable to certain cumulative effect of a change in accounting for revenue recognition. benefit plan changes. The restructuring included a reduction of the company’s
  • 5. Financial discussion The company’s net income for 2001 was $188 million, a decrease of Supplemental 2000 Pro Forma Consolidated 9 percent compared with net income of $206 million for 2000. Excluding Operating Results Information the unusual items from 2000, net income for 2001 decreased 5 percent Excluding from $198 million. The decrease in net income reflected the effects of a Year Ended December 31, 2000 Unusual Unusual (thousands, except per share) Total Items* Items difficult economic environment, lower gross margins, higher net interest Operating income $ 343,139 $(18,788) $ 324,351 expense, lower equity in the earnings of Henkel-Ecolab and the negative Interest expense, net (24,605) (24,605) impact of foreign currency translation. As a percentage of net sales, after- Income before income taxes 318,534 (18,788) 299,746 tax income for 2001 was 8.1 percent, down from 8.9 percent in 2000, Provision for income taxes (129,495) 8,111 (121,384) excluding the unusual items previously mentioned. Equity in earnings of Henkel-Ecolab 19,516 19,516 Change in accounting (2,428) 2,428 Operating Segment Performance Net income $ 206,127 $ (8,249) $ 197,878 Diluted net income per (thousands) 2002 2001 2000 common share $ 1.56 $ (0.06) $ 1.50 Net sales * Unusual items include the gain on the sale of the Jackson MSC, Inc. business of $25.9 mil- United States lion, special charges of $7.1 million and the cumulative effect of a change in accounting for Cleaning & Sanitizing $1,615,171 $1,548,882 $1,498,381 revenue recognition of $2.4 million. Other Services 308,329 273,020 248,317 Consolidated net sales reached $2.3 billion for 2001, an increase of Total United States 1,923,500 1,821,902 1,746,698 4 percent over net sales of over $2.2 billion in 2000. Sales increased in International Cleaning & Sanitizing 1,427,418 472,113 420,031 nearly all of the company’s divisions. Business acquisitions also contributed Total 3,350,918 2,294,015 2,166,729 to the overall sales growth for 2001. Businesses acquired in 2001 and the Effect of foreign currency annualized effect of businesses acquired and disposed of in 2000 accounted translation 52,667 26,695 63,932 for approximately 2 percentage points of the growth in consolidated sales Consolidated $3,403,585 $2,320,710 $2,230,661 for 2001. Changes in currency translation negatively impacted the consoli- Operating income TURN IT UP dated sales growth rate by approximately 2 percentage points for 2001. United States Sales results reflected benefits from aggressive sales efforts, new account Cleaning & Sanitizing $ 271,838 $ 246,936 $ 249,182 growth, new products, and additional programs to solve customer cleaning Other Services 33,051 29,338 25,515 needs. These benefits were partially offset by a poor economic environment Total United States 304,889 276,274 274,697 and a slowdown in the travel and hospitality markets following the International Cleaning & Sanitizing 131,376 44,181 41,399 September 11 terrorist attacks. 24 Total 436,265 320,455 316,096 The company’s consolidated gross profit margin was 51.7 percent of Corporate (46,008) (4,938) 18,491 ECOLAB net sales for 2001, which decreased from a gross profit margin of 52.6 Effect of foreign currency percent in 2000. The comparison reflected lower fuel costs and restructur- translation 5,609 2,662 8,552 ing costs in 2001. These effects were offset by increased raw material Consolidated $ 395,866 $ 318,179 $ 343,139 costs, unfavorable sales mix, fixed costs growing faster than unit volume, Operating income as a percent foreign currency effects and general cost increases. of net sales Selling, general and administrative expenses for 2001 were 38.0 per- United States cent of net sales, a decrease from total selling, general and administrative Cleaning & Sanitizing 16.8% 15.9% 16.6% expenses of 38.2 percent of net sales in 2000. Selling, general and admin- Other Services 10.7 10.7 10.3 istrative expenses in 2000 included $4.4 million of income for reductions Total 15.9 15.2 15.7 International Cleaning in probable losses related to certain environmental matters partially offset & Sanitizing 9.2% 9.4% 9.9% by $4 million of expenses related to a large distributor. Selling, general and administrative expense improvements for 2001 primarily reflected the bene- The company’s operating segments have similar products and services and fits of a tighter focus on discretionary costs and synergies from acquisitions, the company is organized to manage its operations geographically. The which were partially offset by investments in the sales and service force, company’s operating segments have been aggregated into three reportable investments in acquisitions and increased retirement plan and medical costs. segments: United States Cleaning & Sanitizing, United States Other Services, Operating income for 2001 was $318 million and decreased 7 percent and International Cleaning & Sanitizing. The company evaluates the perfor- from $343 million in 2000. This is a decrease of 2 percent from 2000 when mance of its International operations based on fixed management rates excluding the unusual items that occurred during 2000. Business acquisi- of currency exchange. Therefore, International sales and operating income tions had a minimal effect on operating income for 2001. As a percentage totals, as well as the International financial information included in this of net sales, operating income was 13.7 percent compared with 2000 financial discussion, are based on translation into U.S. dollars at the fixed operating income of 14.5 percent, excluding unusual items. This decrease currency exchange rates used by management for 2002. All other account- in operating income reflects the poor economic environment and a slow- ing policies of the reportable segments are consistent with accounting prin- down in the travel and hospitality markets. ciples generally accepted in the United States of America and the accounting
  • 6. policies of the company described in Note 2 of the notes to consolidated reflected good growth driven primarily by the non-travel portion of the financial statements. Additional information about the company’s reportable business. Trends in sales to the travel related business showed improve- segments is included in Note 16 of the notes to consolidated financial state- ment over the course of 2002. Sales of Kay’s U.S. operations increased ments. The following chart presents the comparative percentage change in over the prior year with strong growth in both its food retail business and net sales for each of the company’s operating segments (excluding Europe) sales to the quickservice market. Textile Care sales increased from the for 2002 and 2001. European operations have been excluded since they prior year due to increased sales to existing customers as well as sales were consolidated for the first time in 2002, making percentage compar- to new customers. Professional Products sales decreased in 2002 due to isons not applicable. both a decline in the core sales of the Janitorial market and a decrease in the non-core specialty business reflecting a planned restructuring of the Percent Change JaniSource business. Professional Products’ sales, however, were positively Sales Growth Information From Prior Year impacted at the end of 2002 due to a long-term supply agreement that 2002 2001 became effective in December 2002. Water Care Services sales decreased Net sales from the prior year due to customer cost cutting and consolidations. Water United States Cleaning & Sanitizing Care also continues to exit non-core markets. Vehicle Care sales growth for Institutional 6% 3% 2002 was primarily due to new business with major oil companies as well Kay 9 8 as new product introductions. Food & Beverage sales increased slightly Textile Care 3 (5) from the prior year with good growth in sales to the dairy, beverage and Professional Products (4) 7 meat and poultry markets which were offset by weak Agri sales. Water Care Services (3) 5 Vehicle Care 3 9 Food & Beverage 1 1 United States Other Services Total United States Cleaning & Sanitizing 4% 3% United States Other Services Sales (Dollars in millions) Business Mix (Percent) Pest Elimination 7% 8% $308 GCS Service 19 33 TURN IT UP s Pest Elimination 60% $273 $248 Total United States Other Services 13% 10% s GCS Service 40% Total United States 6% 4% International Cleaning & Sanitizing Asia Pacific 2% 9% Latin America 10 13 25 Canada 5 7 2000 2001 2002 2002 Africa/Export and Other 5 32 ECOLAB Total International Cleaning & Sanitizing (excluding Europe) 5% 12% Sales of United States Other Services operations increased 13 percent Consolidated (excluding Europe) 5% 4% to $308 million in 2002, from $273 million in 2001. Excluding the effects of business acquisitions, sales increased 4 percent for 2002. Pest Elimination’s sales in 2002 included strong growth in non-contract services, which was United States Cleaning & Sanitizing partially offset by a slowdown in the growth of contract services. GCS Sales (Dollars in millions) Business Mix (Percent) Service sales growth increased over the prior year, reflecting the continued expansion of its operations through acquisitions and a focus on integrating $1,615 $1,549 $1,498 s Institutional 60% past acquisitions. Excluding the effects of businesses acquired, GCS sales s Food & Beverage 17% decreased 1 percent for 2002. The results reflected the division’s focus on s Kay 9% s Professional Products 6% standardizing operating procedures and the impact of the hospitality slow- s Textile Care 3% down on the GCS business. United States Other Services also includes s Vehicle Care 3% s Water Care Services 2% modest sales from the addition of EcoSure operations in January 2002. Management rate-based sales of the company’s International Cleaning & Sanitizing operations reached $1.4 billion for 2002, an increase of 202 2000 2001 2002 2002 percent over sales of $0.5 billion in 2001. International Cleaning & Sanitizing includes European sales of $0.9 billion for 2002. Prior to 2002, the company Sales of the company’s United States Cleaning & Sanitizing operations included the results of the former European joint venture operations in its were $1.6 billion in 2002 and increased 4 percent over net sales of $1.5 financial statements using the equity method of accounting. Excluding billion in 2001. Business acquisitions had no effect on the growth in sales Europe’s sales, International Cleaning & Sanitizing sales growth was 5 percent for 2002. Sales benefited from good growth in sales of U.S. Institutional for 2002. Excluding all business acquisitions and divestitures, sales also and Kay operations. U.S. Institutional operations sales growth during 2002 increased 5 percent in 2002. European sales, although not consolidated prior
  • 7. Financial discussion Operating income of International Cleaning & Sanitizing operations rose International Cleaning & Sanitizing 197 percent to $131 million in 2002 from operating income of $44 million in 2001. The International operating income margin decreased from 9.4 Sales (Dollars in millions) Business Mix (Percent) percent in 2001 to 9.2 percent in 2002. Operating income in 2001 does not reflect the effect of SFAS No. 142 and includes $5.3 million of amortization $1,427 s Europe 65% expense related to goodwill. Excluding acquisitions and including the pro s Asia Pacific 17% s Latin America 7% forma effects of SFAS No.142 on 2001, operating income for 2002 increased s Canada 6% 10 percent over the prior year. Excluding acquisitions (primarily Europe) and s Africa/Export and Other 5% $472 $420 including the pro forma effects of SFAS No. 142 on last year, the operating income margin for International increased to 11.1 percent of net sales from 10.5 percent in 2001. Significant operating income growth and margin 2000 2001 2002 2002 improvement from Asia Pacific, Latin America and Canada contributed to the increase. The company added 510 sales-and-service associates to its International Cleaning & Sanitizing operations, including Europe, during 2002. to 2002, increased 8 percent over 2001 due to good growth in sales to the Operating income margins of the company’s International operations food and beverage markets and European acquisitions. For the Asia Pacific are less than the operating income margins realized for the company’s region, Japan, New Zealand and China showed good sales growth for the U.S. operations. The lower International margins are due to higher costs year while Australia’s sales declined due to the sale of its Hygiene Services of importing raw materials and finished goods, increased investments in business. Asia Pacific sales increased 3 percent in 2002, excluding business dispensing equipment and the additional costs caused by the difference acquisitions and divestitures. The increase in Asia Pacific sales was primar- in scale of International operations where several operating locations are ily from the institutional and food and beverage markets. Latin America smaller in size, as well as to the additional cost of operating in numerous sales increased 8 percent in 2002, excluding business acquisitions, with and diverse foreign jurisdictions. Proportionately larger investments in sales, good growth in all countries except Venezuela due to the economic impact technical support and administrative personnel are also necessary in order of the devaluation of its currency. Sales in Canada increased over the prior to facilitate growth of International operations. year due to good growth in sales to the institutional market. Sales of the TURN IT UP Africa/Export and Other region increased in 2002 reflecting weakness in 2001 compared with 2000 Israel offset by good growth in South Africa and other operations. Sales of the company’s United States Cleaning & Sanitizing operations Operating income of the company’s United States Cleaning & Sanitizing were $1.5 billion in 2001 and increased 3 percent over net sales in 2000. operations was $272 million in 2002, an increase of 10 percent from oper- Business acquisitions accounted for approximately 1 percentage point of ating income of $247 million in 2001. As a percentage of net sales, operat- the growth in sales for 2001. Sales reflected solid growth in the company’s 26 ing income increased from 15.9 percent in 2001 to 16.8 percent in 2002. Kay, Professional Products and Vehicle Care operations. The sales improve- The improvement in reported operating income margins reflected tight cost ECOLAB ment also reflected benefits from new products and services, as well as controls, savings from cost reduction initiatives, the sale of new products aggressive sales efforts and programs. Net selling price increases during and the impact of adopting SFAS No. 142. Operating income in 2001 2001 were not significant. U.S. Institutional operations sales growth during does not reflect the effect of SFAS No. 142, and thus includes amortization 2001 reflected modest growth in its specialty, housekeeping and Ecotemp expenses related to goodwill of $10.6 million. If the provisions of SFAS No. programs, which were partially offset by the continuing slow down in the 142 had been applied retroactively to January 1, 2001, operating income economy and the weaker demand in the lodging and restaurant markets for the United States Cleaning & Sanitizing operations would have increased due to the events of September 11, 2001. Excluding the acquisition of 6 percent and the operating income margin for the U.S. Cleaning & Sanitizing Facilitec, Institutional’s sales increased 2 percent for 2001. Sales of Kay’s operations would have been 16.6 percent for 2001. The company added U.S. operations increased over 2000 with significant growth in its food retail 115 sales-and-service associates to its United States Cleaning & Sanitizing business and good growth in sales to the quickservice market. Excluding operations during 2002. the acquisition of Southwest Sanitary Distributing Company (SSDC) in Operating income of United States Other Services operations increased February 2000, Kay’s sales for 2001 increased 5 percent over 2000. Textile 13 percent to $33 million in 2002. The operating income margin for United Care sales decreased in 2001 due to exiting selected businesses and a very States Other Services was 10.7 percent for both 2002 and 2001. Operating competitive market. Professional Products’ sales increased in 2001 with income in 2001 does not reflect the effect of SFAS No. 142 and includes good growth in its healthcare and janitorial sales. Professional Products’ $1.9 million of amortization expense related to goodwill. Excluding acquisi- sales have been positively impacted by long-term supply agreements in tions and the effects of SFAS No. 142, operating income increased 3 per- its janitorial business. Water Care Services’ sales increased over 2000 with cent over 2001. Excluding acquisitions and including the pro forma effects good growth in sales to the food and beverage and hospitality markets. of SFAS No. 142 on the prior year, the operating income margin for United Vehicle Care sales growth for 2001 was primarily due to new products States Other Services was 11.4 percent for both 2002 and 2001. Pest and additional business with major oil company chains. Food & Beverage Elimination had strong operating income growth due to increased produc- U.S. sales increased in 2001 with good growth in the beverage market. tivity and cost controls. Operating income for GCS declined due to continued Sales of the United States Other Services operations increased 10 per- investments in the division’s infrastructure and systems. During 2002, the cent to $273 million in 2001, from $248 million in 2000. Excluding the company added 75 sales-and-service associates to its United States Other effects of businesses acquired and disposed of, sales increased 7 percent Services operations. for 2001. Pest Elimination’s sales in 2001 included solid growth in contract services, slightly offset by a slowdown in non-contract services due to
  • 8. economic conditions. GCS Service sales growth increased over last year Henkel-Ecolab joint venture. On November 30, 2001, Ecolab purchased reflecting the continued expansion of its operations through acquisitions. the remaining 50 percent interest of Henkel-Ecolab it did not previously Excluding the effects of businesses acquired, GCS sales increased 4 percent own from Henkel KGaA. Additional details related to this purchase are for 2001. In the fourth quarter of 2000, the company sold its Jackson dish- included in Note 5 of the notes to consolidated financial statements. machine manufacturing business. Ecolab consolidated Henkel-Ecolab’s operations effective with the Management rate-based sales of the company’s International Cleaning & November 30, 2001 acquisition date and end of Henkel-Ecolab’s fiscal year Sanitizing operations reached $472 million for 2001, an increase of 12 per- for 2001. Because the company consolidates its International operations on cent over sales of $420 million in 2000. Business acquisitions accounted the basis of their November 30 fiscal year ends, Henkel-Ecolab’s balance for approximately 5 percentage points of the sales increase in 2001 for sheet was consolidated with Ecolab’s balance sheet as of year-end 2001. International Cleaning & Sanitizing operations. Excluding business acquisi- The income statement for the European operations was consolidated with tions, Asia Pacific sales increased 8 percent with double-digit sales growth Ecolab’s operations beginning in 2002. in New Zealand and East Asia and good growth in Japan. The increase in 2001 compared with 2000 Asia Pacific sales was primarily from the food and beverage and institutional The company included the results of Henkel-Ecolab operations in its financial markets. Latin America sales increased 7 percent in 2001, excluding busi- statements using the equity method of accounting through November 30, ness acquisitions, with good growth in almost all countries. Sales in Canada 2001. The company’s equity in earnings of Henkel-Ecolab, which included increased in 2001 due to strong growth in sales to the institutional and food royalty income and goodwill amortization, was $16 million in 2001, a and beverage markets. Sales of the Africa/Export region increased sharply decrease of 19 percent when compared to $20 million in 2000. When in 2001 due to strong results in South Africa and the full-year sales effect measured in euros, net income of Henkel-Ecolab for 2001 decreased 13 of a business, which was acquired in September 2000. percent and reflected lower sales volumes driven by slowing economies Operating income of the company’s United States Cleaning & Sanitizing and increasing raw material, energy and other costs, which were partially operations was $247 million in 2001, a decrease of 1 percent from operating offset by price increases. income of $249 million in 2000. Business acquisitions had little effect on Henkel-Ecolab sales, although not consolidated in Ecolab’s financial operating income for 2001. Operating income included strong growth for statements, increased 4 percent in 2001 when measured in euros. Sales Professional Products and Water Care Services with moderate growth in TURN IT UP reflected the impact of Europe’s slowing economies and reduced orders Kay and Vehicle Care operations. Operating income of Institutional, Food & from distributors as they lowered inventory levels. When measured in U.S. Beverage and Textile Care was lower than the prior year. As a percentage of dollars, Henkel-Ecolab sales were flat when compared to 2000 due to the net sales, operating income decreased from 16.6 percent in 2000 to 15.9 negative effects of a stronger U.S. dollar. percent in 2001. Operating income margins declined due to lower sales volume, unfavorable sales mix, increased storage and handling costs and Corporate 27 increased raw material costs. The company added 50 sales-and-service Corporate operating expense totaled $46.0 million in 2002, compared with associates to its United States Cleaning & Sanitizing operations during 2001. ECOLAB corporate operating expense of $4.9 million in 2001 and corporate operat- Operating income of United States Other Services operations increased ing income of $18.5 million in 2000. Prior to 2002, corporate operating 15 percent to $29 million in 2001. Excluding operating income of businesses expense included overhead costs directly related to the former European acquired in 2001 and the annualized effect of businesses acquired and joint venture. In 2002, these expenses were included in the International disposed of in 2000, operating income for 2001 increased 20 percent. Cleaning & Sanitizing operating segment. The amount remaining in corporate Both Pest Elimination and GCS reported double-digit increases in operating operating expense in 2002 included restructuring and merger integration income. The operating income margin of United States Other Services costs of $51.8 million, which were partially offset by a curtailment gain of operations was 10.7 percent, which is up from 10.3 percent of net sales $5.8 million related to benefit plan changes. In 2000, corporate operating in 2000. This increase reflected GCS’ efforts to improve income by focusing income also included the $25.9 million gain on the sale of the Jackson on operational efficiencies, as well as Pest Elimination’s increased produc- business, special charges of $7.1 million and income of $4.4 million for tivity, more efficient use of products and cost controls. During 2001, the net reductions in probable losses related to certain environmental matters. company added 120 sales-and-service associates to its United States Other Services operations. Interest and Income Taxes Operating income of International Cleaning & Sanitizing operations Net interest expense of $44 million for 2002 increased 54 percent over net rose 7 percent to $44 million in 2001 from operating income of $41 million interest expense of $28 million in 2001. This increase is primarily due to in 2000. The effects of businesses acquired accounted for approximately higher debt levels incurred at year-end 2001 to finance the acquisition of 1 percentage point of the growth in operating income for 2001. The the remaining 50 percent interest of Henkel-Ecolab which Ecolab did not International operating income margin decreased from 9.9 percent in 2000 previously own. to 9.4 percent in 2001. While the Latin America and Africa/Export regions Net interest expense for 2001 was $28 million, an increase of 16 percent showed operating income margin improvement, the margins for Asia Pacific over net interest expense of $25 million in 2000. This increase reflected and Canada declined due to higher raw material costs. Excluding associates higher debt levels during the year, including the additional debt incurred added by Henkel-Ecolab, the company added 160 sales-and-service asso- late in the year to purchase the remaining 50 percent of Henkel-Ecolab. ciates to its International Cleaning & Sanitizing operations during 2001. The company’s effective income tax rate was 39.8 percent for 2002, compared with effective income tax rates in 2001 and 2000 of 40.5 percent Henkel-Ecolab and 40.7 percent, respectively. Excluding the effects of special charges in Prior to November 30, 2001, the company operated cleaning and sanitizing 2002, the estimated annual effective income tax rate related to ongoing businesses in Europe through a 50 percent economic interest in the
  • 9. Financial discussion operations was 39.5 percent. This decrease from prior years was principally long-term debt. In February Cash Provided by due to the adoption of SFAS No. 142 at the beginning of 2002, which elimi- 2002, the company refinanced Operating Activities nated the amortization of goodwill and related income tax effects. Overall $266 million of commercial (Dollars in millions) effective rates on International operations were higher in 2002, principally paper borrowings through the $423 due to the addition of the European joint venture. This was partially offset issuance of euro 300 million of $364 by lower state income tax rates in 2002. Excluding the effects of the sale Euronotes. As of December 31, $315 $293 of Jackson and restructuring expenses in 2000, the effective income tax 2002 the ratio of total debt to $236 rate was 40.5 percent in 2000. capitalization was 39 percent, down from 46 percent at year- Financial Position end 2001 and compared with The company’s debt continued to be rated within the “A” categories by the 33 percent at year-end 2000. 1998 1999 2000 2001 2002 major rating agencies during 2002. Significant changes in the company’s The lower debt to capitalization financial position during 2002 and 2001 included the following: rate in 2002 is due to repay- s Total assets reached nearly $2.9 billion at December 31, 2002, an ments made during the year while the higher debt to capitalization ratio for increase of 14 percent over total assets of $2.5 billion at year-end 2001. 2001 compared to 2000 was due to funding for the company’s acquisition Accounts receivable have increased 8 percent since year-end 2001, primarily of the Henkel-Ecolab joint venture. due to the effect of business acquisitions during the year as well as due to the effect of exchange rates. Other assets have increased significantly Cash Flows since year-end 2001 due to payments totaling approximately $125 million Cash provided by operating activities reached a new high of $423 million to fund the company’s U.S. pension plan during 2002. Other current liabili- for 2002, an increase from $364 million in 2001 and $315 million in 2000. ties have increased since year-end 2001 primarily due to an increase in Operating cash flows for 2002 reflected the additional cash flows from restructuring accruals and due to the effect of exchange rates. businesses acquired, primarily the European joint venture, as well as the During 2001 total assets increased to $2.5 billion at year-end 2001 improvement in accounts receivable and days sales outstanding. The from $1.7 billion at year-end 2000. At year-end 2001, the balance sheet of operating cash flow for 2001 increased over 2000 due to a reduction in TURN IT UP Henkel-Ecolab was consolidated with the company’s balance sheet due to year-end accounts receivable and the additional cash flows generated the acquisition of the remaining 50 percent of Henkel-Ecolab from Henkel by business acquisitions. Changes in net operating asset levels negatively KGaA. Total assets as of November 30, 2001 increased approximately $0.7 affected the operating cash flow by approximately $70 million in 2002, billion as a result of this acquisition and the consolidation of Henkel-Ecolab. positively impacted it by $10 million in 2001 and negatively affected it by s Working capital levels increased to $150 million at December 31, 2002 approximately $2 million in 2000. 28 from $102 million at year-end 2001 reflecting a significant decrease in Cash flows used for investing activities included capital expenditures short-term debt from the prior year. Working capital levels at year-end 2001 of $213 million in 2002, $158 million in 2001 and $150 million in 2000. ECOLAB of $102 million were up from $69 million at year-end 2000 reflecting lower Worldwide additions of merchandising equipment, primarily cleaning and levels of current liabilities prior to the Henkel-Ecolab acquisition, as well as sanitizing product dispensers, accounted for approximately 70 percent of increases in accounts receivable and inventory due to the consolidation of each year’s capital expenditures. Merchandising equipment is depreciated Europe’s balance sheet for the first time as of year-end 2001. During 2001, over 3 to 7 year lives. Cash used for businesses acquired included Terminix short-term debt increased approximately $97 million due to the issuance Ltd. and Kleencare Hygiene in 2002, Henkel-Ecolab in 2001 and Spartan of commercial paper to finance the acquisition of Henkel-Ecolab. and Facilitec in 2000. Investing cash flow activity also included the proceeds s Total debt was $700 million at December 31, 2002 and decreased from from the sale of the Jackson business in 2000. total debt of $746 million at year-end 2001. This decrease in total debt Financing cash flow activity included cash used to reacquire shares and during 2002 is principally due to debt repayments made during the year. pay dividends and cash provided and used through the company’s debt Total debt at year-end 2000 was $371 million. During 2001, commercial arrangements. In May 2000, the company announced a program to repur- paper borrowings were incurred to fund the acquisition of the remaining chase up to $200 million of its common stock. Share repurchases totaled 50 percent of the Henkel-Ecolab joint venture. At December 31, 2001, $9 million in 2002, $32 million in 2001 and $187 million in 2000. These the company classified $266 million of commercial paper borrowings as repurchases were funded with operating cash flows and additional debt. In December 2000, the company announced an authorization to repurchase up to 5 million additional shares of common stock. Total Debt to Capitalization In 2002, the company increased its annual dividend rate for the eleventh consecutive year. The company has paid dividends on its common (Percent) (Percent) stock for 66 consecutive years. Cash dividends declared per share of com- 46% mon stock, by quarter, for each of the last three years were as follows: s Shareholders’ Equity 61% 39% s Total Debt 39% 33% Cash Dividends Declared First Second Third Fourth Quarter Quarter Quarter Quarter Year 2002 $0.135 $0.135 $0.135 $0.145 $0.55 2001 0.13 0.13 0.13 0.135 0.525 2000 2001 2002 2002 2000 0.12 0.12 0.12 0.13 0.49