Bandra High Profile Sexy Call Girls,9833754194-Khar Road Speciality Call Girl...
CLOrox fy05_q2_spmt
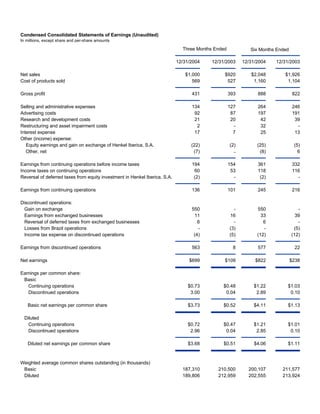
1. Condensed Consolidated Statements of Earnings (Unaudited)
In millions, except share and per-share amounts
Three Months Ended Six Months Ended
12/31/2004 12/31/2003 12/31/2004 12/31/2003
Net sales $1,000 $920 $2,048 $1,926
Cost of products sold 569 527 1,160 1,104
Gross profit 431 393 888 822
Selling and administrative expenses 134 127 264 246
Advertising costs 92 87 197 191
Research and development costs 21 20 42 39
Restructuring and asset impairment costs 2 - 32 -
Interest expense 17 7 25 13
Other (income) expense:
Equity earnings and gain on exchange of Henkel Iberica, S.A. (22) (2) (25) (5)
Other, net (7) (8) 6
-
Earnings from continuing operations before income taxes 194 154 361 332
Income taxes on continuing operations 60 53 118 116
Reversal of deferred taxes from equity investment in Henkel Iberica, S.A. (2) - (2) -
Earnings from continuing operations 136 101 245 216
Discontinued operations:
Gain on exchange 550 - 550 -
Earnings from exchanged businesses 11 16 33 39
Reversal of deferred taxes from exchanged businesses 6 - 6 -
Losses from Brazil operations - (3) - (5)
Income tax expense on discontinued operations (4) (5) (12) (12)
Earnings from discontinued operations 563 8 577 22
Net earnings $699 $109 $822 $238
Earnings per common share:
Basic
Continuing operations $0.73 $0.48 $1.22 $1.03
Discontinued operations 3.00 0.04 2.89 0.10
Basic net earnings per common share $3.73 $0.52 $4.11 $1.13
Diluted
Continuing operations $0.72 $0.47 $1.21 $1.01
Discontinued operations 2.96 0.04 2.85 0.10
Diluted net earnings per common share $3.68 $0.51 $4.06 $1.11
Weighted average common shares outstanding (in thousands)
Basic 187,310 210,500 200,107 211,577
Diluted 189,806 212,959 202,555 213,924
2. Segment Information (Unaudited)
In millions
Second Quarter
Earnings from Continuing Operations
Net Sales Before Income Taxes
Three Months Ended % Three Months Ended %
(1)
12/31/2004 12/31/2003 Change (1)
12/31/2004 12/31/2003 Change
Household Products- North America $584 $536 9% $154 $139 11%
Specialty Products 267 255 5% 93 82 13%
International 149 129 16% 38 32 19%
Corporate (2) - - - (91) (99) 8%
Total Company $1,000 $920 9% $194 $154 26%
Year To Date
Earnings from Continuing Operations
Net Sales Before Income Taxes
Six Months Ended % Six Months Ended %
12/31/2004 12/31/2003 Change (1) 12/31/2004 12/31/2003 Change (1)
Household Products- North America $1,209 $1,121 8% $295 $282 5%
Specialty Products 568 560 1% 193 180 7%
International 271 245 11% 65 61 7%
(2)
Corporate - - - (192) (191) -1%
Total Company $2,048 $1,926 6% $361 $332 9%
(1)
Percentages based on rounded numbers.
(2)
Includes gain of $20 million related to the company’s investment in the Henkel Iberica, S.A., joint venture.
3. Condensed Consolidated Balance Sheets (Unaudited)
In millions
12/31/2004 6/30/2004
Assets
Current assets
Cash and cash equivalents $300 $232
Receivables, net 354 460
Inventories 342 301
Income taxes receivable 8 -
Other current assets 43 50
Total current assets 1,047 1,043
Property, plant and equipment, net 991 1,052
Goodwill, net 748 742
Trademarks and other intangible assets, net 606 633
Other assets, net 318 364
Total assets $3,710 $3,834
Liabilities and Stockholders' (Deficit) Equity
Current liabilities
Notes and loans payable $545 $289
Current maturities of long-term debt 2 2
Accounts payable 293 310
Accrued liabilities 629 643
Income taxes payable - 24
Total current liabilities 1,469 1,268
2,124 475
Long-term debt
Other liabilities 390 377
Deferred income taxes 184 174
Stockholders' (deficit) equity
Common stock 250 250
Additional paid-in capital 314 301
Retained earnings 3,542 2,846
Treasury shares, at cost (4,339) (1,570)
Accumulated other comprehensive net losses (207) (274)
Unearned compensation (17) (13)
Stockholders' (deficit) equity (457) 1,540
Total liabilities and stockholders' (deficit) equity $3,710 $3,834