
Recomendados
Más contenido relacionado
La actualidad más candente
La actualidad más candente (20)
Destacado
Destacado (20)
Similar a CLX0201_1_Balance_Sheets-159159
Similar a CLX0201_1_Balance_Sheets-159159 (20)
Más de finance48
Más de finance48 (20)
Último
Último (20)
CLX0201_1_Balance_Sheets-159159
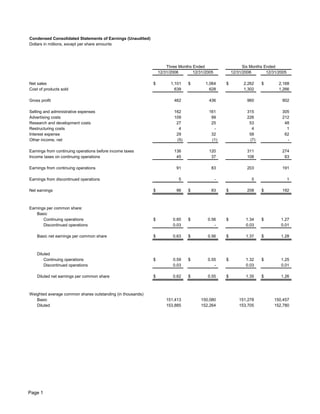
- 1. Condensed Consolidated Statements of Earnings (Unaudited) Dollars in millions, except per share amounts Three Months Ended Six Months Ended 12/31/2006 12/31/2005 12/31/2006 12/31/2005 Net sales $ 1,101 $ 1,064 $ 2,262 $ 2,168 Cost of products sold 639 628 1,302 1,266 Gross profit 462 436 960 902 Selling and administrative expenses 162 161 315 305 Advertising costs 109 99 226 212 Research and development costs 27 25 53 48 Restructuring costs 4 - 4 1 Interest expense 29 32 58 62 Other income, net (5) (1) (7) - Earnings from continuing operations before income taxes 136 120 311 274 Income taxes on continuing operations 45 37 108 83 Earnings from continuing operations 91 83 203 191 Earnings from discontinued operations 5 - 5 1 Net earnings $ 96 $ 83 $ 208 $ 192 Earnings per common share: Basic Continuing operations $ 0.60 $ 0.56 $ 1.34 $ 1.27 Discontinued operations 0.03 - 0.03 0.01 Basic net earnings per common share $ 0.63 $ 0.56 $ 1.37 $ 1.28 Diluted Continuing operations $ 0.59 $ 0.55 $ 1.32 $ 1.25 Discontinued operations 0.03 - 0.03 0.01 Diluted net earnings per common share $ 0.62 $ 0.55 $ 1.35 $ 1.26 Weighted average common shares outstanding (in thousands) Basic 151,413 150,080 151,278 150,457 Diluted 153,885 152,264 153,705 152,780 Page 1
- 2. Segment Information (Unaudited) Dollars in millions Second Quarter Earnings/(Losses) from Continuing Net Sales Operations Before Income Taxes % % Three Months Ended Three Months Ended Change (1) (1) 12/31/2005 Change 12/31/2006 12/31/2005 12/31/2006 Household Group - North America $484 $495 -2% $147 $161 -9% Specialty Group 439 405 8% 107 82 30% International 178 164 9% 34 33 3% Corporate - - - (152) (156) 3% Total Company $1,101 $1,064 3% $136 $120 13% Year To Date Earnings/(Losses) from Continuing Net Sales Operations Before Income Taxes % % Six Months Ended Six Months Ended Change (1) (1) 12/31/2005 Change 12/31/2006 12/31/2005 12/31/2006 Household Group - North America $1,033 $1,019 1% $325 $331 -2% Specialty Group 890 830 7% 216 171 26% International 339 319 6% 68 68 0% Corporate - - - (298) (296) -1% Total Company $2,262 $2,168 4% $311 $274 14% (1) Percentages based on rounded numbers. Page 2
- 3. Condensed Consolidated Balance Sheets (Unaudited) Dollars in millions 12/31/2006 6/30/2006 12/31/2005 Assets Current assets $ $ $ Cash and equivalents 179 192 273 Receivables, net 393 435 377 Inventories 340 292 359 Other current assets 67 88 58 Total current assets 979 1,007 1,067 Property, plant and equipment, net 985 1,004 993 Goodwill 801 744 747 Trademarks and other intangible assets, net 608 604 595 251 257 165 Other assets $ $ $ Total assets 3,624 3,616 3,567 Liabilities and Stockholders’ Deficit Current liabilities $ $ $ Notes and loans payable 126 156 521 Current maturities of long-term debt 651 152 3 Accounts payable 283 329 274 Accrued liabilities 435 474 450 Income taxes payable 24 19 24 Total current liabilities 1,519 1,130 1,272 Long-term debt 1,464 1,966 2,119 Other liabilities 562 547 631 Deferred income taxes 112 129 73 Total liabilities 3,657 3,772 4,095 Contingencies Stockholders’ deficit Common stock 159 250 250 Additional paid-in capital 437 397 342 Retained earnings 7 3,939 3,781 Treasury shares (428) (4,527) (4,570) (208) (215) (331) Accumulated other comprehensive net losses (33) (156) (528) Stockholders’ deficit $ $ 3,616 $ Total liabilities and stockholders’ deficit 3,624 3,567 Note: During the second quarter of fiscal year 2007, Clorox retired 91 million shares of its treasury stock. As a result of the retirement, treasury stock was reduced by $4,137 and common stock and retained earnings were reduced by $91 and $4,046, respectively. There was no impact to the company’s overall equity position as a result of the retirement. Page 3