SlideShare una empresa de Scribd logo
1 de 4
Descargar para leer sin conexión
The Company reports its financial results in accordance with generally accepted accounting principles (GAAP). However, management believes that certain non-GAAP performance measures and ratios used in managing the business may provide users of
this financial information additional meaningful comparisons between current results and results in prior operating periods. Management believes that these non-GAAP measures can provide additional meaningful reflection of underlying trends of the business
because they provide a comparison of historical information that excludes certain items that impact the overall comparability due to the fact that these items do not represent results from the fundamental operations of the Company. See the Table below for
supplemental financial data and corresponding reconciliations to GAAP financial measures for the three months ended July 1, 2005 and July 2, 2004. Non-GAAP financial measures should be viewed in addition to, and not as an alternative for, the Company’s
reported results prepared in accordance with GAAP.


                                                                                                                                                   THE COCA-COLA COMPANY AND SUBSIDIARIES
                                                                                                                                                 Reconciliation of GAAP to Non-GAAP Financial Measures


                                                                                                                                                                              (UNAUDITED)
                                                                                                                                                            (In Millions, except per share data and margins)

                                                                                                             Three Months Ended July 1, 2005                                                                                         Three Months Ended July 2, 2004


                                                                                                               Items Impacting Comparability                                                                                          Items Impacting Comparability                                                       % Change - After
                                                                                                                                                                                                                                                                                                             % Change -
                                                                                                                                                                                   After                                                                                                      After
                                                                                                                                                                                                                                                                                                                            Considering
                                                                                                                                                                                                                                                                                                              Reported
                                                                       Reported                                                                                                Considering       Reported                                                                                 Considering
                                                                                                                                                                                                                                                                                                                               Items
                                                                                                                                                                                                                                                                                                               (GAAP)
                                                                        (GAAP)                                                                                                    Items           (GAAP)                                                                                     Items
                                                                                                                                                                                                                                                                                                                            (Non-GAAP)
                                                                                                                                                                               (Non-GAAP)                                                                                                 (Non-GAAP)
                                                                                                                                  Repatriation of                                                                 Tax Settlement at Gain on Issuance
                                                                                           HFCS Lawsuit       Resolution of          Foreign                                                                         Coca-Cola         of Stock by      Favorable Tax      Assets
                                                                                            Settlement        Tax Matters           Earnings           Equity Investee                                                 Femsa         Equity Investee     Settlement       Write-down

Net Operating Revenues                                                        $6,310                                                                                                 $6,310           $5,914                                                                                    $5,914           7               7
Cost of goods sold                                                             2,146                 $42                                                                              2,188            2,039                                                                                     2,039           5               7

Gross Profit                                                                   4,164                  (42)                                                                            4,122            3,875                                                                                     3,875           7               6
Selling, general and administrative expenses                                   2,192                                                                                                  2,192            1,984                                                                                     1,984          10              10
Other operating charges                                                           -                                                                                                     -                   88                                                                    ($88)            -              --             --
Operating Income                                                               1,972                  (42)                                                                            1,930            1,803                                                                       88            1,891           9               2
Interest income                                                                       54                                                                                                    54              32                                                                                         32       69              69
Interest expense                                                                      62                                                                                                    62              47                                                                                         47       32              32
Equity income                                                                     267                                                                                ($21)             246              221                  ($37)                                                                184           21              34
Other income (loss) - net                                                         (15)                                                                                                  (15)                (5)                                                                                        (5)
Gain on issuances of stock by equity investees                                    -                                                                                                     -                   49                                  ($49)                                              -              --             --

Income Before Income Taxes                                                     2,216                  (42)                                                            (21)            2,153            2,053                  (37)               (49)                              88            2,055           8               5
Income taxes                                                                      493                 (16)                 $17                $25                       (2)            517              469                   (13)               (19)             $41              30             508            5               2

Net Income                                                                    $1,723                ($26)                 ($17)              ($25)                   ($19) $          1,636           $1,584                 ($24)              ($30)            ($41)            $58           $1,547           9               6

Diluted Net Income Per Share                                                   $0.72              ($0.01)               ($0.01)            ($0.01)                 ($0.01)            $0.68            $0.65               ($0.01)            ($0.01)           ($0.02)          $0.02           $0.64 *        11               6

Average Shares Outstanding - Diluted                                           2,401               2,401                 2,401              2,401                   2,401             2,401            2,434                2,434              2,434            2,434            2,434           2,434           (1)            (1)

Gross Margin                                                                    66.0%                                                                                                 65.3%            65.5%                                                                                     65.5%
Operating Margin                                                                31.3%                                                                                                 30.6%            30.5%                                                                                     32.0%
Effective Tax Rate                                                              22.2%                                                                                                 24.0%            22.8%                                                                                     24.7%

Note: Items to consider for comparability include primarily charges, gains, and accounting changes. Charges and accounting changes negatively impacting net income are reflected
as increases to reported net income. Gains positively impacting net income are reflected as deductions to reported net income.


*Per share amounts may not add due to rounding.
The Company reports its financial results in accordance with generally accepted accounting principles (GAAP). However, management believes that certain non-GAAP performance measures and ratios used in managing the business may provide users of this
financial information additional meaningful comparisons between current results and results in prior operating periods. Management believes that these non-GAAP measures can provide additional meaningful reflection of underlying trends of the business because
they provide a comparison of historical information that excludes certain items that impact the overall comparability due to the fact that these items do not represent results from the fundamental operations of the Company. See the Table below for supplemental
financial data and corresponding reconciliations to GAAP financial measures for the six months ended Junly 1, 2005 and July 2, 2004. Non-GAAP financial measures should be viewed in addition to, and not as an alternative for, the Company’s reported results
prepared in accordance with GAAP.


                                                                                                                                               THE COCA-COLA COMPANY AND SUBSIDIARIES
                                                                                                                                             Reconciliation of GAAP to Non-GAAP Financial Measures


                                                                                                                                                                         (UNAUDITED)
                                                                                                                                                       (In Millions, except per share data and margins)

                                                                                                                Six Months Ended July 1, 2005                                                                                                    Six Months Ended July 2, 2004

                                                                                                                                                                                                                                                                                                                                       % Change -
                                                                                                                Items Impacting Comparability                                                                                                    Items Impacting Comparability
                                                                                                                                                                                                                                                                                                                         % Change -       After
                                                                                                                                                                                                 After                                                                                                     After
                                                                                                                                                                                                                                                                                                                          Reported    Considering
                                                            Reported                                                                                                                         Considering      Reported                                                                                 Considering
                                                                                                                                                                                                                                                                                                                           (GAAP)        Items
                                                             (GAAP)                                                                                                                             Items          (GAAP)                                                                                     Items
                                                                                                                                                 Accelerated
                                                                                                                                                                                                                                                                                                                                      (Non-GAAP)
                                                                                                                                                                                             (Non-GAAP)                                                                                                (Non-GAAP)
                                                                                                                Repatriation of Issuances of Amortization of                                                                  Tax Settlement at Gain on Issuance
                                                                                 HFCS         Resolution of        Foreign      Stock by Equity Stock-Based                                                                      Coca-Cola        of Stock by      Favorable Tax      Assets
                                                                               Settlement     Tax Matters         Earnings         Investees    Compensation         Equity Investee                                               Femsa         Equity Investee    Settlement       Write-down

Net Operating Revenues                                           $11,516                                                                                                                          $11,516         $10,942                                                                                   $10,942          5            5
Cost of goods sold                                                 3,964              $42                                                                                                           4,006           3,800                                                                                     3,800          4            5

Gross Profit                                                       7,552               (42)                                                                                                         7,510           7,142                                                                                     7,142          6            5
Selling, general and administrative expenses                       4,221                                                                                     ($50)                                  4,171           3,800                                                                                     3,800         11           10
Other operating charges                                               -                                                                                                                               -                  88                                                                  ($88)              -             --           --
Operating Income                                                   3,331               (42)                                                                    50                                   3,339           3,254                                                                         88          3,342          2            (0)
Interest income                                                      114                                                                                                                             114                 67                                                                                         67      70           70
Interest expense                                                     130                                                                                                                             130                 91                                                                                         91      43           43
Equity income                                                        358                                                                                                           ($21)             337             316                 ($37)                                                                 279          13           21
Other income (loss) - net                                             (32)                                                                                                                            (32)            (30)                                                                                      (30)
Gain on issuances of stock by equity investees                            23                                                                 (23)                                                     -                  49                                ($49)                                                -             --           --

Income Before Income Taxes                                         3,664               (42)                                                  (23)              50                   (21)            3,628           3,565                 (37)              (49)                                  88          3,567          3            2
Income taxes                                                         939               (16)             $73             ($127)               ($8)              12                    (2)             871             854                  (13)              (19)             $41                  30           893          10            (2)

Net Income                                                        $2,725             ($26)              ($73)            $127              ($15)              $38                  ($19) $          2,757          $2,711                ($24)             ($30)            ($41)            $58             $2,674          1            3

Diluted Net Income Per Share                                       $1.13            ($0.01)           ($0.03)           $0.05            ($0.01)            $0.02             ($0.01)               $1.15 *         $1.11              ($0.01)           ($0.01)           ($0.02)          $0.02             $1.10 *        2            5

Average Shares Outstanding - Diluted                               2,405            2,405             2,405             2,405             2,405             2,405              2,405                2,405           2,439               2,439             2,439            2,439            2,439             2,439          (1)          (1)

Gross Margin                                                       65.6%                                                                                                                            65.2%           65.3%                                                                                     65.3%
Operating Margin                                                   28.9%                                                                                                                            29.0%           29.7%                                                                                     30.5%
Effective Tax Rate                                                 25.6%                                                                                                                            24.0%           24.0%                                                                                     25.0%

Note: Items to consider for comparability include primarily charges, gains, and accounting changes. Charges and accounting changes negatively impacting net income are reflected
as increases to reported net income. Gains positively impacting net income are reflected as deductions to reported net income.

*Per share amounts may not add due to rounding.
The Company reports its financial results in accordance with generally accepted accounting principles (GAAP). However, management believes that certain non-GAAP performance
measures and ratios used in managing the business may provide users of this financial information additional meaningful comparisons between current results and results in prior
operating periods. Management believes that these non-GAAP measures can provide additional meaningful reflection of underlying trends of the business because they provide a
comparison of historical information that excludes certain items that impact the overall comparability due to the fact that these items do not represent results from the fundamental
operations of the Company. See the Table below for supplemental financial data and corresponding reconciliations to GAAP financial measures for the three months ended July 1,
2005 and July 2, 2004. Non-GAAP financial measures should be viewed in addition to, and not as an alternative for, the Company’s reported results prepared in accordance with
GAAP.


                                                               THE COCA-COLA COMPANY AND SUBSIDIARIES
                                                            Reconciliation of GAAP to Non-GAAP Financial Measures
                                                                     Operating Income (Loss), by Segment

                                                                                   (UNAUDITED)
                                                                                    (In Millions)

                                                Three Months Ended July 1, 2005                        Three Months Ended July 2, 2004                                % Change -
                                                                                                                                                    % Change -            After
                                                                                                                                                     Reported         Considering
                                                       Items Impacting                                           Items Impacting
                                                                                 After                                                  After
                                                                                                                                                      (GAAP)             Items
                                                         Comparability                                             Comparability
                                         Reported                            Considering            Reported                        Considering
                                                                                                                                                                      (Non-GAAP)
                                          (GAAP)                                Items                (GAAP)                            Items
                                                                             (Non-GAAP)                                             (Non-GAAP)
                                                                                                                     Asset
                                                        HFCS Lawsuit
                                                                                                                  Write-downs
                                                         Settlement

North America                                  $461                                    $461             $496                 $18          $514           (7)              (10)
Africa                                           86                                      86                73                               73          18                 18
East, South Asia and Pacific Rim                125                                     125               131                              131           (5)               (5)
European Union                                  711                                     711               647                              647          10                 10
Latin America                                   303                                     303               253                   6          259          20                 17
North Asia, Eurasia and Middle East             533                                     533               496                   6          502           7                 6
Corporate                                      (247)         ($42)                     (289)             (293)                58          (235)         16                (23)
Consolidated                                 $1,972          ($42)                   $1,930            $1,803                $88        $1,891           9                 2
The Company reports its financial results in accordance with generally accepted accounting principles (GAAP). However, management believes that certain non-GAAP performance measures and
ratios used in managing the business may provide users of this financial information additional meaningful comparisons between current results and results in prior operating periods. Management
believes that these non-GAAP measures can provide additional meaningful reflection of underlying trends of the business because they provide a comparison of historical information that excludes
certain items that impact the overall comparability due to the fact that these items do not represent results from the fundamental operations of the Company. See the Table below for supplemental
financial data and corresponding reconciliations to GAAP financial measures for the six months ended July 1, 2005 and July 2, 2004. Non-GAAP financial measures should be viewed in addition to, and
not as an alternative for, the Company’s reported results prepared in accordance with GAAP.


                                                                           THE COCA-COLA COMPANY AND SUBSIDIARIES
                                                                        Reconciliation of GAAP to Non-GAAP Financial Measures
                                                                                 Operating Income (Loss), by Segment

                                                                                                 (UNAUDITED)
                                                                                                  (In Millions)

                                                                                                                                                                                      % Change -
                                                            Six Months Ended July 1, 2005                               Six Months Ended July 2, 2004
                                                                                                                                                                   % Change -            After
                                                                                                                                                                    Reported         Considering
                                                                                                                                 Items Impacting
                                                         Items Impacting Comparability                After                                              After       (GAAP)             Items
                                                                                                                                   Comparability
                                         Reported                                                 Considering       Reported                         Considering                     (Non-GAAP)
                                          (GAAP)                                                     Items           (GAAP)                             Items
                                                                                                  (Non-GAAP)                                         (Non-GAAP)
                                                                                                                                      Asset
                                                           Accelerated
                                                       Amortization of Stock-   HFCS Lawsuit                                       Write-downs
                                                       Based Compensation        Settlement


North America                                 $774                    $12                                   $786        $849                $18            $867         (9)               (9)
Africa                                          174                      3                                   177         155                                155        12                 14
East, South Asia and Pacific Rim                185                      3                                   188         223                                223        (17)              (16)
European Union                                1,206                      3                                 1,209        1,191                             1,191         1                 2
Latin America                                   583                      4                                   587         515                     6          521        13                 13
North Asia, Eurasia and Middle East             931                      3                                   934         862                     6          868         8                 8
Corporate                                      (522)                    22               ($42)              (542)        (541)               58            (483)        4                (12)
Consolidated                                 $3,331                   $50                ($42)            $3,339       $3,254               $88          $3,342         2                 (0)

Más contenido relacionado

Similar a coca cola Reconciliation of Q2 and YTD 2005 Non-GAAP Financial Measures

coca cola Reconciliation of Q1 2005 Non-GAAP Financial Measures
coca cola Reconciliation of Q1 2005 Non-GAAP Financial Measures coca cola Reconciliation of Q1 2005 Non-GAAP Financial Measures
coca cola Reconciliation of Q1 2005 Non-GAAP Financial Measures finance9
 
coca cola Reconciliation of Q3 and YTD 2005 Non-GAAP Financial Measures
coca cola Reconciliation of Q3 and YTD 2005 Non-GAAP Financial Measurescoca cola Reconciliation of Q3 and YTD 2005 Non-GAAP Financial Measures
coca cola Reconciliation of Q3 and YTD 2005 Non-GAAP Financial Measuresfinance9
 
coca cola Reconciliation of Q2 and YTD 2004 Non-GAAP Financial Measures
coca cola Reconciliation of Q2 and YTD 2004 Non-GAAP Financial Measurescoca cola Reconciliation of Q2 and YTD 2004 Non-GAAP Financial Measures
coca cola Reconciliation of Q2 and YTD 2004 Non-GAAP Financial Measuresfinance9
 
coca cola Reconciliation of Q3 2003 Non-GAAP Financial Measures
coca cola Reconciliation of Q3 2003 Non-GAAP Financial Measurescoca cola Reconciliation of Q3 2003 Non-GAAP Financial Measures
coca cola Reconciliation of Q3 2003 Non-GAAP Financial Measuresfinance9
 
coca cola Apr 21, 2004 Reconciliation of Q1 2004 Non-GAAP Financial Measures
coca cola Apr 21, 2004	Reconciliation of Q1 2004 Non-GAAP Financial Measurescoca cola Apr 21, 2004	Reconciliation of Q1 2004 Non-GAAP Financial Measures
coca cola Apr 21, 2004 Reconciliation of Q1 2004 Non-GAAP Financial Measuresfinance9
 
coca cola Reconciliation of YTD 2003 Non-GAAP Financial Measure
coca cola  	Reconciliation of YTD 2003 Non-GAAP Financial Measurecoca cola  	Reconciliation of YTD 2003 Non-GAAP Financial Measure
coca cola Reconciliation of YTD 2003 Non-GAAP Financial Measurefinance9
 
coca cola Reconciliation of Q3 & YTD 2004 Non-GAAP Financial Measures
coca cola Reconciliation of Q3 & YTD 2004 Non-GAAP Financial Measurescoca cola Reconciliation of Q3 & YTD 2004 Non-GAAP Financial Measures
coca cola Reconciliation of Q3 & YTD 2004 Non-GAAP Financial Measuresfinance9
 
coca cola Reconciliation of Q3 & YTD 2004 Segment Operating Income
coca cola Reconciliation of Q3 & YTD 2004 Segment Operating Incomecoca cola Reconciliation of Q3 & YTD 2004 Segment Operating Income
coca cola Reconciliation of Q3 & YTD 2004 Segment Operating Incomefinance9
 
coca cola Reconciliation of YTD 2003 Non-GAAP Financial Measures
coca cola Reconciliation of YTD 2003 Non-GAAP Financial Measurescoca cola Reconciliation of YTD 2003 Non-GAAP Financial Measures
coca cola Reconciliation of YTD 2003 Non-GAAP Financial Measuresfinance9
 
coca cola Reconciliation of Q1 2003 Non-GAAP Financial Measures
coca cola Reconciliation of Q1 2003 Non-GAAP Financial Measurescoca cola Reconciliation of Q1 2003 Non-GAAP Financial Measures
coca cola Reconciliation of Q1 2003 Non-GAAP Financial Measuresfinance9
 
coca cola Reconciliation of Q2 2003 Non-GAAP Financial Measures
coca cola Reconciliation of Q2 2003 Non-GAAP Financial Measurescoca cola Reconciliation of Q2 2003 Non-GAAP Financial Measures
coca cola Reconciliation of Q2 2003 Non-GAAP Financial Measuresfinance9
 
coca cola Reconciliation of Q3 and YTD 2006 Non-GAAP Financial Measures
coca cola Reconciliation of Q3 and YTD 2006 Non-GAAP Financial Measurescoca cola Reconciliation of Q3 and YTD 2006 Non-GAAP Financial Measures
coca cola Reconciliation of Q3 and YTD 2006 Non-GAAP Financial Measuresfinance9
 
coca cola Reconciliation of Q4 and Full Year 2005 Non-GAAP Financial Measures
coca cola Reconciliation of Q4 and Full Year 2005 Non-GAAP Financial Measurescoca cola Reconciliation of Q4 and Full Year 2005 Non-GAAP Financial Measures
coca cola Reconciliation of Q4 and Full Year 2005 Non-GAAP Financial Measuresfinance9
 
coca cola Reconciliation of Q1 2006 Non-GAAP Financial Measures
coca cola Reconciliation of Q1 2006 Non-GAAP Financial Measurescoca cola Reconciliation of Q1 2006 Non-GAAP Financial Measures
coca cola Reconciliation of Q1 2006 Non-GAAP Financial Measuresfinance9
 
coca cola Reconciliation of Non-GAAP Financial Measures for 2008 Beverage D...
coca cola  	Reconciliation of Non-GAAP Financial Measures for 2008 Beverage D...coca cola  	Reconciliation of Non-GAAP Financial Measures for 2008 Beverage D...
coca cola Reconciliation of Non-GAAP Financial Measures for 2008 Beverage D...finance9
 
coca cola Reconciliation of Non-GAAP Financial Measures for 2008 Lehman Broth...
coca cola Reconciliation of Non-GAAP Financial Measures for 2008 Lehman Broth...coca cola Reconciliation of Non-GAAP Financial Measures for 2008 Lehman Broth...
coca cola Reconciliation of Non-GAAP Financial Measures for 2008 Lehman Broth...finance9
 
Analyst%20 Metrics 2012 Q2 Final
Analyst%20 Metrics 2012 Q2 FinalAnalyst%20 Metrics 2012 Q2 Final
Analyst%20 Metrics 2012 Q2 FinalVishal Shah
 
coca cola Reconciliation of Q3 and YTD 2007 Non-GAAP Financial Measures
coca cola Reconciliation of Q3 and YTD 2007 Non-GAAP Financial Measurescoca cola Reconciliation of Q3 and YTD 2007 Non-GAAP Financial Measures
coca cola Reconciliation of Q3 and YTD 2007 Non-GAAP Financial Measuresfinance9
 
Enterprise value map_2_0
Enterprise value map_2_0Enterprise value map_2_0
Enterprise value map_2_0AM&AA
 
coca cola Reconciliation of Q3 and YTD 2008 Non-GAAP financial measures
coca cola Reconciliation of Q3 and YTD 2008 Non-GAAP financial measurescoca cola Reconciliation of Q3 and YTD 2008 Non-GAAP financial measures
coca cola Reconciliation of Q3 and YTD 2008 Non-GAAP financial measuresfinance9
 

Similar a coca cola Reconciliation of Q2 and YTD 2005 Non-GAAP Financial Measures (20)

coca cola Reconciliation of Q1 2005 Non-GAAP Financial Measures
coca cola Reconciliation of Q1 2005 Non-GAAP Financial Measures coca cola Reconciliation of Q1 2005 Non-GAAP Financial Measures
coca cola Reconciliation of Q1 2005 Non-GAAP Financial Measures
 
coca cola Reconciliation of Q3 and YTD 2005 Non-GAAP Financial Measures
coca cola Reconciliation of Q3 and YTD 2005 Non-GAAP Financial Measurescoca cola Reconciliation of Q3 and YTD 2005 Non-GAAP Financial Measures
coca cola Reconciliation of Q3 and YTD 2005 Non-GAAP Financial Measures
 
coca cola Reconciliation of Q2 and YTD 2004 Non-GAAP Financial Measures
coca cola Reconciliation of Q2 and YTD 2004 Non-GAAP Financial Measurescoca cola Reconciliation of Q2 and YTD 2004 Non-GAAP Financial Measures
coca cola Reconciliation of Q2 and YTD 2004 Non-GAAP Financial Measures
 
coca cola Reconciliation of Q3 2003 Non-GAAP Financial Measures
coca cola Reconciliation of Q3 2003 Non-GAAP Financial Measurescoca cola Reconciliation of Q3 2003 Non-GAAP Financial Measures
coca cola Reconciliation of Q3 2003 Non-GAAP Financial Measures
 
coca cola Apr 21, 2004 Reconciliation of Q1 2004 Non-GAAP Financial Measures
coca cola Apr 21, 2004	Reconciliation of Q1 2004 Non-GAAP Financial Measurescoca cola Apr 21, 2004	Reconciliation of Q1 2004 Non-GAAP Financial Measures
coca cola Apr 21, 2004 Reconciliation of Q1 2004 Non-GAAP Financial Measures
 
coca cola Reconciliation of YTD 2003 Non-GAAP Financial Measure
coca cola  	Reconciliation of YTD 2003 Non-GAAP Financial Measurecoca cola  	Reconciliation of YTD 2003 Non-GAAP Financial Measure
coca cola Reconciliation of YTD 2003 Non-GAAP Financial Measure
 
coca cola Reconciliation of Q3 & YTD 2004 Non-GAAP Financial Measures
coca cola Reconciliation of Q3 & YTD 2004 Non-GAAP Financial Measurescoca cola Reconciliation of Q3 & YTD 2004 Non-GAAP Financial Measures
coca cola Reconciliation of Q3 & YTD 2004 Non-GAAP Financial Measures
 
coca cola Reconciliation of Q3 & YTD 2004 Segment Operating Income
coca cola Reconciliation of Q3 & YTD 2004 Segment Operating Incomecoca cola Reconciliation of Q3 & YTD 2004 Segment Operating Income
coca cola Reconciliation of Q3 & YTD 2004 Segment Operating Income
 
coca cola Reconciliation of YTD 2003 Non-GAAP Financial Measures
coca cola Reconciliation of YTD 2003 Non-GAAP Financial Measurescoca cola Reconciliation of YTD 2003 Non-GAAP Financial Measures
coca cola Reconciliation of YTD 2003 Non-GAAP Financial Measures
 
coca cola Reconciliation of Q1 2003 Non-GAAP Financial Measures
coca cola Reconciliation of Q1 2003 Non-GAAP Financial Measurescoca cola Reconciliation of Q1 2003 Non-GAAP Financial Measures
coca cola Reconciliation of Q1 2003 Non-GAAP Financial Measures
 
coca cola Reconciliation of Q2 2003 Non-GAAP Financial Measures
coca cola Reconciliation of Q2 2003 Non-GAAP Financial Measurescoca cola Reconciliation of Q2 2003 Non-GAAP Financial Measures
coca cola Reconciliation of Q2 2003 Non-GAAP Financial Measures
 
coca cola Reconciliation of Q3 and YTD 2006 Non-GAAP Financial Measures
coca cola Reconciliation of Q3 and YTD 2006 Non-GAAP Financial Measurescoca cola Reconciliation of Q3 and YTD 2006 Non-GAAP Financial Measures
coca cola Reconciliation of Q3 and YTD 2006 Non-GAAP Financial Measures
 
coca cola Reconciliation of Q4 and Full Year 2005 Non-GAAP Financial Measures
coca cola Reconciliation of Q4 and Full Year 2005 Non-GAAP Financial Measurescoca cola Reconciliation of Q4 and Full Year 2005 Non-GAAP Financial Measures
coca cola Reconciliation of Q4 and Full Year 2005 Non-GAAP Financial Measures
 
coca cola Reconciliation of Q1 2006 Non-GAAP Financial Measures
coca cola Reconciliation of Q1 2006 Non-GAAP Financial Measurescoca cola Reconciliation of Q1 2006 Non-GAAP Financial Measures
coca cola Reconciliation of Q1 2006 Non-GAAP Financial Measures
 
coca cola Reconciliation of Non-GAAP Financial Measures for 2008 Beverage D...
coca cola  	Reconciliation of Non-GAAP Financial Measures for 2008 Beverage D...coca cola  	Reconciliation of Non-GAAP Financial Measures for 2008 Beverage D...
coca cola Reconciliation of Non-GAAP Financial Measures for 2008 Beverage D...
 
coca cola Reconciliation of Non-GAAP Financial Measures for 2008 Lehman Broth...
coca cola Reconciliation of Non-GAAP Financial Measures for 2008 Lehman Broth...coca cola Reconciliation of Non-GAAP Financial Measures for 2008 Lehman Broth...
coca cola Reconciliation of Non-GAAP Financial Measures for 2008 Lehman Broth...
 
Analyst%20 Metrics 2012 Q2 Final
Analyst%20 Metrics 2012 Q2 FinalAnalyst%20 Metrics 2012 Q2 Final
Analyst%20 Metrics 2012 Q2 Final
 
coca cola Reconciliation of Q3 and YTD 2007 Non-GAAP Financial Measures
coca cola Reconciliation of Q3 and YTD 2007 Non-GAAP Financial Measurescoca cola Reconciliation of Q3 and YTD 2007 Non-GAAP Financial Measures
coca cola Reconciliation of Q3 and YTD 2007 Non-GAAP Financial Measures
 
Enterprise value map_2_0
Enterprise value map_2_0Enterprise value map_2_0
Enterprise value map_2_0
 
coca cola Reconciliation of Q3 and YTD 2008 Non-GAAP financial measures
coca cola Reconciliation of Q3 and YTD 2008 Non-GAAP financial measurescoca cola Reconciliation of Q3 and YTD 2008 Non-GAAP financial measures
coca cola Reconciliation of Q3 and YTD 2008 Non-GAAP financial measures
 

Más de finance9

enterprise gp holdings Organizational and Ownership Structure Chart
enterprise gp holdings  Organizational and Ownership Structure Chart enterprise gp holdings  Organizational and Ownership Structure Chart
enterprise gp holdings Organizational and Ownership Structure Chart finance9
 
enterprise gp holdings Standards of Business Conduct
enterprise gp holdings Standards of Business Conductenterprise gp holdings Standards of Business Conduct
enterprise gp holdings Standards of Business Conductfinance9
 
enterprise gp holdings Governance Guidelines
enterprise gp holdings Governance Guidelinesenterprise gp holdings Governance Guidelines
enterprise gp holdings Governance Guidelinesfinance9
 
enterprise gp holdings Audit, Conflicts & Governance Committee
enterprise gp holdings Audit, Conflicts & Governance Committeeenterprise gp holdings Audit, Conflicts & Governance Committee
enterprise gp holdings Audit, Conflicts & Governance Committeefinance9
 
enterprise gp holdings Code of Conduct & Related Policies
enterprise gp holdings Code of Conduct & Related Policiesenterprise gp holdings Code of Conduct & Related Policies
enterprise gp holdings Code of Conduct & Related Policiesfinance9
 
02/11/09 HCA Announces Offering of $300 Million Senior Secured Second Lien Notes
02/11/09 HCA Announces Offering of $300 Million Senior Secured Second Lien Notes02/11/09 HCA Announces Offering of $300 Million Senior Secured Second Lien Notes
02/11/09 HCA Announces Offering of $300 Million Senior Secured Second Lien Notesfinance9
 
hca annual reports2000
hca annual reports2000hca annual reports2000
hca annual reports2000finance9
 
hca annual reports2001
hca annual reports2001hca annual reports2001
hca annual reports2001finance9
 
hca annual reports2002
hca annual reports2002hca annual reports2002
hca annual reports2002finance9
 
hca annual reports2003
hca annual reports2003hca annual reports2003
hca annual reports2003finance9
 
hca annual reports2004
hca annual reports2004hca annual reports2004
hca annual reports2004finance9
 
hca annual reports2005
hca annual reports2005hca annual reports2005
hca annual reports2005finance9
 
JP Morgan Presentation 15-Feb-2008
JP Morgan Presentation 15-Feb-2008JP Morgan Presentation 15-Feb-2008
JP Morgan Presentation 15-Feb-2008finance9
 
HCA Presents at Bank of America 2008 Credit Conference 20-Nov-2008
HCA Presents at Bank of America 2008 Credit Conference 20-Nov-2008HCA Presents at Bank of America 2008 Credit Conference 20-Nov-2008
HCA Presents at Bank of America 2008 Credit Conference 20-Nov-2008finance9
 
tyson foods 2007 Sustainability Report
tyson foods  2007 Sustainability Report tyson foods  2007 Sustainability Report
tyson foods 2007 Sustainability Report finance9
 
tyson foods Investor Fact Book
tyson foods Investor Fact Book tyson foods Investor Fact Book
tyson foods Investor Fact Book finance9
 
tyson foods 2008 Annual Report
tyson foods  2008 Annual Report tyson foods  2008 Annual Report
tyson foods 2008 Annual Report finance9
 
general dynamics 2008 Proxy Statement
general dynamics 2008 Proxy Statement	 general dynamics 2008 Proxy Statement
general dynamics 2008 Proxy Statement finance9
 
general dynamics 2007 Annual Report
general dynamics 2007 Annual Report	general dynamics 2007 Annual Report
general dynamics 2007 Annual Report finance9
 
general dynamics Restated Certificate of Incorporation
general dynamics Restated Certificate of Incorporation general dynamics Restated Certificate of Incorporation
general dynamics Restated Certificate of Incorporation finance9
 

Más de finance9 (20)

enterprise gp holdings Organizational and Ownership Structure Chart
enterprise gp holdings  Organizational and Ownership Structure Chart enterprise gp holdings  Organizational and Ownership Structure Chart
enterprise gp holdings Organizational and Ownership Structure Chart
 
enterprise gp holdings Standards of Business Conduct
enterprise gp holdings Standards of Business Conductenterprise gp holdings Standards of Business Conduct
enterprise gp holdings Standards of Business Conduct
 
enterprise gp holdings Governance Guidelines
enterprise gp holdings Governance Guidelinesenterprise gp holdings Governance Guidelines
enterprise gp holdings Governance Guidelines
 
enterprise gp holdings Audit, Conflicts & Governance Committee
enterprise gp holdings Audit, Conflicts & Governance Committeeenterprise gp holdings Audit, Conflicts & Governance Committee
enterprise gp holdings Audit, Conflicts & Governance Committee
 
enterprise gp holdings Code of Conduct & Related Policies
enterprise gp holdings Code of Conduct & Related Policiesenterprise gp holdings Code of Conduct & Related Policies
enterprise gp holdings Code of Conduct & Related Policies
 
02/11/09 HCA Announces Offering of $300 Million Senior Secured Second Lien Notes
02/11/09 HCA Announces Offering of $300 Million Senior Secured Second Lien Notes02/11/09 HCA Announces Offering of $300 Million Senior Secured Second Lien Notes
02/11/09 HCA Announces Offering of $300 Million Senior Secured Second Lien Notes
 
hca annual reports2000
hca annual reports2000hca annual reports2000
hca annual reports2000
 
hca annual reports2001
hca annual reports2001hca annual reports2001
hca annual reports2001
 
hca annual reports2002
hca annual reports2002hca annual reports2002
hca annual reports2002
 
hca annual reports2003
hca annual reports2003hca annual reports2003
hca annual reports2003
 
hca annual reports2004
hca annual reports2004hca annual reports2004
hca annual reports2004
 
hca annual reports2005
hca annual reports2005hca annual reports2005
hca annual reports2005
 
JP Morgan Presentation 15-Feb-2008
JP Morgan Presentation 15-Feb-2008JP Morgan Presentation 15-Feb-2008
JP Morgan Presentation 15-Feb-2008
 
HCA Presents at Bank of America 2008 Credit Conference 20-Nov-2008
HCA Presents at Bank of America 2008 Credit Conference 20-Nov-2008HCA Presents at Bank of America 2008 Credit Conference 20-Nov-2008
HCA Presents at Bank of America 2008 Credit Conference 20-Nov-2008
 
tyson foods 2007 Sustainability Report
tyson foods  2007 Sustainability Report tyson foods  2007 Sustainability Report
tyson foods 2007 Sustainability Report
 
tyson foods Investor Fact Book
tyson foods Investor Fact Book tyson foods Investor Fact Book
tyson foods Investor Fact Book
 
tyson foods 2008 Annual Report
tyson foods  2008 Annual Report tyson foods  2008 Annual Report
tyson foods 2008 Annual Report
 
general dynamics 2008 Proxy Statement
general dynamics 2008 Proxy Statement	 general dynamics 2008 Proxy Statement
general dynamics 2008 Proxy Statement
 
general dynamics 2007 Annual Report
general dynamics 2007 Annual Report	general dynamics 2007 Annual Report
general dynamics 2007 Annual Report
 
general dynamics Restated Certificate of Incorporation
general dynamics Restated Certificate of Incorporation general dynamics Restated Certificate of Incorporation
general dynamics Restated Certificate of Incorporation
 

Último

Famous Kala Jadu, Black magic expert in Faisalabad and Kala ilam specialist i...
Famous Kala Jadu, Black magic expert in Faisalabad and Kala ilam specialist i...Famous Kala Jadu, Black magic expert in Faisalabad and Kala ilam specialist i...
Famous Kala Jadu, Black magic expert in Faisalabad and Kala ilam specialist i...batoole333
 
Black magic specialist in Canada (Kala ilam specialist in UK) Bangali Amil ba...
Black magic specialist in Canada (Kala ilam specialist in UK) Bangali Amil ba...Black magic specialist in Canada (Kala ilam specialist in UK) Bangali Amil ba...
Black magic specialist in Canada (Kala ilam specialist in UK) Bangali Amil ba...batoole333
 
fundamentals of corporate finance 11th canadian edition test bank.docx
fundamentals of corporate finance 11th canadian edition test bank.docxfundamentals of corporate finance 11th canadian edition test bank.docx
fundamentals of corporate finance 11th canadian edition test bank.docxssuserf63bd7
 
Pension dashboards forum 1 May 2024 (1).pdf
Pension dashboards forum 1 May 2024 (1).pdfPension dashboards forum 1 May 2024 (1).pdf
Pension dashboards forum 1 May 2024 (1).pdfHenry Tapper
 
Strategic Resources May 2024 Corporate Presentation
Strategic Resources May 2024 Corporate PresentationStrategic Resources May 2024 Corporate Presentation
Strategic Resources May 2024 Corporate PresentationAdnet Communications
 
Law of Demand.pptxnnnnnnnnnnnnnnnnnnnnnnnnnnnnnnnnnnnnnnnnnnn
Law of Demand.pptxnnnnnnnnnnnnnnnnnnnnnnnnnnnnnnnnnnnnnnnnnnnLaw of Demand.pptxnnnnnnnnnnnnnnnnnnnnnnnnnnnnnnnnnnnnnnnnnnn
Law of Demand.pptxnnnnnnnnnnnnnnnnnnnnnnnnnnnnnnnnnnnnnnnnnnnTintoTom3
 
abortion pills in Riyadh Saudi Arabia (+919707899604)cytotec pills in dammam
abortion pills in Riyadh Saudi Arabia (+919707899604)cytotec pills in dammamabortion pills in Riyadh Saudi Arabia (+919707899604)cytotec pills in dammam
abortion pills in Riyadh Saudi Arabia (+919707899604)cytotec pills in dammamsamsungultra782445
 
Collecting banker, Capacity of collecting Banker, conditions under section 13...
Collecting banker, Capacity of collecting Banker, conditions under section 13...Collecting banker, Capacity of collecting Banker, conditions under section 13...
Collecting banker, Capacity of collecting Banker, conditions under section 13...RaniT11
 
In Sharjah ௵(+971)558539980 *_௵abortion pills now available.
In Sharjah ௵(+971)558539980 *_௵abortion pills now available.In Sharjah ௵(+971)558539980 *_௵abortion pills now available.
In Sharjah ௵(+971)558539980 *_௵abortion pills now available.hyt3577
 
FE Credit and SMBC Acquisition Case Studies
FE Credit and SMBC Acquisition Case StudiesFE Credit and SMBC Acquisition Case Studies
FE Credit and SMBC Acquisition Case StudiesNghiaPham100
 
Call Girls Howrah ( 8250092165 ) Cheap rates call girls | Get low budget
Call Girls Howrah ( 8250092165 ) Cheap rates call girls | Get low budgetCall Girls Howrah ( 8250092165 ) Cheap rates call girls | Get low budget
Call Girls Howrah ( 8250092165 ) Cheap rates call girls | Get low budgetSareena Khatun
 
劳伦森大学毕业证
劳伦森大学毕业证劳伦森大学毕业证
劳伦森大学毕业证yyawb
 
uk-no 1 kala ilam expert specialist in uk and qatar kala ilam expert speciali...
uk-no 1 kala ilam expert specialist in uk and qatar kala ilam expert speciali...uk-no 1 kala ilam expert specialist in uk and qatar kala ilam expert speciali...
uk-no 1 kala ilam expert specialist in uk and qatar kala ilam expert speciali...batoole333
 
Famous No1 Amil Baba Love marriage Astrologer Specialist Expert In Pakistan a...
Famous No1 Amil Baba Love marriage Astrologer Specialist Expert In Pakistan a...Famous No1 Amil Baba Love marriage Astrologer Specialist Expert In Pakistan a...
Famous No1 Amil Baba Love marriage Astrologer Specialist Expert In Pakistan a...janibaber266
 
Stock Market Brief Deck (Under Pressure).pdf
Stock Market Brief Deck (Under Pressure).pdfStock Market Brief Deck (Under Pressure).pdf
Stock Market Brief Deck (Under Pressure).pdfMichael Silva
 
Bhubaneswar🌹Ravi Tailkes ❤CALL GIRLS 9777949614 💟 CALL GIRLS IN bhubaneswar ...
Bhubaneswar🌹Ravi Tailkes  ❤CALL GIRLS 9777949614 💟 CALL GIRLS IN bhubaneswar ...Bhubaneswar🌹Ravi Tailkes  ❤CALL GIRLS 9777949614 💟 CALL GIRLS IN bhubaneswar ...
Bhubaneswar🌹Ravi Tailkes ❤CALL GIRLS 9777949614 💟 CALL GIRLS IN bhubaneswar ...Call Girls Mumbai
 
Toronto dominion bank investor presentation.pdf
Toronto dominion bank investor presentation.pdfToronto dominion bank investor presentation.pdf
Toronto dominion bank investor presentation.pdfJinJiang6
 
abortion pills in Jeddah Saudi Arabia (+919707899604)cytotec pills in Riyadh
abortion pills in Jeddah Saudi Arabia (+919707899604)cytotec pills in Riyadhabortion pills in Jeddah Saudi Arabia (+919707899604)cytotec pills in Riyadh
abortion pills in Jeddah Saudi Arabia (+919707899604)cytotec pills in Riyadhsamsungultra782445
 
Lion One Corporate Presentation May 2024
Lion One Corporate Presentation May 2024Lion One Corporate Presentation May 2024
Lion One Corporate Presentation May 2024Adnet Communications
 
Significant AI Trends for the Financial Industry in 2024 and How to Utilize Them
Significant AI Trends for the Financial Industry in 2024 and How to Utilize ThemSignificant AI Trends for the Financial Industry in 2024 and How to Utilize Them
Significant AI Trends for the Financial Industry in 2024 and How to Utilize Them360factors
 

Último (20)

Famous Kala Jadu, Black magic expert in Faisalabad and Kala ilam specialist i...
Famous Kala Jadu, Black magic expert in Faisalabad and Kala ilam specialist i...Famous Kala Jadu, Black magic expert in Faisalabad and Kala ilam specialist i...
Famous Kala Jadu, Black magic expert in Faisalabad and Kala ilam specialist i...
 
Black magic specialist in Canada (Kala ilam specialist in UK) Bangali Amil ba...
Black magic specialist in Canada (Kala ilam specialist in UK) Bangali Amil ba...Black magic specialist in Canada (Kala ilam specialist in UK) Bangali Amil ba...
Black magic specialist in Canada (Kala ilam specialist in UK) Bangali Amil ba...
 
fundamentals of corporate finance 11th canadian edition test bank.docx
fundamentals of corporate finance 11th canadian edition test bank.docxfundamentals of corporate finance 11th canadian edition test bank.docx
fundamentals of corporate finance 11th canadian edition test bank.docx
 
Pension dashboards forum 1 May 2024 (1).pdf
Pension dashboards forum 1 May 2024 (1).pdfPension dashboards forum 1 May 2024 (1).pdf
Pension dashboards forum 1 May 2024 (1).pdf
 
Strategic Resources May 2024 Corporate Presentation
Strategic Resources May 2024 Corporate PresentationStrategic Resources May 2024 Corporate Presentation
Strategic Resources May 2024 Corporate Presentation
 
Law of Demand.pptxnnnnnnnnnnnnnnnnnnnnnnnnnnnnnnnnnnnnnnnnnnn
Law of Demand.pptxnnnnnnnnnnnnnnnnnnnnnnnnnnnnnnnnnnnnnnnnnnnLaw of Demand.pptxnnnnnnnnnnnnnnnnnnnnnnnnnnnnnnnnnnnnnnnnnnn
Law of Demand.pptxnnnnnnnnnnnnnnnnnnnnnnnnnnnnnnnnnnnnnnnnnnn
 
abortion pills in Riyadh Saudi Arabia (+919707899604)cytotec pills in dammam
abortion pills in Riyadh Saudi Arabia (+919707899604)cytotec pills in dammamabortion pills in Riyadh Saudi Arabia (+919707899604)cytotec pills in dammam
abortion pills in Riyadh Saudi Arabia (+919707899604)cytotec pills in dammam
 
Collecting banker, Capacity of collecting Banker, conditions under section 13...
Collecting banker, Capacity of collecting Banker, conditions under section 13...Collecting banker, Capacity of collecting Banker, conditions under section 13...
Collecting banker, Capacity of collecting Banker, conditions under section 13...
 
In Sharjah ௵(+971)558539980 *_௵abortion pills now available.
In Sharjah ௵(+971)558539980 *_௵abortion pills now available.In Sharjah ௵(+971)558539980 *_௵abortion pills now available.
In Sharjah ௵(+971)558539980 *_௵abortion pills now available.
 
FE Credit and SMBC Acquisition Case Studies
FE Credit and SMBC Acquisition Case StudiesFE Credit and SMBC Acquisition Case Studies
FE Credit and SMBC Acquisition Case Studies
 
Call Girls Howrah ( 8250092165 ) Cheap rates call girls | Get low budget
Call Girls Howrah ( 8250092165 ) Cheap rates call girls | Get low budgetCall Girls Howrah ( 8250092165 ) Cheap rates call girls | Get low budget
Call Girls Howrah ( 8250092165 ) Cheap rates call girls | Get low budget
 
劳伦森大学毕业证
劳伦森大学毕业证劳伦森大学毕业证
劳伦森大学毕业证
 
uk-no 1 kala ilam expert specialist in uk and qatar kala ilam expert speciali...
uk-no 1 kala ilam expert specialist in uk and qatar kala ilam expert speciali...uk-no 1 kala ilam expert specialist in uk and qatar kala ilam expert speciali...
uk-no 1 kala ilam expert specialist in uk and qatar kala ilam expert speciali...
 
Famous No1 Amil Baba Love marriage Astrologer Specialist Expert In Pakistan a...
Famous No1 Amil Baba Love marriage Astrologer Specialist Expert In Pakistan a...Famous No1 Amil Baba Love marriage Astrologer Specialist Expert In Pakistan a...
Famous No1 Amil Baba Love marriage Astrologer Specialist Expert In Pakistan a...
 
Stock Market Brief Deck (Under Pressure).pdf
Stock Market Brief Deck (Under Pressure).pdfStock Market Brief Deck (Under Pressure).pdf
Stock Market Brief Deck (Under Pressure).pdf
 
Bhubaneswar🌹Ravi Tailkes ❤CALL GIRLS 9777949614 💟 CALL GIRLS IN bhubaneswar ...
Bhubaneswar🌹Ravi Tailkes  ❤CALL GIRLS 9777949614 💟 CALL GIRLS IN bhubaneswar ...Bhubaneswar🌹Ravi Tailkes  ❤CALL GIRLS 9777949614 💟 CALL GIRLS IN bhubaneswar ...
Bhubaneswar🌹Ravi Tailkes ❤CALL GIRLS 9777949614 💟 CALL GIRLS IN bhubaneswar ...
 
Toronto dominion bank investor presentation.pdf
Toronto dominion bank investor presentation.pdfToronto dominion bank investor presentation.pdf
Toronto dominion bank investor presentation.pdf
 
abortion pills in Jeddah Saudi Arabia (+919707899604)cytotec pills in Riyadh
abortion pills in Jeddah Saudi Arabia (+919707899604)cytotec pills in Riyadhabortion pills in Jeddah Saudi Arabia (+919707899604)cytotec pills in Riyadh
abortion pills in Jeddah Saudi Arabia (+919707899604)cytotec pills in Riyadh
 
Lion One Corporate Presentation May 2024
Lion One Corporate Presentation May 2024Lion One Corporate Presentation May 2024
Lion One Corporate Presentation May 2024
 
Significant AI Trends for the Financial Industry in 2024 and How to Utilize Them
Significant AI Trends for the Financial Industry in 2024 and How to Utilize ThemSignificant AI Trends for the Financial Industry in 2024 and How to Utilize Them
Significant AI Trends for the Financial Industry in 2024 and How to Utilize Them
 

coca cola Reconciliation of Q2 and YTD 2005 Non-GAAP Financial Measures

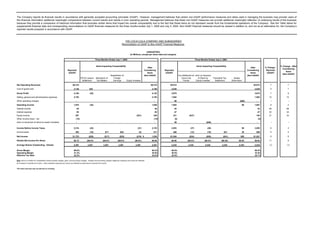
  • 1. The Company reports its financial results in accordance with generally accepted accounting principles (GAAP). However, management believes that certain non-GAAP performance measures and ratios used in managing the business may provide users of this financial information additional meaningful comparisons between current results and results in prior operating periods. Management believes that these non-GAAP measures can provide additional meaningful reflection of underlying trends of the business because they provide a comparison of historical information that excludes certain items that impact the overall comparability due to the fact that these items do not represent results from the fundamental operations of the Company. See the Table below for supplemental financial data and corresponding reconciliations to GAAP financial measures for the three months ended July 1, 2005 and July 2, 2004. Non-GAAP financial measures should be viewed in addition to, and not as an alternative for, the Company’s reported results prepared in accordance with GAAP. THE COCA-COLA COMPANY AND SUBSIDIARIES Reconciliation of GAAP to Non-GAAP Financial Measures (UNAUDITED) (In Millions, except per share data and margins) Three Months Ended July 1, 2005 Three Months Ended July 2, 2004 Items Impacting Comparability Items Impacting Comparability % Change - After % Change - After After Considering Reported Reported Considering Reported Considering Items (GAAP) (GAAP) Items (GAAP) Items (Non-GAAP) (Non-GAAP) (Non-GAAP) Repatriation of Tax Settlement at Gain on Issuance HFCS Lawsuit Resolution of Foreign Coca-Cola of Stock by Favorable Tax Assets Settlement Tax Matters Earnings Equity Investee Femsa Equity Investee Settlement Write-down Net Operating Revenues $6,310 $6,310 $5,914 $5,914 7 7 Cost of goods sold 2,146 $42 2,188 2,039 2,039 5 7 Gross Profit 4,164 (42) 4,122 3,875 3,875 7 6 Selling, general and administrative expenses 2,192 2,192 1,984 1,984 10 10 Other operating charges - - 88 ($88) - -- -- Operating Income 1,972 (42) 1,930 1,803 88 1,891 9 2 Interest income 54 54 32 32 69 69 Interest expense 62 62 47 47 32 32 Equity income 267 ($21) 246 221 ($37) 184 21 34 Other income (loss) - net (15) (15) (5) (5) Gain on issuances of stock by equity investees - - 49 ($49) - -- -- Income Before Income Taxes 2,216 (42) (21) 2,153 2,053 (37) (49) 88 2,055 8 5 Income taxes 493 (16) $17 $25 (2) 517 469 (13) (19) $41 30 508 5 2 Net Income $1,723 ($26) ($17) ($25) ($19) $ 1,636 $1,584 ($24) ($30) ($41) $58 $1,547 9 6 Diluted Net Income Per Share $0.72 ($0.01) ($0.01) ($0.01) ($0.01) $0.68 $0.65 ($0.01) ($0.01) ($0.02) $0.02 $0.64 * 11 6 Average Shares Outstanding - Diluted 2,401 2,401 2,401 2,401 2,401 2,401 2,434 2,434 2,434 2,434 2,434 2,434 (1) (1) Gross Margin 66.0% 65.3% 65.5% 65.5% Operating Margin 31.3% 30.6% 30.5% 32.0% Effective Tax Rate 22.2% 24.0% 22.8% 24.7% Note: Items to consider for comparability include primarily charges, gains, and accounting changes. Charges and accounting changes negatively impacting net income are reflected as increases to reported net income. Gains positively impacting net income are reflected as deductions to reported net income. *Per share amounts may not add due to rounding.
  • 2. The Company reports its financial results in accordance with generally accepted accounting principles (GAAP). However, management believes that certain non-GAAP performance measures and ratios used in managing the business may provide users of this financial information additional meaningful comparisons between current results and results in prior operating periods. Management believes that these non-GAAP measures can provide additional meaningful reflection of underlying trends of the business because they provide a comparison of historical information that excludes certain items that impact the overall comparability due to the fact that these items do not represent results from the fundamental operations of the Company. See the Table below for supplemental financial data and corresponding reconciliations to GAAP financial measures for the six months ended Junly 1, 2005 and July 2, 2004. Non-GAAP financial measures should be viewed in addition to, and not as an alternative for, the Company’s reported results prepared in accordance with GAAP. THE COCA-COLA COMPANY AND SUBSIDIARIES Reconciliation of GAAP to Non-GAAP Financial Measures (UNAUDITED) (In Millions, except per share data and margins) Six Months Ended July 1, 2005 Six Months Ended July 2, 2004 % Change - Items Impacting Comparability Items Impacting Comparability % Change - After After After Reported Considering Reported Considering Reported Considering (GAAP) Items (GAAP) Items (GAAP) Items Accelerated (Non-GAAP) (Non-GAAP) (Non-GAAP) Repatriation of Issuances of Amortization of Tax Settlement at Gain on Issuance HFCS Resolution of Foreign Stock by Equity Stock-Based Coca-Cola of Stock by Favorable Tax Assets Settlement Tax Matters Earnings Investees Compensation Equity Investee Femsa Equity Investee Settlement Write-down Net Operating Revenues $11,516 $11,516 $10,942 $10,942 5 5 Cost of goods sold 3,964 $42 4,006 3,800 3,800 4 5 Gross Profit 7,552 (42) 7,510 7,142 7,142 6 5 Selling, general and administrative expenses 4,221 ($50) 4,171 3,800 3,800 11 10 Other operating charges - - 88 ($88) - -- -- Operating Income 3,331 (42) 50 3,339 3,254 88 3,342 2 (0) Interest income 114 114 67 67 70 70 Interest expense 130 130 91 91 43 43 Equity income 358 ($21) 337 316 ($37) 279 13 21 Other income (loss) - net (32) (32) (30) (30) Gain on issuances of stock by equity investees 23 (23) - 49 ($49) - -- -- Income Before Income Taxes 3,664 (42) (23) 50 (21) 3,628 3,565 (37) (49) 88 3,567 3 2 Income taxes 939 (16) $73 ($127) ($8) 12 (2) 871 854 (13) (19) $41 30 893 10 (2) Net Income $2,725 ($26) ($73) $127 ($15) $38 ($19) $ 2,757 $2,711 ($24) ($30) ($41) $58 $2,674 1 3 Diluted Net Income Per Share $1.13 ($0.01) ($0.03) $0.05 ($0.01) $0.02 ($0.01) $1.15 * $1.11 ($0.01) ($0.01) ($0.02) $0.02 $1.10 * 2 5 Average Shares Outstanding - Diluted 2,405 2,405 2,405 2,405 2,405 2,405 2,405 2,405 2,439 2,439 2,439 2,439 2,439 2,439 (1) (1) Gross Margin 65.6% 65.2% 65.3% 65.3% Operating Margin 28.9% 29.0% 29.7% 30.5% Effective Tax Rate 25.6% 24.0% 24.0% 25.0% Note: Items to consider for comparability include primarily charges, gains, and accounting changes. Charges and accounting changes negatively impacting net income are reflected as increases to reported net income. Gains positively impacting net income are reflected as deductions to reported net income. *Per share amounts may not add due to rounding.
  • 3. The Company reports its financial results in accordance with generally accepted accounting principles (GAAP). However, management believes that certain non-GAAP performance measures and ratios used in managing the business may provide users of this financial information additional meaningful comparisons between current results and results in prior operating periods. Management believes that these non-GAAP measures can provide additional meaningful reflection of underlying trends of the business because they provide a comparison of historical information that excludes certain items that impact the overall comparability due to the fact that these items do not represent results from the fundamental operations of the Company. See the Table below for supplemental financial data and corresponding reconciliations to GAAP financial measures for the three months ended July 1, 2005 and July 2, 2004. Non-GAAP financial measures should be viewed in addition to, and not as an alternative for, the Company’s reported results prepared in accordance with GAAP. THE COCA-COLA COMPANY AND SUBSIDIARIES Reconciliation of GAAP to Non-GAAP Financial Measures Operating Income (Loss), by Segment (UNAUDITED) (In Millions) Three Months Ended July 1, 2005 Three Months Ended July 2, 2004 % Change - % Change - After Reported Considering Items Impacting Items Impacting After After (GAAP) Items Comparability Comparability Reported Considering Reported Considering (Non-GAAP) (GAAP) Items (GAAP) Items (Non-GAAP) (Non-GAAP) Asset HFCS Lawsuit Write-downs Settlement North America $461 $461 $496 $18 $514 (7) (10) Africa 86 86 73 73 18 18 East, South Asia and Pacific Rim 125 125 131 131 (5) (5) European Union 711 711 647 647 10 10 Latin America 303 303 253 6 259 20 17 North Asia, Eurasia and Middle East 533 533 496 6 502 7 6 Corporate (247) ($42) (289) (293) 58 (235) 16 (23) Consolidated $1,972 ($42) $1,930 $1,803 $88 $1,891 9 2
  • 4. The Company reports its financial results in accordance with generally accepted accounting principles (GAAP). However, management believes that certain non-GAAP performance measures and ratios used in managing the business may provide users of this financial information additional meaningful comparisons between current results and results in prior operating periods. Management believes that these non-GAAP measures can provide additional meaningful reflection of underlying trends of the business because they provide a comparison of historical information that excludes certain items that impact the overall comparability due to the fact that these items do not represent results from the fundamental operations of the Company. See the Table below for supplemental financial data and corresponding reconciliations to GAAP financial measures for the six months ended July 1, 2005 and July 2, 2004. Non-GAAP financial measures should be viewed in addition to, and not as an alternative for, the Company’s reported results prepared in accordance with GAAP. THE COCA-COLA COMPANY AND SUBSIDIARIES Reconciliation of GAAP to Non-GAAP Financial Measures Operating Income (Loss), by Segment (UNAUDITED) (In Millions) % Change - Six Months Ended July 1, 2005 Six Months Ended July 2, 2004 % Change - After Reported Considering Items Impacting Items Impacting Comparability After After (GAAP) Items Comparability Reported Considering Reported Considering (Non-GAAP) (GAAP) Items (GAAP) Items (Non-GAAP) (Non-GAAP) Asset Accelerated Amortization of Stock- HFCS Lawsuit Write-downs Based Compensation Settlement North America $774 $12 $786 $849 $18 $867 (9) (9) Africa 174 3 177 155 155 12 14 East, South Asia and Pacific Rim 185 3 188 223 223 (17) (16) European Union 1,206 3 1,209 1,191 1,191 1 2 Latin America 583 4 587 515 6 521 13 13 North Asia, Eurasia and Middle East 931 3 934 862 6 868 8 8 Corporate (522) 22 ($42) (542) (541) 58 (483) 4 (12) Consolidated $3,331 $50 ($42) $3,339 $3,254 $88 $3,342 2 (0)