SlideShare una empresa de Scribd logo
1 de 83
CHAPTER-TWO
TRANSMISSION LINE PARAMETERS
132 kV Double Circuit
Overhead Transmission Line
Kaliti Substation
132 KV Single Circuit
Overhead Transmission Line
Kaliti-Substation
2.1 INTRODUCTION
Generators and loads are connected together through transmission lines
transporting electric power from one place to another. Transmission line
must, therefore, take power from generators, transmit it to location where
it will be used, and then distribute it to individual consumers.
Transmission of electric power has been along the years and will still
continue one of the most important elements of today’s electric power
systems. Power transmission from generating stations to industrial sites
and to substations is the fundamental objective of the transmission
systems.
The Transmission line function is accomplished by overhead AC or DC
transmission lines or underground cables that connect the power plants in
to the transmission network, interconnect various areas of transmission
networks, interconnect one electric utility with another, or deliver the
electric power from various areas within the transmission network to the
distribution substations, from which the distribution systems supply
residential and commercial consumers.
INTRODUCTION CONT’D
The voltage levels of transmission lines; either overhead or cables are
selected according to the power to be transmitted to a certain area or
supplied to a customer. The advantage of higher levels of transmission line
voltage clearly appears when consideration is given to the transmitting
capability of a line, which increases with the square of the voltage.
i.e. P = VI = V2/R
Therefore, very high voltage levels are used to transmit power over long
distances. Once the power reaches the area where it will be used, it is
stepped down to a lower voltages in distribution substations, and then
delivered to customers through distribution lines.
There two types of transmission lines: overhead lines and buried cables.
Figure 1
Introduction Cont’d
 The transmission and distribution of three-phase electrical power on
overhead lines requires the use of at least three-phase conductors.
 Most low voltage lines use three-phase conductors forming a single three-
phase circuit. Many higher voltage lines consist of a single three-phase
circuit or two three-phase circuits strung or suspended from the same
tower structure and usually called a double-circuit line.
 The two circuits may be strung in a variety of configurations such as
vertical, horizontal or triangular configurations.
 Figure 2 illustrates typical single-circuit lines and double-circuit lines in
horizontal, triangular and vertical phase conductor arrangements.
A line may also consist of two circuits running physically in parallel but on
different towers.
 In addition, a few lines have been built with three, four or even six three-
phase circuits strung on the same tower structure in various horizontal
and/or triangular formations.
Introduction Cont’d
Introduction Cont’d
Figure 2
An overhead transmission line usually consists of three conductors or
bundles of conductors containing the three phases of the power system.
The conductors are usually aluminum cable steel reinforced (ACSR),
which are steel core (for strength) and aluminum wires (having low
resistance) wrapped around the core.
OVERHEAD LINE CONT’D
In overhead transmission lines, the conductors are suspended from a pole
or a tower via insulators.
In addition to phase conductors, a transmission line usually includes one
or two steel wires called ground (shield) wires. These wires are electrically
connected to the tower and to the ground, and, therefore, are at ground
potential.
In large transmission lines,
these wires are located
above the phase conductors,
shielding them from lightning.
OVERHEAD LINE CONT’D
CONT…
 Bundled phase conductors are usually used on transmission lines at 220
kV and above. These are constructed with more than one conductor per
phase separated at regular intervals along the span length between two
towers by metal spacers.
 Conductor bundles of two, three, four, six and eight are in use in various
countries.
 The purpose of bundled conductors is to reduce the voltage gradients at
the surface of the conductors because the bundle appears as an
equivalent conductor of much larger diameter than that of the
component conductors.
 This minimizes active losses due to corona, reduces noise generation,
e.g. radio interference, reduces the inductive reactance and increases
the capacitive susceptance or capacitance of the line.
 The latter two effects improve the steady state power transfer capability
of the line.
Cable lines are designed to be placed
underground or under water. The
conductors are insulated from one another
and surrounded by protective sheath.
Cable lines are usually more expensive and
harder to maintain. They also have
capacitance problem – not suitable for long
distance.
UNDERGROUND CABLES CONT’D
2.2 TRANSMISSION LINE PARAMETERS
An electric transmission lines are characterized by four parameters,
namely resistance, inductance, capacitance and shunt conductance. The
electrical design and performance of a line are dependent on these
parameters. These values determine the power-carrying capacity of the
transmission line and the voltage drop across it at full load.
These parameters are uniformly distributed along the whole line. Each line
has its own value, and it is not possible to concentrate or lump them at
discrete points on the line. For this reason the line parameters are known
as distributed parameters. Their values are given in per unit length of line
and they are denoted as R, L, C and G respectively. The line parameters
are functions of the line-geometry, construction material and operational
frequency.
The line resistance and inductance form the series impedance of the line.
While the capacitance and conductance form the shunt admittance of the
line.
CONT…
 The series resistance relies basically on the physical
composition of the conductor at a given temperature.
 The series inductance and shunt capacitance are produced
by the presence of magnetic and electric fields around the
conductors, and depend on their geometrical arrangement.
 The shunt conductance is due to leakage currents flowing
across insulators and air. As leakage current is considerably
small compared to nominal current, it is usually neglected,
and therefore, shunt conductance is normally not considered
for the transmission line modeling
TRANSMISSION LINE PARAMETERS CONT’D
Transmission lines are classified in to short, medium and long groups
according to the length of the transmission lines. The performance of one
or more of the parameters of a line is governed by its length and
conductor configuration. For overhead lines up to 80 km the capacitance
C and shunt conductance G are negligibly small but for cable lines where
the distance between the conductors is small, the effect of capacitance
can not ignored. All low-voltage overhead lines having lengths up to 80 km
are generally classified as Short lines.
The lines ranging in length from 80 to 240 km are termed as Medium or
moderately long lines. For these lines, the capacitance of the line cannot
be neglected and it’s considered to be lumped at one or more points of the
line. The effect of capacitance is more at higher frequency. The leakage
conductance or leakance is neglected.
The term Long line refers to a line having its length more than 240 km.
The long line treatment takes all the four parameters in to account and
allows for the fact that they are distributed uniformly over the entire length
of the line.
Short Transmission line Equivalent
Circuit (Series Impedance
parameters only)
Medium Transmission line Equivalent
Circuit (Series Impedance and Shunt
Capacitance
Long Transmission line
Equivalent Circuit ( All the
four TL Parameters)
TRANSMISSION LINE PARAMETERS CONT’D
2.2.1 RESISTANCE
The AC resistance of a conductor in a transmission line is based on the
calculation of its DC resistance.
If DC current is flowing along a round cylindrical conductor, the current is
uniformly distributed over its cross-section area and its DC resistance is
evaluated by
RDC =  l /A [Ω]
Where l is the length of conductor; A – cross-sectional area,  is the
resistivity of the conductor. Therefore, the DC resistance per meter of the
conductor is
rDC =  /A [Ω/m]
The resistivity of a conductor is a fundamental property of the material that
the conductor is made from. It varies with both type and temperature of
the material. At the same temperature, the resistivity of aluminum is higher
than the resistivity of copper.
LINE RESISTANCE CONT’D
 If AC current is flowing, rather than DC current, the following factors need to
be considered:
1. Frequency or skin effect 2. Temperature
3. Spiraling of stranded conductors 4. Bundle conductors arrangement
5. Proximity effect
6. Also the resistance of magnetic conductor varies with current magnitude.
A. Skin Effect
 The frequency of the AC voltage produces effect on the conductor resistance
due to the non uniform distribution of the current. This phenomenon is known
as skin effect or frequency effect.
 As frequency increases, the current tends to go toward the surface of the
conductor and the current density decreases at the center.
 Skin effect reduces the effective cross-section area used by the current, and
thus, the effective resistance increases.
 Also, although in small amount, a further resistance increase occurs when
other current-carrying conductors are present in the immediate vicinity.
 A skin correction factor k, obtained by differential equations and Bessel
functions, is considered to reevaluate the AC resistance.
 For 60 Hz, k is estimated around 1.02
𝑅𝐴𝐶=𝑘𝑅𝐷𝐶
B. Temperature Effect
 The resistivity of any conductive material varies linearly over an operating
temperature, and therefore, the resistance of any conductor suffers the
same variations.
 As temperature rises, the conductor resistance increases linearly, over
normal operating temperatures, according to the following equation:
Where R2 is the resistance at second temperature t2
R1 is the resistance at initial temperature t1
T is the temperature coefficient for the particular material (C°)
RESISTANCE CONT’D
The resistivity increases linearly with temperature over normal range of
temperatures. If the resistivity at one temperature is known, the resistivity
at another temperature can be found from
T2 = (T+t2) /(T+t1)T1
Where t1 and t1 are temperature 1 in oC and the resistivity at that
temperature, t2 and t2 are temperature 2 in oC and the resistivity at that
temperature, and T is the temperature constant.
Resistivity (𝜌) and temperature coefficient (T) constants depend upon the
particular conductor material
Material Resistivity at 20oC
[m]
Temperature constant
[oC]
Annealed copper 1.7210-8 234.5
Hard-drawn
copper
1.7710-8 241.5
Aluminum 2.8310-8 228.1
-8
We notice that silver and copper would be among the best conductors.
However, aluminum, being much cheaper and lighter, is used to make
most of the transmission line conductors. Conductors made out of
aluminum should have bigger diameter than copper conductors to offset
the higher resistivity of the material and, therefore, support the necessary
currents.
AC resistance of a conductor is always higher than its DC resistance due
to the skin effect forcing more current flow near the outer surface of the
conductor. The higher the frequency of current, the more noticeable skin
effect would be.
At frequencies of our interest (50-60 Hz), however, skin effect is not very
strong.
Wire manufacturers usually supply tables of resistance per unit length at
common frequencies (50 and 60 Hz). Therefore, the resistance can be
determined from such tables.
RESISTANCE CONT’D
C. Spiraling and Bundle Conductor Effect
•Overhead conductors, made of naked metal and suspended on insulators,
are preferred over underground conductors because of the lower cost and
easy maintenance. Also, overhead transmission lines use aluminum
conductors, because of the lower cost and lighter weight compared to
copper conductors, although more cross-section area is needed to conduct
the same amount of current.
•There are different types of commercially available aluminum conductors:
aluminum-conductor-steel-reinforced (ACSR), aluminum-conductor-alloy-
reinforced (ACAR), all-aluminum-conductor (AAC), and all-aluminumalloy-
conductor (AAAC).
Figure 3: Stranded aluminum conductor with stranded steel core (ACSR).
 ACSR is one of the most used conductors in transmission lines.
• It consists of alternate layers of stranded conductors, spiraled in opposite
directions to hold the strands together, surrounding a core of steel
strands.
 The purpose of introducing a steel core inside the stranded aluminum
conductors is to obtain a high strength-to-weight ratio.
 A stranded conductor offers more flexibility and easier to manufacture
than a solid large conductor. However, the total resistance is increased
because the outside strands are larger than the inside strands on account
of the spiraling.
 The resistance of each wound conductor at any layer, per unit length, is
based on its total length as follows:
Resistance Cont’d
 where 𝑅𝑐𝑜𝑛𝑑: resistance of wound conductor (Ω)
 : : length of wound conductor (m)
 𝑃𝑐𝑜𝑛𝑑=𝑙t𝑢𝑟n /2𝑟𝑙𝑎𝑦𝑒𝑟 relative pitch of wound conductor
 𝑙𝑡𝑢𝑟𝑛 : length of one turn of the spiral (m)
 2𝑟𝑙𝑎𝑦𝑒𝑟: diameter of the layer (m)
 The parallel combination of n conductors, with same diameter
per layer, gives the resistance per layer as follows:
Similarly, the total resistance of the stranded conductor is
evaluated by the parallel combination of resistances per layer.
 In high-voltage transmission lines, there may be more than one
conductor per phase (bundle configuration) to increase the current
capability and to reduce corona effect discharge.
 Corona effect occurs when the surface potential gradient of a conductor
exceeds the dielectric strength of the surrounding air (30 kV/cm during fair
weather), producing ionization in the area close to the conductor, with
consequent corona losses, audible noise, and radio interference.
 As corona effect is a function of conductor diameter, line configuration,
and conductor surface condition, then meteorological conditions play a
key role in its evaluation.
 Corona losses under rain or snow, for instance, are much higher than in
dry weather.
Figure: Stranded conductors arranged in bundles per phase of (a) two, (b)
three, and (c) four.
• Corona, however, can be reduced by increasing the total conductor
surface. Although corona losses rely on meteorological conditions, their
evaluation takes into account the conductance between conductors and
between conductors and ground.
•By increasing the number of conductors per phase, the total cross-section
area increases, the current capacity increases, and the total AC resistance
decreases proportionally to the number of conductors per bundle.
•Conductor bundles may be applied to any voltage but are always used at
345 kV and above to limit corona.
• T o maintain the distance between bundle conductors along the line,
spacers made of steel or aluminum bars are used.
26
D. PROXIMITY EFFECTS
 In a transmission line there is a non-uniformity of current distribution caused
by a higher current density in the elements of adjacent conductors nearest each
other than in the elements farther apart. The phenomenon is known as
proximity effect.
 It is present for three-phase as well as single-phase circuits.
 For the usual spacing of overhead lines at 60 Hz, the proximity effect is
neglected.
27
EXAMPLE 1
 A three phase transmission line is designed to deliver 190.5 MVA at 220 kV over
a distance of 63 km. the total transmission loss is not to exceed 2.5 percent of the
rated line MVA. If the resistivity of the conductor material at 20°c is 2.8×10⁻⁸Ωm
, determine the required conductor diameter and the conductor size.
Solution
28
 The inductive reactance is by far the most dominating impedance element.
 A current-carrying conductor produces a magnetic field around the conductor.
 The magnetic flux lines are concentric closed circles with direction given by the
right hand rule. With the thumb pointing in the direction of the current, the
fingers of the right hand encircled the wire point in the direction of the magnetic
field.
 When the current changes, the flux changes and a voltage is induced in the
circuit.
 By definition, for nonmagnetic material, the inductance L is the ratio of its total
magnetic flux linkage to the current I, given by
2.2.2 Inductance and Inductive Reactance
The series inductance of a transmission line consists of two components:
internal and external inductances, which are due the magnetic flux inside
and outside the conductor respectively. The inductance of a transmission
line is defined as the number of flux linkages [Wb-turns] produced per
ampere of current flowing through the line:
L = λ / I
1. Internal inductance:
Consider a conductor of radius r carrying a current
I. At a distance x from the center of this conductor,
the magnetic field intensity Hx can be found from
Ampere’s law:
CONT’D
INDUCTANCE AND INDUCTIVE REACTANCE CONT’D
Where Hx is the magnetic field intensity at each point along a closed path,
dl is a unit vector along that path and Ix is the net current enclosed in the
path. For the homogeneous materials and a circular path of radius x, the
magnitude of Hx is constant, and dl is always parallel to Hx. Therefore:
Assuming next that the current is distributed uniformly in the conductor:
Thus, the magnetic intensity at radius x inside the conductor is
I
The flux density at a distance x from the center of the conductor is
The differential magnetic flux contained in a circular tube of thickness dx
and at a distance x from the center of the conductor is
The flux linkages per meter of length due to flux in the tube is the product
of the differential flux and the fraction of current linked:
INDUCTANCE AND INDUCTIVE REACTANCE CONT’D
The total internal flux linkages per meter can be found via integration…
Therefore, the internal inductance per meter is: L = λ/I
If the relative permeability of the conductor is 1 (non-ferromagnetic
materials, such as copper and aluminum), the permeability reduces to
INDUCTANCE AND INDUCTIVE REACTANCE CONT’D
Where μ0 = 4л*10-7
2. EXTERNAL INDUCTANCE BETWEEN 2 POINTS OUTSIDE OF THE LINE
To find the inductance external to a conductor, we
need to calculate the flux linkages of the
conductor due only the portion of flux between two
points P1 and P2 that lie at distances D1 and D2
from the center of the conductor.
In the external to the conductor region, the
magnetic intensity at a distance x from the center
of conductor is
since all the current is within the tube, Ix = I.
The flux density at a distance x from the center of conductor is
The differential magnetic flux contained in a circular tube of thickness dx
and at a distance x from the center of the conductor is
The flux links the full current carried by the conductor, therefore:
The total external flux linkages per meter can be found via integration…
The external inductance per meter is
The inductance between two points external to a conductor For non-ferromagnetic
materials is then
3. INDUCTANCE OF A SINGLE-PHASE 2-WIRE TRANSMISSION LINE
We determine next the series inductance of a
single-phase line consisting of two conductors
of radii r spaced by a distance D and both
carrying currents of magnitude I flowing into
the page in the left-hand conductor and out of
the page in the right-hand conductor.
Considering two circular integration paths, we
notice that the line integral along x1 produces
a net magnetic intensity since a non-zero net
current is enclosed by x1. Thus:
Since the path of radius x2 encloses both conductors and the currents are
equal and opposite, the net current enclosed is 0 and, therefore, there are
no contributions to the total inductance from the magnetic fields at
distances greater than D.
The total inductance of a wire per unit length in this transmission line is a
sum of the internal inductance and the external inductance between the
conductor surface (r) and the separation distance (D):
By symmetry, the total inductance of the other wire is the same, therefore,
the total inductance of a two-wire transmission line is
Where r is the radius of each conductor and D is the distance between
conductors.
INDUCTANCE OF A SINGLE-PHASE 2-WIRE TRANSMISSION LINE CONT’D
The flux beyond D links a net current of zero and does not contribute to
the net magnetic flux linkage in the circuit. Thus, to obtain the inductance
of conductor 1 due to the net external flux linkage, it is necessary to
evaluate external inductance from 𝐷1=𝑟1 to 𝐷2=𝐷.
37
38
39
40
FLUX LINKAGE IN TERMS OF SELF AND MUTUAL INDUCTANCE
The series inductance per phase for the above single phase two wire line can
be expressed in terms of self inductance of each conductor and their mutual
inductance. Consider one meter length of the single phase circuit represented
by two coils characterized by the self inductances 𝐿11 and 𝐿22 and the mutual
inductance 𝐿12 . The magnetic polarity is indicated by dot symbols as shown
in the following Figure .
The single phase line viewed as two magnetically coupled coils
41
Comparing the above questions with the external inductance of a conductor
(Lext = 2x10⁻⁷ln(D2/D1) H/m), we conclude the following equivalent expressions
for the self and mutual inductances:
42
4. INDUCTANCE OF THREE PHASE TRANSMISSION LINES -SYMMETRICAL SPACING
Consider one meter length of a three phase line with three conductors,
each with radius r, symmetrically spaced in a triangular configuration as
shown in the following Figure.
43
44
5. INDUCTANCE OF THREE PHASE TRANSMISSION LINES -ASYMMETRICAL SPACING
Practical transmission lines cannot maintain symmetrical spacing of conductors
because of construction considerations. With asymmetrical spacing, even with
balanced currents, the voltage drop due to the line inductance will be
unbalanced. Consider one meter length of a three phase line with three
conductors, each with radius r. the conductors are asymmetrically spaced with
distances shown in the following Figure.
Three phase line with asymmetrical spacing.
45
Or in matrix form
46
6. TRANSPOSE LINE
The equilateral triangular spacing configuration is not the only configuration
commonly used in practice. Thus the need exists for equalizing the mutual
inductances. One means for doing this is to construct transpositions or
rotations of overhead line wires. A transposition is a physical rotation of the
conductors, arranged so that each conductor is moved to occupy the next
physical position in a regular sequence such as a-b-c, b-c-a, c-a-b, etc. Such a
transposition arrangement is shown in the following Figure. If a section of line is
divided into three segments of equal length separated by rotations, we say that
the line is “completely transposed.”
A transposed three phase line
47
48
INDUCTANCE OF COMPOSITE CONDUCTORS
In the evaluation of inductance, solid round conductors were considered.
However, in practical transmission lines, stranded conductors are used. Also,
for reasons of economy, most EHV lines are constructed with bundled
conductors. In this section an expression is found for the inductance of
composite conductors. The result can be used for evaluating the GMR of
stranded or bundled conductors. It is also useful in finding the equivalent
GMR and GMD of parallel circuits.
49
50
51
52
53
54
7. INDUCTANCE OF THREE PHASE DOUBLE CIRCUIT LINE
A three double circuit line consists of two identical three phase circuits. The
circuits are opened with 𝑎1−𝑎2,𝑏1−𝑏2 𝑎𝑛𝑑 𝑐1−𝑐2 in parallel. Because of
geometrical differences between conductors, voltage drop due to line
inductance will be unbalanced. To achieve balance, each phase conductor must
be transposed within its group and with respect to parallel three phase line.
Consider a three phase double circuit line with relative phase positions 𝑎1𝑏1𝑐1−𝑐2
𝑏2𝑎2, as shown in the following Figure
55
56
INDUCTANCE OF A TRANSMISSION LINE CONT’D
A two-conductor
bundle
A four-conductor
bundle
CONCLUSIONS ON INDUCTANCE OF A TRANSMISSION LINE
Analysis of the above equations show that:
1. The greater the spacing between the phases of a transmission line, the
greater the inductance of the line. Since the phases of a high-voltage
overhead transmission line must be spaced further apart to ensure
proper insulation, a high-voltage line will have a higher inductance than
a low-voltage line. Since the spacing between lines in buried cables is
very small, series inductance of cables is much smaller than the
inductance of overhead lines.
1. The greater the radius of the conductors in a transmission line, the
lower the inductance of the line. In practical transmission lines, instead
of using heavy and inflexible conductors of large radii, two and more
conductors are bundled together to approximate a large diameter
conductor. The more conductors included in the bundle, the better the
approximation becomes. Bundles are often used in the high-voltage
transmission lines.
INDUCTIVE REACTANCE OF A LINE
The series inductive reactance of a transmission line depends on both the
inductance of the line and the frequency of the power system. Denoting
the inductance per unit length as l, the inductive reactance per unit length
will be
where f is the power system frequency. Therefore, the total series
inductive reactance of a transmission line can be found as
where d is the length of the line.
xI = jωɭ = j2лfɭ
XI = xId
2.2.3 CAPACITANCE AND CAPACITIVE REACTANCE
Since a voltage V is applied to a pair of conductors separated by a
dielectric (air), charges of equal magnitude but opposite sign will
accumulate on the conductors.
Transmission line conductors exhibit capacitance with respect to each
other due to the potential difference between them. The amount of
capacitance between conductors is a function of conductor size, spacing,
and height above ground. By definition, the capacitance C is the ratio of
charge q to the voltage v, given by
In AC power systems, a transmission line carries a time-varying voltage
different in each phase. This time-varying voltage causes the changes in
charges stored on conductors. Changing charges produce a changing
current, which will increase the current through the transmission line and
affect the power factor and voltage drop of the line. This changing current
will flow in a transmission line even if it is open circuited.
Consider a long round conductor with radius r, carrying a charge of q coulombs
per meter length as shown in the following Figure.
Electric field around a long round conductor.
The charge on the conductor gives rise to an electric field with radial flux lines. The
total electric flux is numerically equal to the value of charge on the conductor. The
intensity of the field at any point defined as the force per unit charge and is termed
electric field intensity designated as E. Concentric cylinders surrounding the
conductor are equipentential surfaces and have the same electric flux density.
The electric flux density D may be found from the relation:
From Gauss’s law for one meter length of the conductor, the electric flux
density at a cylinder of a radius x is given by
where A specifies a closed surface; dA is the unit vector normal to the
surface; q is the charge inside the surface; D is the electric flux density at the
surface:
where E is the electric field intensity at that point;  is the permittivity of the material:
Where r is Relative permittivity of the material
The permittivity of free space 0 = 8.8510-12 F/m
Ԑ = ԐrԐo
Electric flux lines radiate uniformly outwards
from the surface of the conductor with a
positive charge on its surface. In this case, the
flux density vector D is always parallel to the
normal vector dA and is constant at all points
around a path of constant radius r. Therefore:
were l is the length of conductor; q is the
charge density; Q is the total charge on the
conductor.
Then the flux density is
The electric field intensity is
Capacitance and capacitive reactance Cont’d
The potential difference between two points P1 and P2 can be found as
where dl is a differential element tangential to the integration path
between P1 and P2. The path is irrelevant.
Selection of path can simplify calculations.
For P1 - Pint, vectors E and dl are parallel;
therefore, Edl = Edx. For Pint – P2 vectors
are orthogonal, therefore Edl = 0.
CAPACITANCE AND CAPACITIVE REACTANCE CONT’D
2.3.1 CAPACITANCE OF A SINGLE PHASE TWO-WIRE TRANSMISSION LINE
The potential difference due to the
charge on conductor a can be
found as
Similarly, the potential difference due to the charge on conductor b is
or
The total voltage between the lines is
Since q1 = q2 = q, the equation reduces to
The capacitance per unit length between the two conductors of the line is
CAPACITANCE OF A SINGLE PHASE TWO-WIRE TRANSMISSION LINE CONT’D
Thus:
Which is the capacitance per unit length of a single-phase two-wire
transmission line.
The above Equation gives the line to line capacitance between
conductors. For the purpose of transmission line modeling, it is convenient
to define a capacitance C between each conductor and a neural as
illustrated in below.
The potential difference between each conductor and the ground (or
neutral) is one half of the potential difference between the two conductors.
Therefore, the capacitance to ground of this single-phase transmission
line will be
CAPACITANCE OF A SINGLE PHASE TWO-WIRE TRANSMISSION LINE CONT’D
Recalling 𝜖0=8.85×10⁻¹² 𝐹/𝑚 and converting to 𝜇𝐹 per kilometer, we have
Analysis of the above final equation shows that:
1. The greater the spacing between the phases of a transmission line, the
lower the capacitance of the line. Since the phases of a high-voltage
overhead transmission line must be spaced further apart to ensure
proper insulation, a high-voltage line will have a lower capacitance than
a low-voltage line. Since the spacing between lines in buried cables is
very small, shunt capacitance of cables is much larger than the
capacitance of overhead lines. Cable lines are normally used for short
transmission lines (to min capacitance) in urban areas.
2. The greater the radius of the conductors in a transmission line, the
higher the capacitance of the line. Therefore, bundling increases the
capacitance. Good transmission line is a compromise among the
requirements for low series inductance, low shunt capacitance, and a
large enough separation to provide insulation between the phases.
SHUNT CAPACITIVE ADMITTANCE
The shunt capacitive admittance of a transmission line depends on both
the capacitance of the line and the frequency of the power system.
Denoting the capacitance per unit length as c, the shunt admittance per
unit length will be
The total shunt capacitive admittance therefore is
where d is the length of the line. The corresponding capacitive reactance
is the reciprocal to the admittance:
1 1
2
C
C
Z j
Y fcd

  
POTENTIAL DIFFERENCE IN A MULTICONDUCTOR CONFIGURATION
Consider n parallel long conductors with charges 𝑞1,𝑞2,…,𝑞𝑛 coulombs/meter as
shown in
Multi-conductor configuration.
Assume that the distortion effect is negligible and charge is uniformly distributed
around the conductor, with the following constraint
Using superposition, the potential difference between conductor I and j due to
the presence of all charges is given by:
When k=I, 𝐷𝑖𝑖 is the distance between the surface of the conductor and its
center, namely its radius r.
CAPACITANCE OF THREE PHASE LINES
Consider one meter length of a three phase line with three long conductors, each
with radius r, with conductor spacing as shown in the following figure:
For a balanced three phase system
We shall neglect the effect of ground and the shield wires. Assume that the lines
is transposed. We proceed with the calculation of the potential difference
between a and b for each section of transposition. Applying ( 80) to the first
section of the transposition, 𝑉_𝑎𝑏 is
EFFECT OF EARTH ON THE CAPACITANCE
For an isolated charged conductor the electric flux lines are radial and are
orthogonal to the cylindrical equipotential surfaces. The presence of earth will
alter the distribution of electric flux lines and equipotential surfaces, which will
change the effective capacitance of the line.
The earth level is an equipotential surface, therefore the flux lines are forced to
cut the surface of the earth orthogonally. The effect of the presence of earth can
be accounted for by the method of image charges introduced by Kelvin.
To illustrate this method, consider a conductor with a charge q coulombs/meter at a
high H above ground. Also, imagine a charge –q at a depth –H below the surface of
earth. This configuration without the presence of the earth surface will produce the
same field distribution as a single charge and the earth surface. Thus, the earth can
be replaced for the calculation of electric field potential by a fictitious charged
conductor with charge equal and opposite to the charge on the actual conductor and
at a depth below the surface of the earth the same as the height of the actual
conductor above earth. This, imaginary conductor is called the image of the actual
conductor.
The effect of the earth is to increase the capacitance. But normally the height of
the conductor is large as compared to the distance between the conductors, and
the earth effect is negligible. Therefore, for all line models used for balanced
steady state analysis, the effect of earth on the capacitance can be neglected.
However, for unbalanced analysis such as unbalanced faults, the earth’s effect as
well as the shield wires should be considered.
Example 1:
If a single phase line has parameters D=5ft, r=0.023 ft, and a flat horizontal spacing
H=18ft average line height, determine the effect of the earth on capacitance.
Assume a perfectly conducting earth plane.
Solution:
The earth plane is replaced by a separate image for each overhead conductor, and
the conductors are charged as shown in the above figure. The voltages between
conductors x and y is:
Example 2:
A 500kV three phase transposed line is composed of one ACSR 1,272,000 cmil,
45/7 Bittern conductor per phase with horizontal conductor configuration as shown
in the following Figure. The conductors have a diameter of 1.345 in and a GMR of
0.5328 in. find the inductance and capacitance per phase per kilometer of the line.
Figure: conductor layout for the three phase transmission line
EXAMPLE 3:
An 8000 V, 60 Hz, single-phase, transmission line consists of two hard-
drawn aluminum conductors with a radius of 2 cm spaced 1.2 m apart. If
the transmission line is 30 km long and the temperature of the conductors
is 200C,
a. What is the series resistance per kilometer of this line?
b. What is the series inductance per kilometer of this line?
c. What is the shunt capacitance per kilometer of this line?
d. What is the total series reactance of this line?
e. What is the total shunt admittance of this line?
Solution:
a. The series resistance of the transmission line is
l
R
A


Ignoring the skin effect, the resistivity of the line at 200 will be 2.8310-8 -
m and the resistance per kilometer of the line is
8
2
2.83 10 1000
0.0225
0.02
l
r km
A



 
   

SOLUTION CONT’D
b. The series inductance per kilometer of the transmission line is
3
1 1 1.2
ln 1000 ln 1000 1.738 10
4 4 0.02
D
l H km
r
 
 

   
        
   
   
c. The shunt capacitance per kilometer of the transmission line is
12
9
8.854 10
1000 1000 6.794 10
1.2
ln ln
0.02
ab
c F km
D
r
  

 
      
d. The series impedance per kilometer of the transmission line is
3
2 0.0225 2 60 1.738 10 0.0225 0.655
se
z r jx r j fl j j km
  
           
Then the total series impedance of the line is
 
0.0225 0.655 30 0.675 19.7
se
Z j j
     
e. The shunt admittance per kilometer of the transmission line is
9 6
2 2 60 6.794 10 2.561 10
C
y j fc j j S m
   
       
The total shunt admittance will be
 
6 5
2.561 10 30 7.684 10
se
Y j j S
 
     
The corresponding shunt capacitive reactance is
5
1 1
13.0
7.684 10
sh
sh
Z j k
Y j 
     

SOLUTION CONT’D

Más contenido relacionado

La actualidad más candente

Fault Level Calculation
Fault Level CalculationFault Level Calculation
Fault Level CalculationDinesh Sarda
 
Transmission lines
Transmission linesTransmission lines
Transmission linesSuneel Varma
 
Line to Line & Double Line to Ground Fault On Power System
Line to Line & Double Line to Ground Fault On Power SystemLine to Line & Double Line to Ground Fault On Power System
Line to Line & Double Line to Ground Fault On Power SystemSmit Shah
 
importance of reactive power in power system
importance of reactive power in power systemimportance of reactive power in power system
importance of reactive power in power systemsneh pratap singh
 
short transmission line
short transmission lineshort transmission line
short transmission lineMohil Shah
 
POWER QUALITY IMPROVEMENT
POWER QUALITY IMPROVEMENTPOWER QUALITY IMPROVEMENT
POWER QUALITY IMPROVEMENTUday Wankar
 
POWER SYSTEM PROTECTION
POWER SYSTEM PROTECTION POWER SYSTEM PROTECTION
POWER SYSTEM PROTECTION moiz89
 
Directional over current relay
Directional over current relayDirectional over current relay
Directional over current relayCS V
 
Generalised circuit constants
Generalised circuit constantsGeneralised circuit constants
Generalised circuit constantsKaustubh Nande
 
Series & shunt compensation and FACTs Devices
Series & shunt compensation and FACTs DevicesSeries & shunt compensation and FACTs Devices
Series & shunt compensation and FACTs Deviceskhemraj298
 
TDU - Unit 02 - HVDC, FACTS and sub-stations
TDU - Unit  02 - HVDC, FACTS and sub-stations TDU - Unit  02 - HVDC, FACTS and sub-stations
TDU - Unit 02 - HVDC, FACTS and sub-stations PremanandDesai
 
lec 03 Power diode and types-1.pptx
lec 03 Power diode and types-1.pptxlec 03 Power diode and types-1.pptx
lec 03 Power diode and types-1.pptxZeeshanEjaz10
 
Classification of transmission lines
Classification of transmission linesClassification of transmission lines
Classification of transmission linesHamzaAbbas43
 

La actualidad más candente (20)

Structure of power system
Structure of power systemStructure of power system
Structure of power system
 
Fault Level Calculation
Fault Level CalculationFault Level Calculation
Fault Level Calculation
 
Transmission lines
Transmission linesTransmission lines
Transmission lines
 
Line to Line & Double Line to Ground Fault On Power System
Line to Line & Double Line to Ground Fault On Power SystemLine to Line & Double Line to Ground Fault On Power System
Line to Line & Double Line to Ground Fault On Power System
 
HVDC & FACTS
HVDC & FACTSHVDC & FACTS
HVDC & FACTS
 
importance of reactive power in power system
importance of reactive power in power systemimportance of reactive power in power system
importance of reactive power in power system
 
Z bus building algorithm
Z bus building algorithmZ bus building algorithm
Z bus building algorithm
 
short transmission line
short transmission lineshort transmission line
short transmission line
 
POWER QUALITY IMPROVEMENT
POWER QUALITY IMPROVEMENTPOWER QUALITY IMPROVEMENT
POWER QUALITY IMPROVEMENT
 
POWER SYSTEM PROTECTION
POWER SYSTEM PROTECTION POWER SYSTEM PROTECTION
POWER SYSTEM PROTECTION
 
Directional over current relay
Directional over current relayDirectional over current relay
Directional over current relay
 
Generalised circuit constants
Generalised circuit constantsGeneralised circuit constants
Generalised circuit constants
 
Series & shunt compensation and FACTs Devices
Series & shunt compensation and FACTs DevicesSeries & shunt compensation and FACTs Devices
Series & shunt compensation and FACTs Devices
 
Reactive power compensation
Reactive power compensationReactive power compensation
Reactive power compensation
 
Chopper operation
Chopper  operationChopper  operation
Chopper operation
 
TDU - Unit 02 - HVDC, FACTS and sub-stations
TDU - Unit  02 - HVDC, FACTS and sub-stations TDU - Unit  02 - HVDC, FACTS and sub-stations
TDU - Unit 02 - HVDC, FACTS and sub-stations
 
lec 03 Power diode and types-1.pptx
lec 03 Power diode and types-1.pptxlec 03 Power diode and types-1.pptx
lec 03 Power diode and types-1.pptx
 
Hvdc notes
Hvdc notesHvdc notes
Hvdc notes
 
Classification of transmission lines
Classification of transmission linesClassification of transmission lines
Classification of transmission lines
 
Single line diagram
Single line diagramSingle line diagram
Single line diagram
 

Similar a Chapter 2 transmission line parameters

Power System I Chapt 3.pdf
Power System I Chapt 3.pdfPower System I Chapt 3.pdf
Power System I Chapt 3.pdfArifeAbdulkerim
 
Electrical Transmission System Notes 3a.pptx
Electrical Transmission System Notes 3a.pptxElectrical Transmission System Notes 3a.pptx
Electrical Transmission System Notes 3a.pptxEG20910848921ISAACDU
 
EE8402 Transmission and Distribution
EE8402 Transmission and DistributionEE8402 Transmission and Distribution
EE8402 Transmission and Distributionrmkceteee
 
TRANSMISSION LINES and capacity.pptx
TRANSMISSION LINES and capacity.pptxTRANSMISSION LINES and capacity.pptx
TRANSMISSION LINES and capacity.pptxSatish Pydimarla
 
POWER SYSTEMS – II chapter 1 transmission line modelling.pptx
POWER SYSTEMS – II chapter 1 transmission line modelling.pptxPOWER SYSTEMS – II chapter 1 transmission line modelling.pptx
POWER SYSTEMS – II chapter 1 transmission line modelling.pptxMaipaliJyoshnaDevi
 
power system 1 unit 2 ppt (2).pptx
power system 1 unit 2 ppt (2).pptxpower system 1 unit 2 ppt (2).pptx
power system 1 unit 2 ppt (2).pptxmonikavardia
 
Transmission Line by YEASIN NEWAJ
Transmission Line by YEASIN NEWAJTransmission Line by YEASIN NEWAJ
Transmission Line by YEASIN NEWAJYeasinNewaj
 
Transmission line of electric power
Transmission line of electric powerTransmission line of electric power
Transmission line of electric powerAdnanMontakin
 
TRANSMISSION LINES and capacity.pdf
TRANSMISSION LINES and capacity.pdfTRANSMISSION LINES and capacity.pdf
TRANSMISSION LINES and capacity.pdfpramod719257
 
power system 1 unit 2 ppt (2).pptx
power system 1 unit 2 ppt (2).pptxpower system 1 unit 2 ppt (2).pptx
power system 1 unit 2 ppt (2).pptxmonikavardia
 
Design of 230 kV Twin Bundle Double Circuit Overhead Transmission Line
Design of 230 kV Twin Bundle Double Circuit Overhead Transmission LineDesign of 230 kV Twin Bundle Double Circuit Overhead Transmission Line
Design of 230 kV Twin Bundle Double Circuit Overhead Transmission Lineijtsrd
 
Comparative evaluation of hvdc
Comparative evaluation of hvdcComparative evaluation of hvdc
Comparative evaluation of hvdcshivamverma394
 
performance of transmission lines of long,medium and short length
performance of transmission lines of long,medium and short lengthperformance of transmission lines of long,medium and short length
performance of transmission lines of long,medium and short lengthamrinder14
 
Electricity distribution
Electricity distributionElectricity distribution
Electricity distributionghumman88
 
Types of transmission lines
Types of transmission linesTypes of transmission lines
Types of transmission linesSelf-employed
 
Design aspects of high voltage transmission line
Design aspects of high voltage transmission lineDesign aspects of high voltage transmission line
Design aspects of high voltage transmission linejournalBEEI
 
315564438 hvdc-transmission-ppt
315564438 hvdc-transmission-ppt315564438 hvdc-transmission-ppt
315564438 hvdc-transmission-pptLaveen Raghunam
 
Thermal power plant working
Thermal power plant workingThermal power plant working
Thermal power plant workingSandeep Jamdar
 
Comparison of AC and DC.pptx
Comparison of AC and DC.pptxComparison of AC and DC.pptx
Comparison of AC and DC.pptxRenukaKutte
 

Similar a Chapter 2 transmission line parameters (20)

Power System I Chapt 3.pdf
Power System I Chapt 3.pdfPower System I Chapt 3.pdf
Power System I Chapt 3.pdf
 
Electrical Transmission System Notes 3a.pptx
Electrical Transmission System Notes 3a.pptxElectrical Transmission System Notes 3a.pptx
Electrical Transmission System Notes 3a.pptx
 
EE8402 Transmission and Distribution
EE8402 Transmission and DistributionEE8402 Transmission and Distribution
EE8402 Transmission and Distribution
 
TRANSMISSION LINES and capacity.pptx
TRANSMISSION LINES and capacity.pptxTRANSMISSION LINES and capacity.pptx
TRANSMISSION LINES and capacity.pptx
 
POWER SYSTEMS – II chapter 1 transmission line modelling.pptx
POWER SYSTEMS – II chapter 1 transmission line modelling.pptxPOWER SYSTEMS – II chapter 1 transmission line modelling.pptx
POWER SYSTEMS – II chapter 1 transmission line modelling.pptx
 
power system 1 unit 2 ppt (2).pptx
power system 1 unit 2 ppt (2).pptxpower system 1 unit 2 ppt (2).pptx
power system 1 unit 2 ppt (2).pptx
 
Transmission Line by YEASIN NEWAJ
Transmission Line by YEASIN NEWAJTransmission Line by YEASIN NEWAJ
Transmission Line by YEASIN NEWAJ
 
Transmission line of electric power
Transmission line of electric powerTransmission line of electric power
Transmission line of electric power
 
TRANSMISSION LINES and capacity.pdf
TRANSMISSION LINES and capacity.pdfTRANSMISSION LINES and capacity.pdf
TRANSMISSION LINES and capacity.pdf
 
power system 1 unit 2 ppt (2).pptx
power system 1 unit 2 ppt (2).pptxpower system 1 unit 2 ppt (2).pptx
power system 1 unit 2 ppt (2).pptx
 
Design of 230 kV Twin Bundle Double Circuit Overhead Transmission Line
Design of 230 kV Twin Bundle Double Circuit Overhead Transmission LineDesign of 230 kV Twin Bundle Double Circuit Overhead Transmission Line
Design of 230 kV Twin Bundle Double Circuit Overhead Transmission Line
 
Comparative evaluation of hvdc
Comparative evaluation of hvdcComparative evaluation of hvdc
Comparative evaluation of hvdc
 
performance of transmission lines of long,medium and short length
performance of transmission lines of long,medium and short lengthperformance of transmission lines of long,medium and short length
performance of transmission lines of long,medium and short length
 
Electricity distribution
Electricity distributionElectricity distribution
Electricity distribution
 
Types of transmission lines
Types of transmission linesTypes of transmission lines
Types of transmission lines
 
Design aspects of high voltage transmission line
Design aspects of high voltage transmission lineDesign aspects of high voltage transmission line
Design aspects of high voltage transmission line
 
315564438 hvdc-transmission-ppt
315564438 hvdc-transmission-ppt315564438 hvdc-transmission-ppt
315564438 hvdc-transmission-ppt
 
Thermal power plant working
Thermal power plant workingThermal power plant working
Thermal power plant working
 
Comparison of AC and DC.pptx
Comparison of AC and DC.pptxComparison of AC and DC.pptx
Comparison of AC and DC.pptx
 
Ch.1.1.pdf
Ch.1.1.pdfCh.1.1.pdf
Ch.1.1.pdf
 

Último

CCS355 Neural Networks & Deep Learning Unit 1 PDF notes with Question bank .pdf
CCS355 Neural Networks & Deep Learning Unit 1 PDF notes with Question bank .pdfCCS355 Neural Networks & Deep Learning Unit 1 PDF notes with Question bank .pdf
CCS355 Neural Networks & Deep Learning Unit 1 PDF notes with Question bank .pdfAsst.prof M.Gokilavani
 
Introduction-To-Agricultural-Surveillance-Rover.pptx
Introduction-To-Agricultural-Surveillance-Rover.pptxIntroduction-To-Agricultural-Surveillance-Rover.pptx
Introduction-To-Agricultural-Surveillance-Rover.pptxk795866
 
CCS355 Neural Network & Deep Learning Unit II Notes with Question bank .pdf
CCS355 Neural Network & Deep Learning Unit II Notes with Question bank .pdfCCS355 Neural Network & Deep Learning Unit II Notes with Question bank .pdf
CCS355 Neural Network & Deep Learning Unit II Notes with Question bank .pdfAsst.prof M.Gokilavani
 
Unit7-DC_Motors nkkjnsdkfnfcdfknfdgfggfg
Unit7-DC_Motors nkkjnsdkfnfcdfknfdgfggfgUnit7-DC_Motors nkkjnsdkfnfcdfknfdgfggfg
Unit7-DC_Motors nkkjnsdkfnfcdfknfdgfggfgsaravananr517913
 
lifi-technology with integration of IOT.pptx
lifi-technology with integration of IOT.pptxlifi-technology with integration of IOT.pptx
lifi-technology with integration of IOT.pptxsomshekarkn64
 
UNIT III ANALOG ELECTRONICS (BASIC ELECTRONICS)
UNIT III ANALOG ELECTRONICS (BASIC ELECTRONICS)UNIT III ANALOG ELECTRONICS (BASIC ELECTRONICS)
UNIT III ANALOG ELECTRONICS (BASIC ELECTRONICS)Dr SOUNDIRARAJ N
 
Piping Basic stress analysis by engineering
Piping Basic stress analysis by engineeringPiping Basic stress analysis by engineering
Piping Basic stress analysis by engineeringJuanCarlosMorales19600
 
Architect Hassan Khalil Portfolio for 2024
Architect Hassan Khalil Portfolio for 2024Architect Hassan Khalil Portfolio for 2024
Architect Hassan Khalil Portfolio for 2024hassan khalil
 
Transport layer issues and challenges - Guide
Transport layer issues and challenges - GuideTransport layer issues and challenges - Guide
Transport layer issues and challenges - GuideGOPINATHS437943
 
Past, Present and Future of Generative AI
Past, Present and Future of Generative AIPast, Present and Future of Generative AI
Past, Present and Future of Generative AIabhishek36461
 
8251 universal synchronous asynchronous receiver transmitter
8251 universal synchronous asynchronous receiver transmitter8251 universal synchronous asynchronous receiver transmitter
8251 universal synchronous asynchronous receiver transmitterShivangiSharma879191
 
INFLUENCE OF NANOSILICA ON THE PROPERTIES OF CONCRETE
INFLUENCE OF NANOSILICA ON THE PROPERTIES OF CONCRETEINFLUENCE OF NANOSILICA ON THE PROPERTIES OF CONCRETE
INFLUENCE OF NANOSILICA ON THE PROPERTIES OF CONCRETEroselinkalist12
 
Software and Systems Engineering Standards: Verification and Validation of Sy...
Software and Systems Engineering Standards: Verification and Validation of Sy...Software and Systems Engineering Standards: Verification and Validation of Sy...
Software and Systems Engineering Standards: Verification and Validation of Sy...VICTOR MAESTRE RAMIREZ
 
Correctly Loading Incremental Data at Scale
Correctly Loading Incremental Data at ScaleCorrectly Loading Incremental Data at Scale
Correctly Loading Incremental Data at ScaleAlluxio, Inc.
 
Arduino_CSE ece ppt for working and principal of arduino.ppt
Arduino_CSE ece ppt for working and principal of arduino.pptArduino_CSE ece ppt for working and principal of arduino.ppt
Arduino_CSE ece ppt for working and principal of arduino.pptSAURABHKUMAR892774
 
An experimental study in using natural admixture as an alternative for chemic...
An experimental study in using natural admixture as an alternative for chemic...An experimental study in using natural admixture as an alternative for chemic...
An experimental study in using natural admixture as an alternative for chemic...Chandu841456
 
CCS355 Neural Network & Deep Learning UNIT III notes and Question bank .pdf
CCS355 Neural Network & Deep Learning UNIT III notes and Question bank .pdfCCS355 Neural Network & Deep Learning UNIT III notes and Question bank .pdf
CCS355 Neural Network & Deep Learning UNIT III notes and Question bank .pdfAsst.prof M.Gokilavani
 

Último (20)

CCS355 Neural Networks & Deep Learning Unit 1 PDF notes with Question bank .pdf
CCS355 Neural Networks & Deep Learning Unit 1 PDF notes with Question bank .pdfCCS355 Neural Networks & Deep Learning Unit 1 PDF notes with Question bank .pdf
CCS355 Neural Networks & Deep Learning Unit 1 PDF notes with Question bank .pdf
 
POWER SYSTEMS-1 Complete notes examples
POWER SYSTEMS-1 Complete notes  examplesPOWER SYSTEMS-1 Complete notes  examples
POWER SYSTEMS-1 Complete notes examples
 
Introduction-To-Agricultural-Surveillance-Rover.pptx
Introduction-To-Agricultural-Surveillance-Rover.pptxIntroduction-To-Agricultural-Surveillance-Rover.pptx
Introduction-To-Agricultural-Surveillance-Rover.pptx
 
CCS355 Neural Network & Deep Learning Unit II Notes with Question bank .pdf
CCS355 Neural Network & Deep Learning Unit II Notes with Question bank .pdfCCS355 Neural Network & Deep Learning Unit II Notes with Question bank .pdf
CCS355 Neural Network & Deep Learning Unit II Notes with Question bank .pdf
 
Unit7-DC_Motors nkkjnsdkfnfcdfknfdgfggfg
Unit7-DC_Motors nkkjnsdkfnfcdfknfdgfggfgUnit7-DC_Motors nkkjnsdkfnfcdfknfdgfggfg
Unit7-DC_Motors nkkjnsdkfnfcdfknfdgfggfg
 
lifi-technology with integration of IOT.pptx
lifi-technology with integration of IOT.pptxlifi-technology with integration of IOT.pptx
lifi-technology with integration of IOT.pptx
 
UNIT III ANALOG ELECTRONICS (BASIC ELECTRONICS)
UNIT III ANALOG ELECTRONICS (BASIC ELECTRONICS)UNIT III ANALOG ELECTRONICS (BASIC ELECTRONICS)
UNIT III ANALOG ELECTRONICS (BASIC ELECTRONICS)
 
Piping Basic stress analysis by engineering
Piping Basic stress analysis by engineeringPiping Basic stress analysis by engineering
Piping Basic stress analysis by engineering
 
Architect Hassan Khalil Portfolio for 2024
Architect Hassan Khalil Portfolio for 2024Architect Hassan Khalil Portfolio for 2024
Architect Hassan Khalil Portfolio for 2024
 
Transport layer issues and challenges - Guide
Transport layer issues and challenges - GuideTransport layer issues and challenges - Guide
Transport layer issues and challenges - Guide
 
Past, Present and Future of Generative AI
Past, Present and Future of Generative AIPast, Present and Future of Generative AI
Past, Present and Future of Generative AI
 
8251 universal synchronous asynchronous receiver transmitter
8251 universal synchronous asynchronous receiver transmitter8251 universal synchronous asynchronous receiver transmitter
8251 universal synchronous asynchronous receiver transmitter
 
Exploring_Network_Security_with_JA3_by_Rakesh Seal.pptx
Exploring_Network_Security_with_JA3_by_Rakesh Seal.pptxExploring_Network_Security_with_JA3_by_Rakesh Seal.pptx
Exploring_Network_Security_with_JA3_by_Rakesh Seal.pptx
 
INFLUENCE OF NANOSILICA ON THE PROPERTIES OF CONCRETE
INFLUENCE OF NANOSILICA ON THE PROPERTIES OF CONCRETEINFLUENCE OF NANOSILICA ON THE PROPERTIES OF CONCRETE
INFLUENCE OF NANOSILICA ON THE PROPERTIES OF CONCRETE
 
Software and Systems Engineering Standards: Verification and Validation of Sy...
Software and Systems Engineering Standards: Verification and Validation of Sy...Software and Systems Engineering Standards: Verification and Validation of Sy...
Software and Systems Engineering Standards: Verification and Validation of Sy...
 
Correctly Loading Incremental Data at Scale
Correctly Loading Incremental Data at ScaleCorrectly Loading Incremental Data at Scale
Correctly Loading Incremental Data at Scale
 
Arduino_CSE ece ppt for working and principal of arduino.ppt
Arduino_CSE ece ppt for working and principal of arduino.pptArduino_CSE ece ppt for working and principal of arduino.ppt
Arduino_CSE ece ppt for working and principal of arduino.ppt
 
9953056974 Call Girls In South Ex, Escorts (Delhi) NCR.pdf
9953056974 Call Girls In South Ex, Escorts (Delhi) NCR.pdf9953056974 Call Girls In South Ex, Escorts (Delhi) NCR.pdf
9953056974 Call Girls In South Ex, Escorts (Delhi) NCR.pdf
 
An experimental study in using natural admixture as an alternative for chemic...
An experimental study in using natural admixture as an alternative for chemic...An experimental study in using natural admixture as an alternative for chemic...
An experimental study in using natural admixture as an alternative for chemic...
 
CCS355 Neural Network & Deep Learning UNIT III notes and Question bank .pdf
CCS355 Neural Network & Deep Learning UNIT III notes and Question bank .pdfCCS355 Neural Network & Deep Learning UNIT III notes and Question bank .pdf
CCS355 Neural Network & Deep Learning UNIT III notes and Question bank .pdf
 

Chapter 2 transmission line parameters

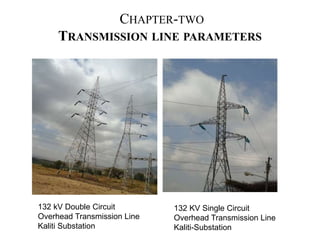
  • 1. CHAPTER-TWO TRANSMISSION LINE PARAMETERS 132 kV Double Circuit Overhead Transmission Line Kaliti Substation 132 KV Single Circuit Overhead Transmission Line Kaliti-Substation
  • 2. 2.1 INTRODUCTION Generators and loads are connected together through transmission lines transporting electric power from one place to another. Transmission line must, therefore, take power from generators, transmit it to location where it will be used, and then distribute it to individual consumers. Transmission of electric power has been along the years and will still continue one of the most important elements of today’s electric power systems. Power transmission from generating stations to industrial sites and to substations is the fundamental objective of the transmission systems. The Transmission line function is accomplished by overhead AC or DC transmission lines or underground cables that connect the power plants in to the transmission network, interconnect various areas of transmission networks, interconnect one electric utility with another, or deliver the electric power from various areas within the transmission network to the distribution substations, from which the distribution systems supply residential and commercial consumers.
  • 3. INTRODUCTION CONT’D The voltage levels of transmission lines; either overhead or cables are selected according to the power to be transmitted to a certain area or supplied to a customer. The advantage of higher levels of transmission line voltage clearly appears when consideration is given to the transmitting capability of a line, which increases with the square of the voltage. i.e. P = VI = V2/R Therefore, very high voltage levels are used to transmit power over long distances. Once the power reaches the area where it will be used, it is stepped down to a lower voltages in distribution substations, and then delivered to customers through distribution lines.
  • 4. There two types of transmission lines: overhead lines and buried cables. Figure 1 Introduction Cont’d
  • 5.  The transmission and distribution of three-phase electrical power on overhead lines requires the use of at least three-phase conductors.  Most low voltage lines use three-phase conductors forming a single three- phase circuit. Many higher voltage lines consist of a single three-phase circuit or two three-phase circuits strung or suspended from the same tower structure and usually called a double-circuit line.  The two circuits may be strung in a variety of configurations such as vertical, horizontal or triangular configurations.  Figure 2 illustrates typical single-circuit lines and double-circuit lines in horizontal, triangular and vertical phase conductor arrangements. A line may also consist of two circuits running physically in parallel but on different towers.  In addition, a few lines have been built with three, four or even six three- phase circuits strung on the same tower structure in various horizontal and/or triangular formations. Introduction Cont’d
  • 7. An overhead transmission line usually consists of three conductors or bundles of conductors containing the three phases of the power system. The conductors are usually aluminum cable steel reinforced (ACSR), which are steel core (for strength) and aluminum wires (having low resistance) wrapped around the core. OVERHEAD LINE CONT’D
  • 8. OVERHEAD LINE CONT’D In overhead transmission lines, the conductors are suspended from a pole or a tower via insulators.
  • 9. In addition to phase conductors, a transmission line usually includes one or two steel wires called ground (shield) wires. These wires are electrically connected to the tower and to the ground, and, therefore, are at ground potential. In large transmission lines, these wires are located above the phase conductors, shielding them from lightning. OVERHEAD LINE CONT’D
  • 10. CONT…  Bundled phase conductors are usually used on transmission lines at 220 kV and above. These are constructed with more than one conductor per phase separated at regular intervals along the span length between two towers by metal spacers.  Conductor bundles of two, three, four, six and eight are in use in various countries.  The purpose of bundled conductors is to reduce the voltage gradients at the surface of the conductors because the bundle appears as an equivalent conductor of much larger diameter than that of the component conductors.  This minimizes active losses due to corona, reduces noise generation, e.g. radio interference, reduces the inductive reactance and increases the capacitive susceptance or capacitance of the line.  The latter two effects improve the steady state power transfer capability of the line.
  • 11. Cable lines are designed to be placed underground or under water. The conductors are insulated from one another and surrounded by protective sheath. Cable lines are usually more expensive and harder to maintain. They also have capacitance problem – not suitable for long distance. UNDERGROUND CABLES CONT’D
  • 12. 2.2 TRANSMISSION LINE PARAMETERS An electric transmission lines are characterized by four parameters, namely resistance, inductance, capacitance and shunt conductance. The electrical design and performance of a line are dependent on these parameters. These values determine the power-carrying capacity of the transmission line and the voltage drop across it at full load. These parameters are uniformly distributed along the whole line. Each line has its own value, and it is not possible to concentrate or lump them at discrete points on the line. For this reason the line parameters are known as distributed parameters. Their values are given in per unit length of line and they are denoted as R, L, C and G respectively. The line parameters are functions of the line-geometry, construction material and operational frequency. The line resistance and inductance form the series impedance of the line. While the capacitance and conductance form the shunt admittance of the line.
  • 13. CONT…  The series resistance relies basically on the physical composition of the conductor at a given temperature.  The series inductance and shunt capacitance are produced by the presence of magnetic and electric fields around the conductors, and depend on their geometrical arrangement.  The shunt conductance is due to leakage currents flowing across insulators and air. As leakage current is considerably small compared to nominal current, it is usually neglected, and therefore, shunt conductance is normally not considered for the transmission line modeling
  • 14. TRANSMISSION LINE PARAMETERS CONT’D Transmission lines are classified in to short, medium and long groups according to the length of the transmission lines. The performance of one or more of the parameters of a line is governed by its length and conductor configuration. For overhead lines up to 80 km the capacitance C and shunt conductance G are negligibly small but for cable lines where the distance between the conductors is small, the effect of capacitance can not ignored. All low-voltage overhead lines having lengths up to 80 km are generally classified as Short lines. The lines ranging in length from 80 to 240 km are termed as Medium or moderately long lines. For these lines, the capacitance of the line cannot be neglected and it’s considered to be lumped at one or more points of the line. The effect of capacitance is more at higher frequency. The leakage conductance or leakance is neglected. The term Long line refers to a line having its length more than 240 km. The long line treatment takes all the four parameters in to account and allows for the fact that they are distributed uniformly over the entire length of the line.
  • 15. Short Transmission line Equivalent Circuit (Series Impedance parameters only) Medium Transmission line Equivalent Circuit (Series Impedance and Shunt Capacitance Long Transmission line Equivalent Circuit ( All the four TL Parameters) TRANSMISSION LINE PARAMETERS CONT’D
  • 16. 2.2.1 RESISTANCE The AC resistance of a conductor in a transmission line is based on the calculation of its DC resistance. If DC current is flowing along a round cylindrical conductor, the current is uniformly distributed over its cross-section area and its DC resistance is evaluated by RDC =  l /A [Ω] Where l is the length of conductor; A – cross-sectional area,  is the resistivity of the conductor. Therefore, the DC resistance per meter of the conductor is rDC =  /A [Ω/m] The resistivity of a conductor is a fundamental property of the material that the conductor is made from. It varies with both type and temperature of the material. At the same temperature, the resistivity of aluminum is higher than the resistivity of copper.
  • 17. LINE RESISTANCE CONT’D  If AC current is flowing, rather than DC current, the following factors need to be considered: 1. Frequency or skin effect 2. Temperature 3. Spiraling of stranded conductors 4. Bundle conductors arrangement 5. Proximity effect 6. Also the resistance of magnetic conductor varies with current magnitude. A. Skin Effect  The frequency of the AC voltage produces effect on the conductor resistance due to the non uniform distribution of the current. This phenomenon is known as skin effect or frequency effect.  As frequency increases, the current tends to go toward the surface of the conductor and the current density decreases at the center.  Skin effect reduces the effective cross-section area used by the current, and thus, the effective resistance increases.  Also, although in small amount, a further resistance increase occurs when other current-carrying conductors are present in the immediate vicinity.
  • 18.  A skin correction factor k, obtained by differential equations and Bessel functions, is considered to reevaluate the AC resistance.  For 60 Hz, k is estimated around 1.02 𝑅𝐴𝐶=𝑘𝑅𝐷𝐶 B. Temperature Effect  The resistivity of any conductive material varies linearly over an operating temperature, and therefore, the resistance of any conductor suffers the same variations.  As temperature rises, the conductor resistance increases linearly, over normal operating temperatures, according to the following equation: Where R2 is the resistance at second temperature t2 R1 is the resistance at initial temperature t1 T is the temperature coefficient for the particular material (C°)
  • 19. RESISTANCE CONT’D The resistivity increases linearly with temperature over normal range of temperatures. If the resistivity at one temperature is known, the resistivity at another temperature can be found from T2 = (T+t2) /(T+t1)T1 Where t1 and t1 are temperature 1 in oC and the resistivity at that temperature, t2 and t2 are temperature 2 in oC and the resistivity at that temperature, and T is the temperature constant. Resistivity (𝜌) and temperature coefficient (T) constants depend upon the particular conductor material Material Resistivity at 20oC [m] Temperature constant [oC] Annealed copper 1.7210-8 234.5 Hard-drawn copper 1.7710-8 241.5 Aluminum 2.8310-8 228.1 -8
  • 20. We notice that silver and copper would be among the best conductors. However, aluminum, being much cheaper and lighter, is used to make most of the transmission line conductors. Conductors made out of aluminum should have bigger diameter than copper conductors to offset the higher resistivity of the material and, therefore, support the necessary currents. AC resistance of a conductor is always higher than its DC resistance due to the skin effect forcing more current flow near the outer surface of the conductor. The higher the frequency of current, the more noticeable skin effect would be. At frequencies of our interest (50-60 Hz), however, skin effect is not very strong. Wire manufacturers usually supply tables of resistance per unit length at common frequencies (50 and 60 Hz). Therefore, the resistance can be determined from such tables. RESISTANCE CONT’D
  • 21. C. Spiraling and Bundle Conductor Effect •Overhead conductors, made of naked metal and suspended on insulators, are preferred over underground conductors because of the lower cost and easy maintenance. Also, overhead transmission lines use aluminum conductors, because of the lower cost and lighter weight compared to copper conductors, although more cross-section area is needed to conduct the same amount of current. •There are different types of commercially available aluminum conductors: aluminum-conductor-steel-reinforced (ACSR), aluminum-conductor-alloy- reinforced (ACAR), all-aluminum-conductor (AAC), and all-aluminumalloy- conductor (AAAC). Figure 3: Stranded aluminum conductor with stranded steel core (ACSR).
  • 22.  ACSR is one of the most used conductors in transmission lines. • It consists of alternate layers of stranded conductors, spiraled in opposite directions to hold the strands together, surrounding a core of steel strands.  The purpose of introducing a steel core inside the stranded aluminum conductors is to obtain a high strength-to-weight ratio.  A stranded conductor offers more flexibility and easier to manufacture than a solid large conductor. However, the total resistance is increased because the outside strands are larger than the inside strands on account of the spiraling.  The resistance of each wound conductor at any layer, per unit length, is based on its total length as follows: Resistance Cont’d
  • 23.  where 𝑅𝑐𝑜𝑛𝑑: resistance of wound conductor (Ω)  : : length of wound conductor (m)  𝑃𝑐𝑜𝑛𝑑=𝑙t𝑢𝑟n /2𝑟𝑙𝑎𝑦𝑒𝑟 relative pitch of wound conductor  𝑙𝑡𝑢𝑟𝑛 : length of one turn of the spiral (m)  2𝑟𝑙𝑎𝑦𝑒𝑟: diameter of the layer (m)  The parallel combination of n conductors, with same diameter per layer, gives the resistance per layer as follows: Similarly, the total resistance of the stranded conductor is evaluated by the parallel combination of resistances per layer.
  • 24.  In high-voltage transmission lines, there may be more than one conductor per phase (bundle configuration) to increase the current capability and to reduce corona effect discharge.  Corona effect occurs when the surface potential gradient of a conductor exceeds the dielectric strength of the surrounding air (30 kV/cm during fair weather), producing ionization in the area close to the conductor, with consequent corona losses, audible noise, and radio interference.  As corona effect is a function of conductor diameter, line configuration, and conductor surface condition, then meteorological conditions play a key role in its evaluation.  Corona losses under rain or snow, for instance, are much higher than in dry weather.
  • 25. Figure: Stranded conductors arranged in bundles per phase of (a) two, (b) three, and (c) four. • Corona, however, can be reduced by increasing the total conductor surface. Although corona losses rely on meteorological conditions, their evaluation takes into account the conductance between conductors and between conductors and ground. •By increasing the number of conductors per phase, the total cross-section area increases, the current capacity increases, and the total AC resistance decreases proportionally to the number of conductors per bundle. •Conductor bundles may be applied to any voltage but are always used at 345 kV and above to limit corona. • T o maintain the distance between bundle conductors along the line, spacers made of steel or aluminum bars are used.
  • 26. 26 D. PROXIMITY EFFECTS  In a transmission line there is a non-uniformity of current distribution caused by a higher current density in the elements of adjacent conductors nearest each other than in the elements farther apart. The phenomenon is known as proximity effect.  It is present for three-phase as well as single-phase circuits.  For the usual spacing of overhead lines at 60 Hz, the proximity effect is neglected.
  • 27. 27 EXAMPLE 1  A three phase transmission line is designed to deliver 190.5 MVA at 220 kV over a distance of 63 km. the total transmission loss is not to exceed 2.5 percent of the rated line MVA. If the resistivity of the conductor material at 20°c is 2.8×10⁻⁸Ωm , determine the required conductor diameter and the conductor size. Solution
  • 28. 28  The inductive reactance is by far the most dominating impedance element.  A current-carrying conductor produces a magnetic field around the conductor.  The magnetic flux lines are concentric closed circles with direction given by the right hand rule. With the thumb pointing in the direction of the current, the fingers of the right hand encircled the wire point in the direction of the magnetic field.  When the current changes, the flux changes and a voltage is induced in the circuit.  By definition, for nonmagnetic material, the inductance L is the ratio of its total magnetic flux linkage to the current I, given by 2.2.2 Inductance and Inductive Reactance
  • 29. The series inductance of a transmission line consists of two components: internal and external inductances, which are due the magnetic flux inside and outside the conductor respectively. The inductance of a transmission line is defined as the number of flux linkages [Wb-turns] produced per ampere of current flowing through the line: L = λ / I 1. Internal inductance: Consider a conductor of radius r carrying a current I. At a distance x from the center of this conductor, the magnetic field intensity Hx can be found from Ampere’s law: CONT’D
  • 30. INDUCTANCE AND INDUCTIVE REACTANCE CONT’D Where Hx is the magnetic field intensity at each point along a closed path, dl is a unit vector along that path and Ix is the net current enclosed in the path. For the homogeneous materials and a circular path of radius x, the magnitude of Hx is constant, and dl is always parallel to Hx. Therefore: Assuming next that the current is distributed uniformly in the conductor: Thus, the magnetic intensity at radius x inside the conductor is I
  • 31. The flux density at a distance x from the center of the conductor is The differential magnetic flux contained in a circular tube of thickness dx and at a distance x from the center of the conductor is The flux linkages per meter of length due to flux in the tube is the product of the differential flux and the fraction of current linked: INDUCTANCE AND INDUCTIVE REACTANCE CONT’D
  • 32. The total internal flux linkages per meter can be found via integration… Therefore, the internal inductance per meter is: L = λ/I If the relative permeability of the conductor is 1 (non-ferromagnetic materials, such as copper and aluminum), the permeability reduces to INDUCTANCE AND INDUCTIVE REACTANCE CONT’D Where μ0 = 4л*10-7
  • 33. 2. EXTERNAL INDUCTANCE BETWEEN 2 POINTS OUTSIDE OF THE LINE To find the inductance external to a conductor, we need to calculate the flux linkages of the conductor due only the portion of flux between two points P1 and P2 that lie at distances D1 and D2 from the center of the conductor. In the external to the conductor region, the magnetic intensity at a distance x from the center of conductor is since all the current is within the tube, Ix = I. The flux density at a distance x from the center of conductor is
  • 34. The differential magnetic flux contained in a circular tube of thickness dx and at a distance x from the center of the conductor is The flux links the full current carried by the conductor, therefore: The total external flux linkages per meter can be found via integration… The external inductance per meter is The inductance between two points external to a conductor For non-ferromagnetic materials is then
  • 35. 3. INDUCTANCE OF A SINGLE-PHASE 2-WIRE TRANSMISSION LINE We determine next the series inductance of a single-phase line consisting of two conductors of radii r spaced by a distance D and both carrying currents of magnitude I flowing into the page in the left-hand conductor and out of the page in the right-hand conductor. Considering two circular integration paths, we notice that the line integral along x1 produces a net magnetic intensity since a non-zero net current is enclosed by x1. Thus: Since the path of radius x2 encloses both conductors and the currents are equal and opposite, the net current enclosed is 0 and, therefore, there are no contributions to the total inductance from the magnetic fields at distances greater than D.
  • 36. The total inductance of a wire per unit length in this transmission line is a sum of the internal inductance and the external inductance between the conductor surface (r) and the separation distance (D): By symmetry, the total inductance of the other wire is the same, therefore, the total inductance of a two-wire transmission line is Where r is the radius of each conductor and D is the distance between conductors. INDUCTANCE OF A SINGLE-PHASE 2-WIRE TRANSMISSION LINE CONT’D The flux beyond D links a net current of zero and does not contribute to the net magnetic flux linkage in the circuit. Thus, to obtain the inductance of conductor 1 due to the net external flux linkage, it is necessary to evaluate external inductance from 𝐷1=𝑟1 to 𝐷2=𝐷.
  • 37. 37
  • 38. 38
  • 39. 39
  • 40. 40 FLUX LINKAGE IN TERMS OF SELF AND MUTUAL INDUCTANCE The series inductance per phase for the above single phase two wire line can be expressed in terms of self inductance of each conductor and their mutual inductance. Consider one meter length of the single phase circuit represented by two coils characterized by the self inductances 𝐿11 and 𝐿22 and the mutual inductance 𝐿12 . The magnetic polarity is indicated by dot symbols as shown in the following Figure . The single phase line viewed as two magnetically coupled coils
  • 41. 41 Comparing the above questions with the external inductance of a conductor (Lext = 2x10⁻⁷ln(D2/D1) H/m), we conclude the following equivalent expressions for the self and mutual inductances:
  • 42. 42 4. INDUCTANCE OF THREE PHASE TRANSMISSION LINES -SYMMETRICAL SPACING Consider one meter length of a three phase line with three conductors, each with radius r, symmetrically spaced in a triangular configuration as shown in the following Figure.
  • 43. 43
  • 44. 44 5. INDUCTANCE OF THREE PHASE TRANSMISSION LINES -ASYMMETRICAL SPACING Practical transmission lines cannot maintain symmetrical spacing of conductors because of construction considerations. With asymmetrical spacing, even with balanced currents, the voltage drop due to the line inductance will be unbalanced. Consider one meter length of a three phase line with three conductors, each with radius r. the conductors are asymmetrically spaced with distances shown in the following Figure. Three phase line with asymmetrical spacing.
  • 46. 46 6. TRANSPOSE LINE The equilateral triangular spacing configuration is not the only configuration commonly used in practice. Thus the need exists for equalizing the mutual inductances. One means for doing this is to construct transpositions or rotations of overhead line wires. A transposition is a physical rotation of the conductors, arranged so that each conductor is moved to occupy the next physical position in a regular sequence such as a-b-c, b-c-a, c-a-b, etc. Such a transposition arrangement is shown in the following Figure. If a section of line is divided into three segments of equal length separated by rotations, we say that the line is “completely transposed.” A transposed three phase line
  • 47. 47
  • 48. 48 INDUCTANCE OF COMPOSITE CONDUCTORS In the evaluation of inductance, solid round conductors were considered. However, in practical transmission lines, stranded conductors are used. Also, for reasons of economy, most EHV lines are constructed with bundled conductors. In this section an expression is found for the inductance of composite conductors. The result can be used for evaluating the GMR of stranded or bundled conductors. It is also useful in finding the equivalent GMR and GMD of parallel circuits.
  • 49. 49
  • 50. 50
  • 51. 51
  • 52. 52
  • 53. 53
  • 54. 54 7. INDUCTANCE OF THREE PHASE DOUBLE CIRCUIT LINE A three double circuit line consists of two identical three phase circuits. The circuits are opened with 𝑎1−𝑎2,𝑏1−𝑏2 𝑎𝑛𝑑 𝑐1−𝑐2 in parallel. Because of geometrical differences between conductors, voltage drop due to line inductance will be unbalanced. To achieve balance, each phase conductor must be transposed within its group and with respect to parallel three phase line. Consider a three phase double circuit line with relative phase positions 𝑎1𝑏1𝑐1−𝑐2 𝑏2𝑎2, as shown in the following Figure
  • 55. 55
  • 56. 56
  • 57. INDUCTANCE OF A TRANSMISSION LINE CONT’D A two-conductor bundle A four-conductor bundle
  • 58. CONCLUSIONS ON INDUCTANCE OF A TRANSMISSION LINE Analysis of the above equations show that: 1. The greater the spacing between the phases of a transmission line, the greater the inductance of the line. Since the phases of a high-voltage overhead transmission line must be spaced further apart to ensure proper insulation, a high-voltage line will have a higher inductance than a low-voltage line. Since the spacing between lines in buried cables is very small, series inductance of cables is much smaller than the inductance of overhead lines. 1. The greater the radius of the conductors in a transmission line, the lower the inductance of the line. In practical transmission lines, instead of using heavy and inflexible conductors of large radii, two and more conductors are bundled together to approximate a large diameter conductor. The more conductors included in the bundle, the better the approximation becomes. Bundles are often used in the high-voltage transmission lines.
  • 59. INDUCTIVE REACTANCE OF A LINE The series inductive reactance of a transmission line depends on both the inductance of the line and the frequency of the power system. Denoting the inductance per unit length as l, the inductive reactance per unit length will be where f is the power system frequency. Therefore, the total series inductive reactance of a transmission line can be found as where d is the length of the line. xI = jωɭ = j2лfɭ XI = xId
  • 60. 2.2.3 CAPACITANCE AND CAPACITIVE REACTANCE Since a voltage V is applied to a pair of conductors separated by a dielectric (air), charges of equal magnitude but opposite sign will accumulate on the conductors. Transmission line conductors exhibit capacitance with respect to each other due to the potential difference between them. The amount of capacitance between conductors is a function of conductor size, spacing, and height above ground. By definition, the capacitance C is the ratio of charge q to the voltage v, given by In AC power systems, a transmission line carries a time-varying voltage different in each phase. This time-varying voltage causes the changes in charges stored on conductors. Changing charges produce a changing current, which will increase the current through the transmission line and affect the power factor and voltage drop of the line. This changing current will flow in a transmission line even if it is open circuited.
  • 61. Consider a long round conductor with radius r, carrying a charge of q coulombs per meter length as shown in the following Figure. Electric field around a long round conductor. The charge on the conductor gives rise to an electric field with radial flux lines. The total electric flux is numerically equal to the value of charge on the conductor. The intensity of the field at any point defined as the force per unit charge and is termed electric field intensity designated as E. Concentric cylinders surrounding the conductor are equipentential surfaces and have the same electric flux density.
  • 62. The electric flux density D may be found from the relation: From Gauss’s law for one meter length of the conductor, the electric flux density at a cylinder of a radius x is given by where A specifies a closed surface; dA is the unit vector normal to the surface; q is the charge inside the surface; D is the electric flux density at the surface: where E is the electric field intensity at that point;  is the permittivity of the material: Where r is Relative permittivity of the material The permittivity of free space 0 = 8.8510-12 F/m Ԑ = ԐrԐo
  • 63. Electric flux lines radiate uniformly outwards from the surface of the conductor with a positive charge on its surface. In this case, the flux density vector D is always parallel to the normal vector dA and is constant at all points around a path of constant radius r. Therefore: were l is the length of conductor; q is the charge density; Q is the total charge on the conductor. Then the flux density is The electric field intensity is Capacitance and capacitive reactance Cont’d
  • 64. The potential difference between two points P1 and P2 can be found as where dl is a differential element tangential to the integration path between P1 and P2. The path is irrelevant. Selection of path can simplify calculations. For P1 - Pint, vectors E and dl are parallel; therefore, Edl = Edx. For Pint – P2 vectors are orthogonal, therefore Edl = 0. CAPACITANCE AND CAPACITIVE REACTANCE CONT’D
  • 65. 2.3.1 CAPACITANCE OF A SINGLE PHASE TWO-WIRE TRANSMISSION LINE The potential difference due to the charge on conductor a can be found as Similarly, the potential difference due to the charge on conductor b is or
  • 66. The total voltage between the lines is Since q1 = q2 = q, the equation reduces to The capacitance per unit length between the two conductors of the line is CAPACITANCE OF A SINGLE PHASE TWO-WIRE TRANSMISSION LINE CONT’D
  • 67. Thus: Which is the capacitance per unit length of a single-phase two-wire transmission line. The above Equation gives the line to line capacitance between conductors. For the purpose of transmission line modeling, it is convenient to define a capacitance C between each conductor and a neural as illustrated in below. The potential difference between each conductor and the ground (or neutral) is one half of the potential difference between the two conductors. Therefore, the capacitance to ground of this single-phase transmission line will be CAPACITANCE OF A SINGLE PHASE TWO-WIRE TRANSMISSION LINE CONT’D
  • 68. Recalling 𝜖0=8.85×10⁻¹² 𝐹/𝑚 and converting to 𝜇𝐹 per kilometer, we have Analysis of the above final equation shows that: 1. The greater the spacing between the phases of a transmission line, the lower the capacitance of the line. Since the phases of a high-voltage overhead transmission line must be spaced further apart to ensure proper insulation, a high-voltage line will have a lower capacitance than a low-voltage line. Since the spacing between lines in buried cables is very small, shunt capacitance of cables is much larger than the capacitance of overhead lines. Cable lines are normally used for short transmission lines (to min capacitance) in urban areas. 2. The greater the radius of the conductors in a transmission line, the higher the capacitance of the line. Therefore, bundling increases the capacitance. Good transmission line is a compromise among the requirements for low series inductance, low shunt capacitance, and a large enough separation to provide insulation between the phases.
  • 69. SHUNT CAPACITIVE ADMITTANCE The shunt capacitive admittance of a transmission line depends on both the capacitance of the line and the frequency of the power system. Denoting the capacitance per unit length as c, the shunt admittance per unit length will be The total shunt capacitive admittance therefore is where d is the length of the line. The corresponding capacitive reactance is the reciprocal to the admittance: 1 1 2 C C Z j Y fcd    
  • 70. POTENTIAL DIFFERENCE IN A MULTICONDUCTOR CONFIGURATION Consider n parallel long conductors with charges 𝑞1,𝑞2,…,𝑞𝑛 coulombs/meter as shown in Multi-conductor configuration. Assume that the distortion effect is negligible and charge is uniformly distributed around the conductor, with the following constraint
  • 71. Using superposition, the potential difference between conductor I and j due to the presence of all charges is given by: When k=I, 𝐷𝑖𝑖 is the distance between the surface of the conductor and its center, namely its radius r. CAPACITANCE OF THREE PHASE LINES Consider one meter length of a three phase line with three long conductors, each with radius r, with conductor spacing as shown in the following figure:
  • 72. For a balanced three phase system We shall neglect the effect of ground and the shield wires. Assume that the lines is transposed. We proceed with the calculation of the potential difference between a and b for each section of transposition. Applying ( 80) to the first section of the transposition, 𝑉_𝑎𝑏 is
  • 73.
  • 74.
  • 75. EFFECT OF EARTH ON THE CAPACITANCE For an isolated charged conductor the electric flux lines are radial and are orthogonal to the cylindrical equipotential surfaces. The presence of earth will alter the distribution of electric flux lines and equipotential surfaces, which will change the effective capacitance of the line. The earth level is an equipotential surface, therefore the flux lines are forced to cut the surface of the earth orthogonally. The effect of the presence of earth can be accounted for by the method of image charges introduced by Kelvin.
  • 76. To illustrate this method, consider a conductor with a charge q coulombs/meter at a high H above ground. Also, imagine a charge –q at a depth –H below the surface of earth. This configuration without the presence of the earth surface will produce the same field distribution as a single charge and the earth surface. Thus, the earth can be replaced for the calculation of electric field potential by a fictitious charged conductor with charge equal and opposite to the charge on the actual conductor and at a depth below the surface of the earth the same as the height of the actual conductor above earth. This, imaginary conductor is called the image of the actual conductor.
  • 77. The effect of the earth is to increase the capacitance. But normally the height of the conductor is large as compared to the distance between the conductors, and the earth effect is negligible. Therefore, for all line models used for balanced steady state analysis, the effect of earth on the capacitance can be neglected. However, for unbalanced analysis such as unbalanced faults, the earth’s effect as well as the shield wires should be considered. Example 1: If a single phase line has parameters D=5ft, r=0.023 ft, and a flat horizontal spacing H=18ft average line height, determine the effect of the earth on capacitance. Assume a perfectly conducting earth plane.
  • 78. Solution: The earth plane is replaced by a separate image for each overhead conductor, and the conductors are charged as shown in the above figure. The voltages between conductors x and y is:
  • 79. Example 2: A 500kV three phase transposed line is composed of one ACSR 1,272,000 cmil, 45/7 Bittern conductor per phase with horizontal conductor configuration as shown in the following Figure. The conductors have a diameter of 1.345 in and a GMR of 0.5328 in. find the inductance and capacitance per phase per kilometer of the line. Figure: conductor layout for the three phase transmission line
  • 80.
  • 81. EXAMPLE 3: An 8000 V, 60 Hz, single-phase, transmission line consists of two hard- drawn aluminum conductors with a radius of 2 cm spaced 1.2 m apart. If the transmission line is 30 km long and the temperature of the conductors is 200C, a. What is the series resistance per kilometer of this line? b. What is the series inductance per kilometer of this line? c. What is the shunt capacitance per kilometer of this line? d. What is the total series reactance of this line? e. What is the total shunt admittance of this line? Solution: a. The series resistance of the transmission line is l R A   Ignoring the skin effect, the resistivity of the line at 200 will be 2.8310-8 - m and the resistance per kilometer of the line is 8 2 2.83 10 1000 0.0225 0.02 l r km A          
  • 82. SOLUTION CONT’D b. The series inductance per kilometer of the transmission line is 3 1 1 1.2 ln 1000 ln 1000 1.738 10 4 4 0.02 D l H km r                           c. The shunt capacitance per kilometer of the transmission line is 12 9 8.854 10 1000 1000 6.794 10 1.2 ln ln 0.02 ab c F km D r              d. The series impedance per kilometer of the transmission line is 3 2 0.0225 2 60 1.738 10 0.0225 0.655 se z r jx r j fl j j km                Then the total series impedance of the line is   0.0225 0.655 30 0.675 19.7 se Z j j      
  • 83. e. The shunt admittance per kilometer of the transmission line is 9 6 2 2 60 6.794 10 2.561 10 C y j fc j j S m             The total shunt admittance will be   6 5 2.561 10 30 7.684 10 se Y j j S         The corresponding shunt capacitive reactance is 5 1 1 13.0 7.684 10 sh sh Z j k Y j         SOLUTION CONT’D