

Recomendados
Recomendados
Más contenido relacionado
Más de FirstBank, Nigeria
Más de FirstBank, Nigeria (16)
Último
Último (20)
FirstBank H1 2011 Result
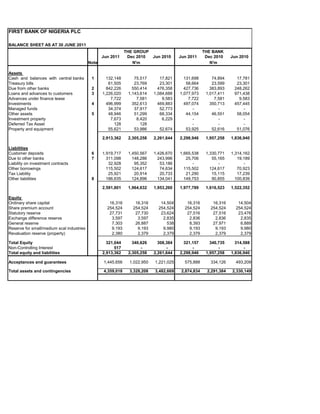
- 1. FIRST BANK OF NIGERIA PLC BALANCE SHEET AS AT 30 JUNE 2011 THE GROUP THE BANK Jun 2011 Dec 2010 Jun 2010 Jun 2011 Dec 2010 Jun 2010 Note N'm N'm Assets Cash and balances with central banks 1 132,148 75,517 17,821 131,698 74,894 17,781 Treasury bills 61,505 23,769 23,301 58,664 23,599 23,301 Due from other banks 2 842,226 550,414 476,358 427,736 383,893 248,262 Loans and advances to customers 3 1,226,020 1,143,614 1,084,688 1,077,973 1,017,411 971,438 Advances under finance lease 7,722 7,581 9,583 7,722 7,581 9,583 Investments 4 496,999 352,613 469,883 497,074 350,713 457,445 Managed funds 34,374 37,917 52,773 - - - Other assets 5 48,946 51,299 68,334 44,154 46,551 58,054 Investment property 7,673 8,420 6,229 - - - Deferred Tax Asset 128 128 - - - Property and equipment 55,621 53,986 52,674 53,925 52,616 51,076 2,913,362 2,305,258 2,261,644 2,298,946 1,957,258 1,836,940 Liabilities Customer deposits 6 1,919,717 1,450,567 1,426,670 1,665,538 1,330,771 1,314,162 Due to other banks 7 311,098 148,286 243,996 25,706 55,165 19,189 Liability on investment contracts 32,928 95,352 53,186 - - - Other borrowings 115,502 124,617 74,634 115,502 124,617 70,923 Tax Liability 25,921 20,914 20,733 21,290 15,115 17,239 Other liabilities 8 186,635 124,896 134,041 149,753 90,855 100,839 2,591,801 1,964,632 1,953,260 1,977,789 1,616,523 1,522,352 Equity Ordinary share capital 16,316 16,316 14,504 16,316 16,316 14,504 Share premium account 254,524 254,524 254,524 254,524 254,524 254,524 Statutory reserve 27,731 27,730 23,624 27,516 27,516 23,476 Exchange difference reserve 3,597 3,597 2,835 2,836 2,836 2,835 General reserve 7,303 26,887 538 8,393 27,971 6,889 Reserve for small/medium scal industries 9,193 9,193 9,980 9,193 9,193 9,980 Revaluation reserve (property) 2,380 2,379 2,379 2,379 2,379 2,379 Total Equity 321,044 340,626 308,384 321,157 340,735 314,588 Non-Controlling Interest 517 - - - - - Total equity and liabilities 2,913,362 2,305,258 2,261,644 2,298,946 1,957,258 1,836,940 Acceptances and guarantees 1,445,656 1,022,950 1,221,025 575,888 334,126 493,209 Total assets and contingencies 4,359,018 3,328,208 3,482,669 2,874,834 2,291,384 2,330,149
- 2. PROFIT AND LOSS ACCOUNT FOR THE PERIOD ENDED 30 JUNE 2011 THE GROUP THE BANK YTD YTD Jun' 2011 Jun' 2010 Jun' 2011 Jun' 2010 Note N'm N'm Gross Earnings 139,698 122,282 123,744 104,244 Interest and similar income 9 107,046 94,190 96,550 83,877 Interest and similar expense 10 (18,805) (36,695) (13,582) (30,415) Net Interest income 88,241 57,495 82,968 53,462 Other income 11 32,652 28,092 27,194 20,367 Operating income 120,893 85,587 110,162 73,829 Operating expenses 12 (70,802) (54,855) (65,375) (48,768) Diminution in asset values (14,361) 955 (13,782) (3,772) Profit before Exceptional item and taxation 35,730 31,687 31,005 21,289 Exceptional item - - - - Profit after exceptional item 35,730 31,687 31,005 21,289 Taxation (4,466) (6,337) (3,876) (4,258) Profit after taxation 31,264 25,350 27,129 17,031 Non-Controlling Interest (50) - - - Profit attributable to the group 31,214 25,350 27,129 17,031
- 3. FIRST BANK OF NIGERIA PLC NOTES TO THE ACCOUNT FOR THE PERIOD ENDED: THE GROUP THE BANK YTD Audited YTD Audited Jun' 2011 Dec' 2010 Jun' 2011 Dec' 2010 N'million N'million N'million N'million NOTES TO THE ACCOUNT 1 Cash and balances with the Central Bank Cash 36,308 33,156 36,089 32,533 Balances with CBN 95,840 42,361 95,609 42,361 132,148 75,517 131,698 74,894 Provision for cash balances - - - - Total Cash and balances with the Central Bank 132,148 75,517 131,698 74,894 2 Due from other banks In Nigeria 562,574 441,428 160,937 274,006 Other Banks and Offices outside Nigeria 279,654 108,990 266,799 109,887 842,228 550,418 427,736 383,893 Provision for balances due from other banks (2) (4) - - Total Due from other banks 842,226 550,414 427,736 383,893 3 Loans and advances Loans 1,126,662 1,053,592 976,543 947,392 Overdraft 151,142 169,370 148,742 143,384 Total Gross Loans and advances 1,277,804 1,222,962 1,125,285 1,090,776 Loan loss provision (35,411) (54,366) (32,565) (49,759) Interest in suspense (16,373) (24,982) (14,747) (23,606) Net Loans and advances 1,226,020 1,143,614 1,077,973 1,017,411 4 Investment Investment In Bonds 433,339 263,432 408,701 266,377 Investment in securities 87,468 112,100 62,127 57,640 Investment in Subsidiaries/Associates 5,456 7,456 33,190 33,640 Total Investment securities 526,263 382,988 504,018 357,657 Provision on diminution of investment (29,264) (30,375) (6,944) (6,944) Total Investment securities 496,999 352,613 497,074 350,713 5 Other assets Fraud 2,243 2,084 2,243 2,084 Interest and fee receivable 9,505 2,069 7,898 1,679 Prepayments 8,599 5,359 7,624 4,340 Due from clients (Premium debtors & Receivable from Underwriters) 806 579 - - Accounts receivable 10,307 22,021 9,476 20,134 Deferred acquisition expenses 12,541 12,364 12,524 12,345 Inventory 1,748 1,868 1,704 1,814 BDC Trading stock 37 184 - - Other receivables 3,494 8,706 2,621 7,602 Deposit for investments by subsidiaries - 15 - - Deposit with the Nigerian Stock Exchange - 1 - - Mandatory deposit with CBN/NDIC dep ins premium - 30 - - NDIC deposit insurance premium 3,665 - 3,663 - 52,945 55,280 47,753 49,998 Provision for doubtful receivables (3,999) (3,981) (3,599) (3,447) Total Other Assets 48,946 51,299 44,154 46,551
- 4. THE GROUP THE BANK YTD Audited YTD Audited Jun' 2011 Dec' 2010 Jun' 2011 Dec' 2010 N'million N'million N'million N'million 6 Customer deposits Current deposits 802,827 607,724 695,506 574,415 Savings deposits 476,056 387,808 465,396 386,913 Term deposits 324,124 276,250 187,926 190,658 Domiciliary deposit 315,118 177,497 315,118 177,497 Electronic purse 1,592 1,288 1,592 1,288 Total Deposit 1,919,717 1,450,567 1,665,538 1,330,771 7 Due to other banks Due to banks in Nigeria 261,662 148,049 14,960 54,928 Due to banks outside Nigeria 49,436 237 10,746 237 Total Due to other banks 311,098 148,286 25,706 55,165 8 Other liabilities Fraud and losses 2,242 2,084 2,242 2,084 Customers' deposit for letters of credit 65,884 41,885 65,884 41,885 Deposit for foreign currency - 1,780 - 1,780 Unapproprided Profit 31,264 27,129 Interest payable 2,931 266 2,725 197 Account payables 16,880 17,892 15,363 13,552 Unearned discounts 4,243 2,270 3,857 2,270 Proceeds from public offers 820 806 5 5 Provision and accruals 17,079 6,014 14,502 4,014 Bank cheques 11,738 14,268 11,738 14,268 Provision on losses for off balance sheet items 39 39 39 39 Collection on behalf of third parties 6,233 4,193 4,443 4,193 Premium payable -NDIC - 685 - - Trade creditors 17,135 8,208 - - Clients' dividend - 17,027 - - Exchange Equalisdion 4,193 - 566 - Sundry creditors 5,954 7,479 1,260 6,568 Total Other Liabilities 186,635 124,896 149,753 90,855
- 5. FIRST BANK OF NIGERIA PLC NOTES TO THE ACCOUNT FOR THE PERIOD ENDED: NOTE THE GROUP THE BANK YTD YTD YTD YTD Jun' 2011 Jun' 2010 Jun' 2011 Jun' 2010 N'million N'million N'million N'million Interest and similar income 9 Placements 10,115 9,417 6,584 5,381 Treasury bills and investment securities 18,127 13,986 17,067 13,983 Loans and advances 78,804 70,787 72,899 64,513 Total Interest and similar income 107,046 94,190 96,550 83,877 Interest and similar expense 10 Current accounts 13,078 15,280 8,352 10,210 Savings accounts 1,714 3,199 1,701 3,182 Time deposits 2,807 17,664 2,323 16,471 Domiciliary deposits 1,206 552 1,206 552 Total Interest and similar expense 18,805 36,695 13,582 30,415 Other Income 11 Fees and Commissions 25,602 24,119 21,757 17,928 Others 7,050 3,973 5,437 2,439 32,652 28,092 27,194 20,367 Operating expenses 12 Staff costs 37,434 26,368 34,728 23,725 Depreciation on fixed assets 4,285 4,096 4,013 3,838 Deposit insurance premium 2,889 3,734 2,863 3,734 Other operating expenses 26,194 20,657 23,771 17,471 Total Operating expenses 70,802 54,855 65,375 48,768
- 6. FIRST BANK OF NIGERIA PLC STATEMENT OF CASH FLOWS FOR THE PERIOD ENDED The Group The Bank June June June June 2011 2010 2011 2010 N'million N'million N'million N'million Cash flows from operating activities Net cash from/(used in) operating activities 554,837 94,230 356,139 119,399 Cash flows from investing activities Net cash from investing activities (97,733) (226,687) (89,551) (194,359) Cash flows from financing activities Net cash (used in)/from financing activities 21,289 (2,021) 25,000 (1,533) Net increase in cash and cash equivalents 478,393 (134,478) 291,588 (76,493) Cash and cash equivalents at 1 July 495,983 630,461 267,847 344,340 Cash and cash equivalents at 30th June 974,376 495,983 559,435 267,847