SlideShare una empresa de Scribd logo
1 de 8
CTA database

White label CTA databases

Customized performance reporting

Website development

Customer relationship management
Add to watchlist                                                                                                                 Download program report in PDF


ACE Investments Strategists, LLC
Aggressive Stock Index Premium Collection

                            GENERAL INFORMATION                                                                        COMPANY INFO

 Min. Investment                       100,000 USD (notional funding: 90%)           Name                                       ACE Investments Strategists, LLC
 AUM                                                           3,800,000 USD         Principal                                                     Yu-Dee Chang
 Management Fee                                                              2%      Phone                                                       +1 703 893 8808
 Incentive Fee                                                              25%      Email                                               info@investwithace.com
 RT per Million                                                              N/A     NFA ID                                                              331001
 Margin to Equity                                                            N/A     Number of Accounts                                                    1450
 Legal Structure                                             Managed account         NAV calculated by                                                      N/A
 Highwater Mark                                                              yes     Company Documents
 Inv. Restrictions                                                         none      Disclosure Document
 Inv. Style                                             Option writing / indices     Video Presentation
                                                                                                                                                 Contact the CTA
                                                                      MONTHLY PERFORMANCE

               JAN        FEB         MAR         APR         MAY          JUN       JUL         AUG           SEP        OCT         NOV        DEC      YEAR
 2005                                                                                -3.36        1.54         3.37       -1.37        0.77       1.46      2.29
 2006          0.87        1.78       4.72        -0.01       -3.73        1.75      -0.77        6.76         1.46        2.79       -0.84       2.70     18.48
 2007          6.68      -14.76     -13.82        -3.64        9.90        3.90      -8.71       -9.30        10.61        4.82        4.59      13.33     -1.88
 2008         -15.93       9.03       6.69        7.32         7.01        3.63       2.09        2.88        -48.40     -28.95       -1.99      11.47    -51.04
 2009          0.06        5.13       -3.31      10.96         7.80        6.43      -5.97        4.53         1.95       -0.39        3.66       7.10     43.49
 2010          3.17        2.29       2.51        -1.90      -14.71        4.74      -0.72        3.62         1.53                                        -0.98

                                                                      STRATEGY DESCRIPTION
 The objective of this strategy is to achieve returns superior to those of the core SIPC strategy, primarily by exploiting rising volatility levels, when they
 occur, in a more aggressive way. This strategy uses all the basics of the core SIPC system, selling put and call options on the S&P 500 future to
 collect premiums. ASIPC will differ from the "core" mainly in that it will, at opportune times, and with suitable moderation, select option strike prices
 closer to the market in order to collect higher premiums and improve performance. An added risk in this approach is the degree to which the market
 is more likely to impend on strike prices. Offsetting that risk is the experienced judgment of the Advisor, his ability to make quick decisions and to
 execute them in the interest of capitalizing on an opportunity by hedging (taking a long or short position in the underlying futures contract) or trading
 out of the potential trouble. The plan is to trade in a more aggressive way only when volatility and other market conditions are optimum. Adequate
 market volatility is essential to the success of the strategy. Volatility on the S&P 500 index has been through a long, and steady decline which, in
 February and July, 2005 reached low levels not seen in more than ten years. Since then market volatility has successfully rested the July lows and is
 resolving at higher levels much more conducive to this strategy. The Advisor retains the discretion to mix and match elements of other strategies or
 new elements, as market conditions require. Appropriate participants for this strategy will be experienced investors who will have the staying power
 (both psychologically and monetarily) to execute this strategy for the long-term. A minimum of 18 months should be allowed to evaluate performance.

                RETURN STATISTICS                                          RISK STATISTICS                                        RISK/RETURN CHART

 Last Month                                    1.53       Sharpe Ratio                                 0.07
 Year To Date                                  -0.98      Sortino Ratio                              -0.16
 Average ROR                                   -3.55      Sterling Ratio                             -0.11
 3 Months ROR                                  4.45       Calmar Ratio                               -0.07
 12 Months ROR                                 9.51       Skewness                                   -2.75
 36 Months ROR                                -13.57      Kurtosis                                   10.88
 Total Return                                 -17.28      Drawdown                                   64.07
 Winning Months (%)                           66.67       Std.Deviation                                9.59
 Avg.Winning Month                             4.75       Down.Deviation                               8.31
 Avg.Losing Month                              -8.69


                                                 Powered and provided by ManagedFutures.eu. Copyright2010.
                       Data and information is provided for informational purposes only. Past performance is not indicative of future results.
MONTHLY RETURNS (%)                                                                  VAMI VS S&P 500


                                                                       MANAGER BIO
 Mr. Chang has been continuously registered in the commodity industry for the past 16 years. From August of 1997 to the present, Mr. Chang has
 operated Chesapeake Investment Services, Inc (Chesapeake), a Virginia based Introducing Broker. Mr. Chang is the President and Chief Executive
 Officer and is responsible for the day-to-day supervision of approximately $70 million dollars of customer equity. Mr. Chang has been registered as
 an associated person and approved as a principal with Chesapeake Investment Services, Inc. since August 4, 1997. On March 27, 2009, Mr. Chang
 was registered as a principal of Vision Brokerage Services, LLC, a guaranteed introducing broker and NFA Member firm and an affiliated firm of
 Vision Financial Markets LLC.

                 DISTRIBUTION OF MONTHLY RETURNS                                                          12 MONTH ROLLING ROR


                         DRAWDOWN REPORT                                                                      RETURN REPORT

No. Depth Length (Months)      Recovery (Months)      Start date End date         Period        Best       Worst         Average         Median     Last
 1 64.07       3.00                    -               09/2008 11/2008            1 Month       13.33      -48.40         0.25            2.19      3.62
2   33.07        7.00                  9.00            02/2007      08/2007       3 Month       27.31      -64.07          1.13              4.43    7.75
3   3.74         2.00                  3.00            04/2006      05/2006       6 Month       41.33      -60.89          2.04              8.22   -7.58
4   3.36         1.00                  2.00            07/2005      07/2005       1 Year        67.99      -51.04          0.67              4.94    9.96
5   1.37         1.00                  2.00            10/2005      10/2005       2 Years       32.19      -55.74         -17.45         -22.28     -43.95
                                                                                  3 Years       48.13      -48.19         -22.41         -33.09     -5.84

                        UP CAPTURE VS. S&P 500                                                          DOWN CAPTURE VS. S&P 500


                                             Powered and provided by ManagedFutures.eu. Copyright2010.
                   Data and information is provided for informational purposes only. Past performance is not indicative of future results.
John´s Portfolio
                                                                      PORTFOLIO COMPOSITION
Briarwood, Diversified Trading            20.00%
Clarke, Global Basic                      40.00%
Fall River, Global Strategies HL          20.00%
John´s Stock Portfolio at ETRADE          20.00%


                                                                      MONTHLY PERFORMANCE

              JAN          FEB        MAR          APR        MAY           JUN      JUL         AUG          SEP        OCT        NOV          DEC     YEAR
 2002         -1.46        -5.48      5.58         -3.81       5.36         7.23      4.27        1.25        0.09      -10.82      -3.25        26.05   22.81
 2003         -4.54       10.85       -9.98        3.64       23.93         -3.23    -0.37       -1.79        1.86       -3.86      -4.04        10.86   20.67
 2004         -4.48       13.43       0.70         -2.56       1.84         -5.07     0.71       -1.10        0.09        0.79       5.61        -0.16    8.90
 2005         -6.71        -0.31      -1.80        -0.11      10.90         3.04      0.26        1.88        -0.57       1.06       3.72        -0.11   10.85
 2006          2.11        -0.21      -1.69        2.92       -0.11         -2.62    -2.00       -0.46        -4.81      -0.38      11.48        -7.04    -3.86
 2007          1.44         0.91      -0.76        1.68       -0.35         0.44     -1.18        0.08        9.99       -3.56       6.40         8.97   25.73
 2008          6.38       11.23       4.70         -3.73      -0.34         0.06     -1.85      18.08         2.27        1.90       2.67         1.42   49.60
 2009          0.33        -2.63      1.64         -1.22      -3.98         -0.20    -0.99       -8.59        2.90       -7.27       7.12        -7.75   -19.79
 2010         -1.80        -2.34      -0.59        -3.54       0.45         0.50     -1.49      14.03         -1.45                                       2.77

                RETURN STATISTICS                                           RISK STATISTICS                                      VAMI VS. S&P 500

 Last Month                                    -1.45       Sharpe Ratio                                0.59
 Year To Date                                   2.77       Sortino Ratio                               1.06
 Average ROR                                   11.86       Sterling Ratio                              0.50
 3 Months ROR                                  10.69       Calmar Ratio                                0.42
 12 Months ROR                                 -5.83       Skewness                                    1.52
 36 Months ROR                                 37.89       Kurtosis                                    3.91
 Total Return                                 166.67       Drawdown                                  26.88
 Winning Months (%)                            49.52       Std.Deviation                               6.07
 Avg.Winning Month                              5.14       Down.Deviation                              2.80
 Avg.Losing Month                              -2.84       Correl.S&P 500                            -0.10
                                                           Correl.DJ/CS MF                             0.50
                                                           Correl.Newedge                              0.53

                             MONTHLY RETURNS (%)                                                                      DRAWDOWN (%)


                                                 Powered and provided by ManagedFutures.eu. Copyright2010.
                       Data and information is provided for informational purposes only. Past performance is not indicative of future results.
Managed Futures Database

Más contenido relacionado

La actualidad más candente

Strategy presentationmar2012
Strategy presentationmar2012Strategy presentationmar2012
Strategy presentationmar2012Brian Crone
 
atmos enerrgy lehman090208
atmos enerrgy lehman090208atmos enerrgy lehman090208
atmos enerrgy lehman090208finance35
 
atmos enerrgy _analyst-conf100108
atmos enerrgy _analyst-conf100108atmos enerrgy _analyst-conf100108
atmos enerrgy _analyst-conf100108finance35
 
Raytheon Reports 2007 First Quarter Results
Raytheon Reports 2007 First Quarter ResultsRaytheon Reports 2007 First Quarter Results
Raytheon Reports 2007 First Quarter Resultsfinance12
 
Scotiabank. alicorp _02_jan2013_185807_ids_505
Scotiabank. alicorp _02_jan2013_185807_ids_505Scotiabank. alicorp _02_jan2013_185807_ids_505
Scotiabank. alicorp _02_jan2013_185807_ids_505gro77
 
1Q11 Presentation
1Q11 Presentation1Q11 Presentation
1Q11 PresentationGafisa RI !
 
111103 divulgação de resultados 3 t11 ingles
111103   divulgação de resultados 3 t11 ingles111103   divulgação de resultados 3 t11 ingles
111103 divulgação de resultados 3 t11 inglesMultiplus
 
baxter international Q2/08/PR_PL2
baxter international Q2/08/PR_PL2baxter international Q2/08/PR_PL2
baxter international Q2/08/PR_PL2finance24
 
Q3 2008 Comcast Corporation Earnings Conference Call
Q3 2008 Comcast Corporation Earnings Conference CallQ3 2008 Comcast Corporation Earnings Conference Call
Q3 2008 Comcast Corporation Earnings Conference Callfinance8
 
SEB Facts And Figures January December 2008
SEB Facts And Figures January December 2008SEB Facts And Figures January December 2008
SEB Facts And Figures January December 2008SEBgroup
 
Sandspring Partners 2009 Ytd
Sandspring Partners 2009 YtdSandspring Partners 2009 Ytd
Sandspring Partners 2009 Ytdmad31564
 
Correlation r2 matrix
Correlation r2 matrixCorrelation r2 matrix
Correlation r2 matrixsuzzad
 
Astm restore cli update nov 2010
Astm restore cli update nov 2010Astm restore cli update nov 2010
Astm restore cli update nov 2010James Hilbert
 

La actualidad más candente (17)

Strategy presentationmar2012
Strategy presentationmar2012Strategy presentationmar2012
Strategy presentationmar2012
 
AES 3Q 2006
AES 3Q 2006AES 3Q 2006
AES 3Q 2006
 
atmos enerrgy lehman090208
atmos enerrgy lehman090208atmos enerrgy lehman090208
atmos enerrgy lehman090208
 
atmos enerrgy _analyst-conf100108
atmos enerrgy _analyst-conf100108atmos enerrgy _analyst-conf100108
atmos enerrgy _analyst-conf100108
 
Raytheon Reports 2007 First Quarter Results
Raytheon Reports 2007 First Quarter ResultsRaytheon Reports 2007 First Quarter Results
Raytheon Reports 2007 First Quarter Results
 
Scotiabank. alicorp _02_jan2013_185807_ids_505
Scotiabank. alicorp _02_jan2013_185807_ids_505Scotiabank. alicorp _02_jan2013_185807_ids_505
Scotiabank. alicorp _02_jan2013_185807_ids_505
 
Munjal show ltd
Munjal show ltdMunjal show ltd
Munjal show ltd
 
AES 050806
AES 050806AES 050806
AES 050806
 
1Q11 Presentation
1Q11 Presentation1Q11 Presentation
1Q11 Presentation
 
111103 divulgação de resultados 3 t11 ingles
111103   divulgação de resultados 3 t11 ingles111103   divulgação de resultados 3 t11 ingles
111103 divulgação de resultados 3 t11 ingles
 
baxter international Q2/08/PR_PL2
baxter international Q2/08/PR_PL2baxter international Q2/08/PR_PL2
baxter international Q2/08/PR_PL2
 
Q3 2008 Comcast Corporation Earnings Conference Call
Q3 2008 Comcast Corporation Earnings Conference CallQ3 2008 Comcast Corporation Earnings Conference Call
Q3 2008 Comcast Corporation Earnings Conference Call
 
SEB Facts And Figures January December 2008
SEB Facts And Figures January December 2008SEB Facts And Figures January December 2008
SEB Facts And Figures January December 2008
 
Sandspring Partners 2009 Ytd
Sandspring Partners 2009 YtdSandspring Partners 2009 Ytd
Sandspring Partners 2009 Ytd
 
1Q08 Presentation
1Q08 Presentation1Q08 Presentation
1Q08 Presentation
 
Correlation r2 matrix
Correlation r2 matrixCorrelation r2 matrix
Correlation r2 matrix
 
Astm restore cli update nov 2010
Astm restore cli update nov 2010Astm restore cli update nov 2010
Astm restore cli update nov 2010
 

Destacado

42; physignathus lesueurii predation (natural history note)
42; physignathus lesueurii predation (natural history note)42; physignathus lesueurii predation (natural history note)
42; physignathus lesueurii predation (natural history note)Roger Meek
 
aspt. Topanta jonathan
aspt. Topanta jonathanaspt. Topanta jonathan
aspt. Topanta jonathanJona Toapanta
 
Unofficial translation
Unofficial translationUnofficial translation
Unofficial translationShujun Li
 
Volume negociados fundos imobiliários outubro 2015
Volume negociados fundos imobiliários outubro 2015Volume negociados fundos imobiliários outubro 2015
Volume negociados fundos imobiliários outubro 2015claudiusinhos
 
Gerencia de Proyectos de Tecnología Educativa
Gerencia de Proyectos de Tecnología EducativaGerencia de Proyectos de Tecnología Educativa
Gerencia de Proyectos de Tecnología Educativayulianagonzalez13
 
Autobiografia de tobias gonzalez
Autobiografia  de tobias gonzalezAutobiografia  de tobias gonzalez
Autobiografia de tobias gonzalezTobi Gonzalez
 
MED 199 Poster
MED 199 PosterMED 199 Poster
MED 199 PosterBetty Wong
 
Convocatória ag ap eb1 ji_vendas 17out13
Convocatória ag ap eb1 ji_vendas 17out13Convocatória ag ap eb1 ji_vendas 17out13
Convocatória ag ap eb1 ji_vendas 17out13apeb1va
 
Collaborative Network for Project Development - CNPD
Collaborative Network for Project Development - CNPDCollaborative Network for Project Development - CNPD
Collaborative Network for Project Development - CNPDArmando Ramirez Vila
 
Convocatória ag ap eb1 ji_vendas 23jan13
Convocatória ag ap eb1 ji_vendas 23jan13Convocatória ag ap eb1 ji_vendas 23jan13
Convocatória ag ap eb1 ji_vendas 23jan13apeb1va
 
Cambiar una empresa con juegos ágiles
Cambiar una empresa con juegos ágilesCambiar una empresa con juegos ágiles
Cambiar una empresa con juegos ágilesJavier Gamarra
 
Is Conversion Rate Optimization a Dead-End?
Is Conversion Rate Optimization a Dead-End?Is Conversion Rate Optimization a Dead-End?
Is Conversion Rate Optimization a Dead-End?Bryan Eisenberg
 

Destacado (17)

42; physignathus lesueurii predation (natural history note)
42; physignathus lesueurii predation (natural history note)42; physignathus lesueurii predation (natural history note)
42; physignathus lesueurii predation (natural history note)
 
aspt. Topanta jonathan
aspt. Topanta jonathanaspt. Topanta jonathan
aspt. Topanta jonathan
 
Unofficial translation
Unofficial translationUnofficial translation
Unofficial translation
 
Volume negociados fundos imobiliários outubro 2015
Volume negociados fundos imobiliários outubro 2015Volume negociados fundos imobiliários outubro 2015
Volume negociados fundos imobiliários outubro 2015
 
1° guía con décimas.
1° guía con décimas.1° guía con décimas.
1° guía con décimas.
 
Gerencia de Proyectos de Tecnología Educativa
Gerencia de Proyectos de Tecnología EducativaGerencia de Proyectos de Tecnología Educativa
Gerencia de Proyectos de Tecnología Educativa
 
Mapa gestion de proyectos
Mapa gestion de proyectosMapa gestion de proyectos
Mapa gestion de proyectos
 
Aspt.guamán henry
Aspt.guamán henryAspt.guamán henry
Aspt.guamán henry
 
Autobiografia de tobias gonzalez
Autobiografia  de tobias gonzalezAutobiografia  de tobias gonzalez
Autobiografia de tobias gonzalez
 
MED 199 Poster
MED 199 PosterMED 199 Poster
MED 199 Poster
 
iPod
iPodiPod
iPod
 
Convocatória ag ap eb1 ji_vendas 17out13
Convocatória ag ap eb1 ji_vendas 17out13Convocatória ag ap eb1 ji_vendas 17out13
Convocatória ag ap eb1 ji_vendas 17out13
 
Collaborative Network for Project Development - CNPD
Collaborative Network for Project Development - CNPDCollaborative Network for Project Development - CNPD
Collaborative Network for Project Development - CNPD
 
Convocatória ag ap eb1 ji_vendas 23jan13
Convocatória ag ap eb1 ji_vendas 23jan13Convocatória ag ap eb1 ji_vendas 23jan13
Convocatória ag ap eb1 ji_vendas 23jan13
 
Molinos para don Quijote
Molinos para don QuijoteMolinos para don Quijote
Molinos para don Quijote
 
Cambiar una empresa con juegos ágiles
Cambiar una empresa con juegos ágilesCambiar una empresa con juegos ágiles
Cambiar una empresa con juegos ágiles
 
Is Conversion Rate Optimization a Dead-End?
Is Conversion Rate Optimization a Dead-End?Is Conversion Rate Optimization a Dead-End?
Is Conversion Rate Optimization a Dead-End?
 

Similar a Managed Futures Database

Owens_Minor3Q2008_webcast_slides
Owens_Minor3Q2008_webcast_slidesOwens_Minor3Q2008_webcast_slides
Owens_Minor3Q2008_webcast_slidesfinance33
 
2011 - Q1 - Commentary
2011 - Q1 - Commentary2011 - Q1 - Commentary
2011 - Q1 - CommentaryDrew Beja
 
BRICS PMS Performance Update - 31 January 2011
BRICS PMS Performance Update - 31 January 2011BRICS PMS Performance Update - 31 January 2011
BRICS PMS Performance Update - 31 January 2011vivekmavani
 
BRICS PMS Performance Update - 28 February 2011
BRICS PMS Performance Update - 28 February 2011BRICS PMS Performance Update - 28 February 2011
BRICS PMS Performance Update - 28 February 2011vivekmavani
 
Dividend weekly 03 2013
Dividend weekly 03 2013Dividend weekly 03 2013
Dividend weekly 03 2013Dividend Yield
 
3 q07 results presentation
3 q07 results presentation3 q07 results presentation
3 q07 results presentationCSURIWEB
 
Banco ABC - 4th Quarter 2007 Earnings Presentation
Banco ABC - 4th Quarter 2007 Earnings PresentationBanco ABC - 4th Quarter 2007 Earnings Presentation
Banco ABC - 4th Quarter 2007 Earnings PresentationBanco ABC Brasil
 
Dividend Weekly S 01 2013 By http://long-term-investments.blogspot.com
Dividend Weekly S 01 2013 By http://long-term-investments.blogspot.comDividend Weekly S 01 2013 By http://long-term-investments.blogspot.com
Dividend Weekly S 01 2013 By http://long-term-investments.blogspot.comDividend Yield
 
Dividend Weekly 50 2012 By http://long-term-investments.blogspot.com
Dividend Weekly 50 2012 By http://long-term-investments.blogspot.comDividend Weekly 50 2012 By http://long-term-investments.blogspot.com
Dividend Weekly 50 2012 By http://long-term-investments.blogspot.comDividend Yield
 
Owens_Minor_2Q2008_webcast_slides_v_final
Owens_Minor_2Q2008_webcast_slides_v_finalOwens_Minor_2Q2008_webcast_slides_v_final
Owens_Minor_2Q2008_webcast_slides_v_finalfinance33
 
Weekly newsletter equity 08 oct2012
Weekly newsletter equity 08 oct2012Weekly newsletter equity 08 oct2012
Weekly newsletter equity 08 oct2012TheEquicom Advisory
 

Similar a Managed Futures Database (20)

Pleiades
PleiadesPleiades
Pleiades
 
Atlas Overview 201003
Atlas Overview 201003Atlas Overview 201003
Atlas Overview 201003
 
Andromeda
AndromedaAndromeda
Andromeda
 
Hephaestos
HephaestosHephaestos
Hephaestos
 
Owens_Minor3Q2008_webcast_slides
Owens_Minor3Q2008_webcast_slidesOwens_Minor3Q2008_webcast_slides
Owens_Minor3Q2008_webcast_slides
 
2011 - Q1 - Commentary
2011 - Q1 - Commentary2011 - Q1 - Commentary
2011 - Q1 - Commentary
 
BRICS PMS Performance Update - 31 January 2011
BRICS PMS Performance Update - 31 January 2011BRICS PMS Performance Update - 31 January 2011
BRICS PMS Performance Update - 31 January 2011
 
BRICS PMS Performance Update - 28 February 2011
BRICS PMS Performance Update - 28 February 2011BRICS PMS Performance Update - 28 February 2011
BRICS PMS Performance Update - 28 February 2011
 
Dividend weekly 03 2013
Dividend weekly 03 2013Dividend weekly 03 2013
Dividend weekly 03 2013
 
Infosys
InfosysInfosys
Infosys
 
Orion
OrionOrion
Orion
 
3 q07 results presentation
3 q07 results presentation3 q07 results presentation
3 q07 results presentation
 
Banco ABC - 4th Quarter 2007 Earnings Presentation
Banco ABC - 4th Quarter 2007 Earnings PresentationBanco ABC - 4th Quarter 2007 Earnings Presentation
Banco ABC - 4th Quarter 2007 Earnings Presentation
 
Dividend Weekly S 01 2013 By http://long-term-investments.blogspot.com
Dividend Weekly S 01 2013 By http://long-term-investments.blogspot.comDividend Weekly S 01 2013 By http://long-term-investments.blogspot.com
Dividend Weekly S 01 2013 By http://long-term-investments.blogspot.com
 
Midas
MidasMidas
Midas
 
Dividend Weekly 50 2012 By http://long-term-investments.blogspot.com
Dividend Weekly 50 2012 By http://long-term-investments.blogspot.comDividend Weekly 50 2012 By http://long-term-investments.blogspot.com
Dividend Weekly 50 2012 By http://long-term-investments.blogspot.com
 
RJ
RJRJ
RJ
 
Owens_Minor_2Q2008_webcast_slides_v_final
Owens_Minor_2Q2008_webcast_slides_v_finalOwens_Minor_2Q2008_webcast_slides_v_final
Owens_Minor_2Q2008_webcast_slides_v_final
 
Weekly newsletter equity 08 oct2012
Weekly newsletter equity 08 oct2012Weekly newsletter equity 08 oct2012
Weekly newsletter equity 08 oct2012
 
Daily news letter 12 oct2012
Daily news letter 12 oct2012Daily news letter 12 oct2012
Daily news letter 12 oct2012
 

Último

Gurley shaw Theory of Monetary Economics.
Gurley shaw Theory of Monetary Economics.Gurley shaw Theory of Monetary Economics.
Gurley shaw Theory of Monetary Economics.Vinodha Devi
 
Top Rated Pune Call Girls Viman Nagar ⟟ 6297143586 ⟟ Call Me For Genuine Sex...
Top Rated  Pune Call Girls Viman Nagar ⟟ 6297143586 ⟟ Call Me For Genuine Sex...Top Rated  Pune Call Girls Viman Nagar ⟟ 6297143586 ⟟ Call Me For Genuine Sex...
Top Rated Pune Call Girls Viman Nagar ⟟ 6297143586 ⟟ Call Me For Genuine Sex...Call Girls in Nagpur High Profile
 
Basic concepts related to Financial modelling
Basic concepts related to Financial modellingBasic concepts related to Financial modelling
Basic concepts related to Financial modellingbaijup5
 
Call Girls Service Nagpur Maya Call 7001035870 Meet With Nagpur Escorts
Call Girls Service Nagpur Maya Call 7001035870 Meet With Nagpur EscortsCall Girls Service Nagpur Maya Call 7001035870 Meet With Nagpur Escorts
Call Girls Service Nagpur Maya Call 7001035870 Meet With Nagpur Escortsranjana rawat
 
(ANIKA) Budhwar Peth Call Girls Just Call 7001035870 [ Cash on Delivery ] Pun...
(ANIKA) Budhwar Peth Call Girls Just Call 7001035870 [ Cash on Delivery ] Pun...(ANIKA) Budhwar Peth Call Girls Just Call 7001035870 [ Cash on Delivery ] Pun...
(ANIKA) Budhwar Peth Call Girls Just Call 7001035870 [ Cash on Delivery ] Pun...ranjana rawat
 
The Economic History of the U.S. Lecture 18.pdf
The Economic History of the U.S. Lecture 18.pdfThe Economic History of the U.S. Lecture 18.pdf
The Economic History of the U.S. Lecture 18.pdfGale Pooley
 
High Class Call Girls Nagpur Grishma Call 7001035870 Meet With Nagpur Escorts
High Class Call Girls Nagpur Grishma Call 7001035870 Meet With Nagpur EscortsHigh Class Call Girls Nagpur Grishma Call 7001035870 Meet With Nagpur Escorts
High Class Call Girls Nagpur Grishma Call 7001035870 Meet With Nagpur Escortsranjana rawat
 
Pooja 9892124323 : Call Girl in Juhu Escorts Service Free Home Delivery
Pooja 9892124323 : Call Girl in Juhu Escorts Service Free Home DeliveryPooja 9892124323 : Call Girl in Juhu Escorts Service Free Home Delivery
Pooja 9892124323 : Call Girl in Juhu Escorts Service Free Home DeliveryPooja Nehwal
 
Independent Call Girl Number in Kurla Mumbai📲 Pooja Nehwal 9892124323 💞 Full ...
Independent Call Girl Number in Kurla Mumbai📲 Pooja Nehwal 9892124323 💞 Full ...Independent Call Girl Number in Kurla Mumbai📲 Pooja Nehwal 9892124323 💞 Full ...
Independent Call Girl Number in Kurla Mumbai📲 Pooja Nehwal 9892124323 💞 Full ...Pooja Nehwal
 
20240429 Calibre April 2024 Investor Presentation.pdf
20240429 Calibre April 2024 Investor Presentation.pdf20240429 Calibre April 2024 Investor Presentation.pdf
20240429 Calibre April 2024 Investor Presentation.pdfAdnet Communications
 
VVIP Pune Call Girls Katraj (7001035870) Pune Escorts Nearby with Complete Sa...
VVIP Pune Call Girls Katraj (7001035870) Pune Escorts Nearby with Complete Sa...VVIP Pune Call Girls Katraj (7001035870) Pune Escorts Nearby with Complete Sa...
VVIP Pune Call Girls Katraj (7001035870) Pune Escorts Nearby with Complete Sa...Call Girls in Nagpur High Profile
 
02_Fabio Colombo_Accenture_MeetupDora&Cybersecurity.pptx
02_Fabio Colombo_Accenture_MeetupDora&Cybersecurity.pptx02_Fabio Colombo_Accenture_MeetupDora&Cybersecurity.pptx
02_Fabio Colombo_Accenture_MeetupDora&Cybersecurity.pptxFinTech Belgium
 
Solution Manual for Principles of Corporate Finance 14th Edition by Richard B...
Solution Manual for Principles of Corporate Finance 14th Edition by Richard B...Solution Manual for Principles of Corporate Finance 14th Edition by Richard B...
Solution Manual for Principles of Corporate Finance 14th Edition by Richard B...ssifa0344
 
00_Main ppt_MeetupDORA&CyberSecurity.pptx
00_Main ppt_MeetupDORA&CyberSecurity.pptx00_Main ppt_MeetupDORA&CyberSecurity.pptx
00_Main ppt_MeetupDORA&CyberSecurity.pptxFinTech Belgium
 
TEST BANK For Corporate Finance, 13th Edition By Stephen Ross, Randolph Weste...
TEST BANK For Corporate Finance, 13th Edition By Stephen Ross, Randolph Weste...TEST BANK For Corporate Finance, 13th Edition By Stephen Ross, Randolph Weste...
TEST BANK For Corporate Finance, 13th Edition By Stephen Ross, Randolph Weste...ssifa0344
 
06_Joeri Van Speybroek_Dell_MeetupDora&Cybersecurity.pdf
06_Joeri Van Speybroek_Dell_MeetupDora&Cybersecurity.pdf06_Joeri Van Speybroek_Dell_MeetupDora&Cybersecurity.pdf
06_Joeri Van Speybroek_Dell_MeetupDora&Cybersecurity.pdfFinTech Belgium
 

Último (20)

Gurley shaw Theory of Monetary Economics.
Gurley shaw Theory of Monetary Economics.Gurley shaw Theory of Monetary Economics.
Gurley shaw Theory of Monetary Economics.
 
VIP Call Girl Service Andheri West ⚡ 9920725232 What It Takes To Be The Best ...
VIP Call Girl Service Andheri West ⚡ 9920725232 What It Takes To Be The Best ...VIP Call Girl Service Andheri West ⚡ 9920725232 What It Takes To Be The Best ...
VIP Call Girl Service Andheri West ⚡ 9920725232 What It Takes To Be The Best ...
 
VIP Independent Call Girls in Bandra West 🌹 9920725232 ( Call Me ) Mumbai Esc...
VIP Independent Call Girls in Bandra West 🌹 9920725232 ( Call Me ) Mumbai Esc...VIP Independent Call Girls in Bandra West 🌹 9920725232 ( Call Me ) Mumbai Esc...
VIP Independent Call Girls in Bandra West 🌹 9920725232 ( Call Me ) Mumbai Esc...
 
Top Rated Pune Call Girls Viman Nagar ⟟ 6297143586 ⟟ Call Me For Genuine Sex...
Top Rated  Pune Call Girls Viman Nagar ⟟ 6297143586 ⟟ Call Me For Genuine Sex...Top Rated  Pune Call Girls Viman Nagar ⟟ 6297143586 ⟟ Call Me For Genuine Sex...
Top Rated Pune Call Girls Viman Nagar ⟟ 6297143586 ⟟ Call Me For Genuine Sex...
 
Basic concepts related to Financial modelling
Basic concepts related to Financial modellingBasic concepts related to Financial modelling
Basic concepts related to Financial modelling
 
Call Girls Service Nagpur Maya Call 7001035870 Meet With Nagpur Escorts
Call Girls Service Nagpur Maya Call 7001035870 Meet With Nagpur EscortsCall Girls Service Nagpur Maya Call 7001035870 Meet With Nagpur Escorts
Call Girls Service Nagpur Maya Call 7001035870 Meet With Nagpur Escorts
 
(ANIKA) Budhwar Peth Call Girls Just Call 7001035870 [ Cash on Delivery ] Pun...
(ANIKA) Budhwar Peth Call Girls Just Call 7001035870 [ Cash on Delivery ] Pun...(ANIKA) Budhwar Peth Call Girls Just Call 7001035870 [ Cash on Delivery ] Pun...
(ANIKA) Budhwar Peth Call Girls Just Call 7001035870 [ Cash on Delivery ] Pun...
 
(Vedika) Low Rate Call Girls in Pune Call Now 8250077686 Pune Escorts 24x7
(Vedika) Low Rate Call Girls in Pune Call Now 8250077686 Pune Escorts 24x7(Vedika) Low Rate Call Girls in Pune Call Now 8250077686 Pune Escorts 24x7
(Vedika) Low Rate Call Girls in Pune Call Now 8250077686 Pune Escorts 24x7
 
(INDIRA) Call Girl Mumbai Call Now 8250077686 Mumbai Escorts 24x7
(INDIRA) Call Girl Mumbai Call Now 8250077686 Mumbai Escorts 24x7(INDIRA) Call Girl Mumbai Call Now 8250077686 Mumbai Escorts 24x7
(INDIRA) Call Girl Mumbai Call Now 8250077686 Mumbai Escorts 24x7
 
The Economic History of the U.S. Lecture 18.pdf
The Economic History of the U.S. Lecture 18.pdfThe Economic History of the U.S. Lecture 18.pdf
The Economic History of the U.S. Lecture 18.pdf
 
High Class Call Girls Nagpur Grishma Call 7001035870 Meet With Nagpur Escorts
High Class Call Girls Nagpur Grishma Call 7001035870 Meet With Nagpur EscortsHigh Class Call Girls Nagpur Grishma Call 7001035870 Meet With Nagpur Escorts
High Class Call Girls Nagpur Grishma Call 7001035870 Meet With Nagpur Escorts
 
Pooja 9892124323 : Call Girl in Juhu Escorts Service Free Home Delivery
Pooja 9892124323 : Call Girl in Juhu Escorts Service Free Home DeliveryPooja 9892124323 : Call Girl in Juhu Escorts Service Free Home Delivery
Pooja 9892124323 : Call Girl in Juhu Escorts Service Free Home Delivery
 
Independent Call Girl Number in Kurla Mumbai📲 Pooja Nehwal 9892124323 💞 Full ...
Independent Call Girl Number in Kurla Mumbai📲 Pooja Nehwal 9892124323 💞 Full ...Independent Call Girl Number in Kurla Mumbai📲 Pooja Nehwal 9892124323 💞 Full ...
Independent Call Girl Number in Kurla Mumbai📲 Pooja Nehwal 9892124323 💞 Full ...
 
20240429 Calibre April 2024 Investor Presentation.pdf
20240429 Calibre April 2024 Investor Presentation.pdf20240429 Calibre April 2024 Investor Presentation.pdf
20240429 Calibre April 2024 Investor Presentation.pdf
 
VVIP Pune Call Girls Katraj (7001035870) Pune Escorts Nearby with Complete Sa...
VVIP Pune Call Girls Katraj (7001035870) Pune Escorts Nearby with Complete Sa...VVIP Pune Call Girls Katraj (7001035870) Pune Escorts Nearby with Complete Sa...
VVIP Pune Call Girls Katraj (7001035870) Pune Escorts Nearby with Complete Sa...
 
02_Fabio Colombo_Accenture_MeetupDora&Cybersecurity.pptx
02_Fabio Colombo_Accenture_MeetupDora&Cybersecurity.pptx02_Fabio Colombo_Accenture_MeetupDora&Cybersecurity.pptx
02_Fabio Colombo_Accenture_MeetupDora&Cybersecurity.pptx
 
Solution Manual for Principles of Corporate Finance 14th Edition by Richard B...
Solution Manual for Principles of Corporate Finance 14th Edition by Richard B...Solution Manual for Principles of Corporate Finance 14th Edition by Richard B...
Solution Manual for Principles of Corporate Finance 14th Edition by Richard B...
 
00_Main ppt_MeetupDORA&CyberSecurity.pptx
00_Main ppt_MeetupDORA&CyberSecurity.pptx00_Main ppt_MeetupDORA&CyberSecurity.pptx
00_Main ppt_MeetupDORA&CyberSecurity.pptx
 
TEST BANK For Corporate Finance, 13th Edition By Stephen Ross, Randolph Weste...
TEST BANK For Corporate Finance, 13th Edition By Stephen Ross, Randolph Weste...TEST BANK For Corporate Finance, 13th Edition By Stephen Ross, Randolph Weste...
TEST BANK For Corporate Finance, 13th Edition By Stephen Ross, Randolph Weste...
 
06_Joeri Van Speybroek_Dell_MeetupDora&Cybersecurity.pdf
06_Joeri Van Speybroek_Dell_MeetupDora&Cybersecurity.pdf06_Joeri Van Speybroek_Dell_MeetupDora&Cybersecurity.pdf
06_Joeri Van Speybroek_Dell_MeetupDora&Cybersecurity.pdf
 

Managed Futures Database

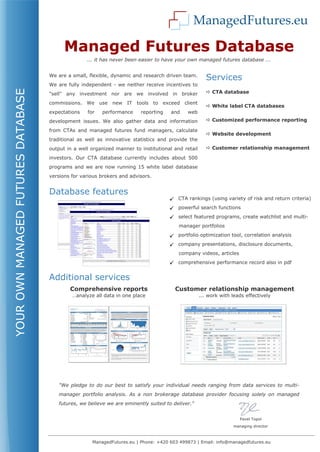
  • 1. CTA database White label CTA databases Customized performance reporting Website development Customer relationship management
  • 2.
  • 3.
  • 4. Add to watchlist Download program report in PDF ACE Investments Strategists, LLC Aggressive Stock Index Premium Collection GENERAL INFORMATION COMPANY INFO Min. Investment 100,000 USD (notional funding: 90%) Name ACE Investments Strategists, LLC AUM 3,800,000 USD Principal Yu-Dee Chang Management Fee 2% Phone +1 703 893 8808 Incentive Fee 25% Email info@investwithace.com RT per Million N/A NFA ID 331001 Margin to Equity N/A Number of Accounts 1450 Legal Structure Managed account NAV calculated by N/A Highwater Mark yes Company Documents Inv. Restrictions none Disclosure Document Inv. Style Option writing / indices Video Presentation Contact the CTA MONTHLY PERFORMANCE JAN FEB MAR APR MAY JUN JUL AUG SEP OCT NOV DEC YEAR 2005 -3.36 1.54 3.37 -1.37 0.77 1.46 2.29 2006 0.87 1.78 4.72 -0.01 -3.73 1.75 -0.77 6.76 1.46 2.79 -0.84 2.70 18.48 2007 6.68 -14.76 -13.82 -3.64 9.90 3.90 -8.71 -9.30 10.61 4.82 4.59 13.33 -1.88 2008 -15.93 9.03 6.69 7.32 7.01 3.63 2.09 2.88 -48.40 -28.95 -1.99 11.47 -51.04 2009 0.06 5.13 -3.31 10.96 7.80 6.43 -5.97 4.53 1.95 -0.39 3.66 7.10 43.49 2010 3.17 2.29 2.51 -1.90 -14.71 4.74 -0.72 3.62 1.53 -0.98 STRATEGY DESCRIPTION The objective of this strategy is to achieve returns superior to those of the core SIPC strategy, primarily by exploiting rising volatility levels, when they occur, in a more aggressive way. This strategy uses all the basics of the core SIPC system, selling put and call options on the S&P 500 future to collect premiums. ASIPC will differ from the "core" mainly in that it will, at opportune times, and with suitable moderation, select option strike prices closer to the market in order to collect higher premiums and improve performance. An added risk in this approach is the degree to which the market is more likely to impend on strike prices. Offsetting that risk is the experienced judgment of the Advisor, his ability to make quick decisions and to execute them in the interest of capitalizing on an opportunity by hedging (taking a long or short position in the underlying futures contract) or trading out of the potential trouble. The plan is to trade in a more aggressive way only when volatility and other market conditions are optimum. Adequate market volatility is essential to the success of the strategy. Volatility on the S&P 500 index has been through a long, and steady decline which, in February and July, 2005 reached low levels not seen in more than ten years. Since then market volatility has successfully rested the July lows and is resolving at higher levels much more conducive to this strategy. The Advisor retains the discretion to mix and match elements of other strategies or new elements, as market conditions require. Appropriate participants for this strategy will be experienced investors who will have the staying power (both psychologically and monetarily) to execute this strategy for the long-term. A minimum of 18 months should be allowed to evaluate performance. RETURN STATISTICS RISK STATISTICS RISK/RETURN CHART Last Month 1.53 Sharpe Ratio 0.07 Year To Date -0.98 Sortino Ratio -0.16 Average ROR -3.55 Sterling Ratio -0.11 3 Months ROR 4.45 Calmar Ratio -0.07 12 Months ROR 9.51 Skewness -2.75 36 Months ROR -13.57 Kurtosis 10.88 Total Return -17.28 Drawdown 64.07 Winning Months (%) 66.67 Std.Deviation 9.59 Avg.Winning Month 4.75 Down.Deviation 8.31 Avg.Losing Month -8.69 Powered and provided by ManagedFutures.eu. Copyright2010. Data and information is provided for informational purposes only. Past performance is not indicative of future results.
  • 5. MONTHLY RETURNS (%) VAMI VS S&P 500 MANAGER BIO Mr. Chang has been continuously registered in the commodity industry for the past 16 years. From August of 1997 to the present, Mr. Chang has operated Chesapeake Investment Services, Inc (Chesapeake), a Virginia based Introducing Broker. Mr. Chang is the President and Chief Executive Officer and is responsible for the day-to-day supervision of approximately $70 million dollars of customer equity. Mr. Chang has been registered as an associated person and approved as a principal with Chesapeake Investment Services, Inc. since August 4, 1997. On March 27, 2009, Mr. Chang was registered as a principal of Vision Brokerage Services, LLC, a guaranteed introducing broker and NFA Member firm and an affiliated firm of Vision Financial Markets LLC. DISTRIBUTION OF MONTHLY RETURNS 12 MONTH ROLLING ROR DRAWDOWN REPORT RETURN REPORT No. Depth Length (Months) Recovery (Months) Start date End date Period Best Worst Average Median Last 1 64.07 3.00 - 09/2008 11/2008 1 Month 13.33 -48.40 0.25 2.19 3.62 2 33.07 7.00 9.00 02/2007 08/2007 3 Month 27.31 -64.07 1.13 4.43 7.75 3 3.74 2.00 3.00 04/2006 05/2006 6 Month 41.33 -60.89 2.04 8.22 -7.58 4 3.36 1.00 2.00 07/2005 07/2005 1 Year 67.99 -51.04 0.67 4.94 9.96 5 1.37 1.00 2.00 10/2005 10/2005 2 Years 32.19 -55.74 -17.45 -22.28 -43.95 3 Years 48.13 -48.19 -22.41 -33.09 -5.84 UP CAPTURE VS. S&P 500 DOWN CAPTURE VS. S&P 500 Powered and provided by ManagedFutures.eu. Copyright2010. Data and information is provided for informational purposes only. Past performance is not indicative of future results.
  • 6. John´s Portfolio PORTFOLIO COMPOSITION Briarwood, Diversified Trading 20.00% Clarke, Global Basic 40.00% Fall River, Global Strategies HL 20.00% John´s Stock Portfolio at ETRADE 20.00% MONTHLY PERFORMANCE JAN FEB MAR APR MAY JUN JUL AUG SEP OCT NOV DEC YEAR 2002 -1.46 -5.48 5.58 -3.81 5.36 7.23 4.27 1.25 0.09 -10.82 -3.25 26.05 22.81 2003 -4.54 10.85 -9.98 3.64 23.93 -3.23 -0.37 -1.79 1.86 -3.86 -4.04 10.86 20.67 2004 -4.48 13.43 0.70 -2.56 1.84 -5.07 0.71 -1.10 0.09 0.79 5.61 -0.16 8.90 2005 -6.71 -0.31 -1.80 -0.11 10.90 3.04 0.26 1.88 -0.57 1.06 3.72 -0.11 10.85 2006 2.11 -0.21 -1.69 2.92 -0.11 -2.62 -2.00 -0.46 -4.81 -0.38 11.48 -7.04 -3.86 2007 1.44 0.91 -0.76 1.68 -0.35 0.44 -1.18 0.08 9.99 -3.56 6.40 8.97 25.73 2008 6.38 11.23 4.70 -3.73 -0.34 0.06 -1.85 18.08 2.27 1.90 2.67 1.42 49.60 2009 0.33 -2.63 1.64 -1.22 -3.98 -0.20 -0.99 -8.59 2.90 -7.27 7.12 -7.75 -19.79 2010 -1.80 -2.34 -0.59 -3.54 0.45 0.50 -1.49 14.03 -1.45 2.77 RETURN STATISTICS RISK STATISTICS VAMI VS. S&P 500 Last Month -1.45 Sharpe Ratio 0.59 Year To Date 2.77 Sortino Ratio 1.06 Average ROR 11.86 Sterling Ratio 0.50 3 Months ROR 10.69 Calmar Ratio 0.42 12 Months ROR -5.83 Skewness 1.52 36 Months ROR 37.89 Kurtosis 3.91 Total Return 166.67 Drawdown 26.88 Winning Months (%) 49.52 Std.Deviation 6.07 Avg.Winning Month 5.14 Down.Deviation 2.80 Avg.Losing Month -2.84 Correl.S&P 500 -0.10 Correl.DJ/CS MF 0.50 Correl.Newedge 0.53 MONTHLY RETURNS (%) DRAWDOWN (%) Powered and provided by ManagedFutures.eu. Copyright2010. Data and information is provided for informational purposes only. Past performance is not indicative of future results.