SlideShare una empresa de Scribd logo
1 de 17
Descargar para leer sin conexión
4. Sobrevivir en ambientes virtuales: análisis de datos,
fundraising, coproducciones, creación WEB.

  Temas:
  Indicadores y análisis de datos en social media.
  Opciones fundraising locales e internacionales, campañas y
  causas.
  Acciones culturales dentro de la red, Nuevos formatos:
  netart, videoarte, música electrónica. Creadores colectivos,
  en construcción.

  Actividades:
  Proponer transformaciones o nuevas acciones dentro del
  marco del proyecto de cada estudiante para ser realizados
  dentro de la red.
1. Indicadores y análisis de datos en social media.


       En nuestras estrategias en Social Media debemos establecer
       indicadores de medición que nos digan si todo el trabajo que estamos
       realizando va por buen camino.

       Debemos realizar un trabajo de selección de indicadores con los cuáles
       vamos a medir nuestro proyecto desde el inicio hasta el fin.

       Los indicadores representan aquella parte de la realidad que ha sido
       considerada más relevante por quien los ha diseñado. Pierden, por
       tanto, una parte de la riqueza de aquello que quieren representar.


4. Sobrevivir en ambientes virtuales: análisis de datos, fundraising, coproducciones, creación WEB.
1. Indicadores y análisis de datos en social media.

     Para el diseño de los indicadores hay que tener en cuenta lo siguiente:

     FUNCIONES:

     Explicitar: sacar afuera lo implícito. Expresar claramente lo que se
     entiende.
     Verificar: Probar.

     CARACTERÍSTICAS:

     •Central: Debe medir lo esencial (o el núcleo).
     •Plausible: Lo que mide el indicador debe ser atribuible al proyecto.
     •Objetivo: No debe depender de otras mediciones.
     •Económico: No debe ser costoso obtenerlo.


4. Sobrevivir en ambientes virtuales: análisis de datos, fundraising, coproducciones, creación WEB.
1. Indicadores y análisis de datos en social media.


          COMPONENTES DE LOS INDICADORES:

          QUIÉN: Los beneficiarios.
          DÓNDE: Lugar
          CUÁNDO: Tiempo.
          QUÉ: Lo que pretende solucionar.
          CÓMO: Efecto o calidad.
          CUÁNTO: Cantidad.


4. Sobrevivir en ambientes virtuales: análisis de datos, fundraising, coproducciones, creación WEB.
1. Indicadores y análisis de datos en social media.


          Ejemplo de Indicador:

          Cincuenta egresados del curso han conseguido financiar sus proyectos en
          Noviembre 2011 en Lima.

          •CANTIDAD: Cincuenta
          •QUIEN: Egresados del curso.
          •QUÉ: Han conseguido financiar su proyecto
          •CÓMO : estrategia de fundraising.
          •CUÁNDO o TIEMPO: En noviembre 2011.
          •LUGAR: En Lima


4. Sobrevivir en ambientes virtuales: análisis de datos, fundraising, coproducciones, creación WEB.
1. Indicadores y análisis de datos en social media.


       Recordemos que los indicadores pueden ser:


       Cuantitavos: aquellos cuyos valores se pueden contar y ordenar de
       mayor a menor. Pueden expresarse numéricamente y gráficamente.
       Se utilizan sobre todo para medir cantidades y compararlas.

       Cualitativos: son elementos que indican la calidad del proyecto,
       pueden ser hechos, opiniones o percepciones que señalen condiciones
       o situaciones específicas.


4. Sobrevivir en ambientes virtuales: análisis de datos, fundraising, coproducciones, creación WEB.
1. Indicadores y análisis de datos en social media.


       Un indicador óptimo será aquel que dote de la información necesaria
       para la toma de decisiones a quién encarga el proyecto, al mismo
       tiempo que permite al gestor del proyecto sentirse seguro y confiado
       en la medición de sus resultado.

       En nuestras estrategias en Social Media debemos establecer
       indicadores de medición que nos digan si todo el trabajo que estamos
       realizando va por buen camino.

       Cada plataforma de Social Media tiene sus propios indicadores.


4. Sobrevivir en ambientes virtuales: análisis de datos, fundraising, coproducciones, creación WEB.
2. Algunos indicadores cuantitativos en caso de páginas web


                Estadísticas Página WEB
                  Plataforma                semana              mes 1           mes 2       mes 3       mes 3       Total
                               Páginas cargadas                  100             264         245         277         786
                               Visitantes únicos                 50              104         107         116         327
                               Visitantes por primera vez        30              63          75          90          228
                               Visitantes que regresan           16              41          32          26          99
                               Posición página etiquetada         5               9           7           9          25


          280                                                             120

          270
                    Páginas cargadas                                               Visitantes únicos
                                                                          115
          260
                                                                          110
          250
                                                                          105
          240                                        Páginas                                                        Visitantes
                                                     cargadas                                                       únicos
          230                                                             100

          220                                                              95
                     1           2             3                                        1           2           3


4. Sobrevivir en ambientes virtuales: análisis de datos, fundraising, coproducciones, creación WEB.
2. Algunos indicadores cuantitativos en caso de páginas web


               Estadísticas Página WEB
                  Plataforma                    semana          mes 1          mes 2       mes 3       mes 3         Total
                                   Páginas cargadas              100            264         245         277           786
                                   Visitantes únicos             50             104         107         116           327
                                   Visitantes por primera vez    30             63          75          90            228
                                   Visitantes que regresan       16             41          32          26            99
                                   Posición página etiquetada     5              9           7           9            25


                                                                          50
      100
                                                                          40
       80                                                                                    Visitantes que regresan
                                                                          30
       60
                      Visitantes por primera vez
       40                                         Visitantes              20
                                                                                                                   Visitantes
                                                  por primera                                                      que regresan
       20                                         vez                     10

        0                                                                  0
                 1             2              3                                        1           2           3


4. Sobrevivir en ambientes virtuales: análisis de datos, fundraising, coproducciones, creación WEB.
3. Algunos indicadores cuantitativos en caso de Facebook

                 Estadísticas Facebook
                                           semana             1             2           3    4           5           6       Total

                      Facebook   Posts Fan Page               2             6           3    4           5           6           26
                                 Reply post Fan Page          0             0           3    0           0           0           3
                                 Posts Perfil                               4           6    7           8           9           34
                                 Reply Perfil                 0             3           2    0           0           0           5
                                 Amigos Perfil                4            55           67   89          101     141             457
                                 Total Actividad              6            68           81   100         114     156             525           1050


                 Posts Perfil                                             Posts Fan Page                                         Amigos Perfil
40                                                        8
                                                                                                               500
30                                                        6                                                    400
20                                                        4                                                    300
                                                                                             Posts Fan         200                                        Amigos
10                                               Posts    2                                  Page                                                         Perfil
                                                                                                               100
0                                                Perfil                                                          0
                                                          0
     1   2   3    4     5   6    7                                1   2    3    4   5    6                               1   2    3    4   5    6     7


4. Sobrevivir en ambientes virtuales: análisis de datos, fundraising, coproducciones, creación WEB.
4. Algunos indicadores cuantitativos en caso de Twitter


                 Estadísticas Twitter
                                                     1           2           3             4            5            6   Total

                   Twitter   Posteos Abril           10         16          17             24           36       34       127

                             Followers totales       22         34          51             67           89       109      350

                             Retweets                                                                                      0


                                   Twitteos                                                     Followers totales
            40
                                                                                 120
            30                                                                   100
                                                                                  80
            20                                                                    60
                                                           Twitteos                                                      Followers
            10                                                                    40                                     totales
                                                                                  20
             0                                                                     0
                   1     2     3      4      5   6                                     1        2   3   4    5   6


4. Sobrevivir en ambientes virtuales: análisis de datos, fundraising, coproducciones, creación WEB.
4. Algunos indicadores cuantitativos en caso de Youtube

             Estadísticas Youtube
                                       semana            1              2           3             4         5         6

               Youtube    Nuevos videos                  2              3           4             3         4         4     20

                          Vistas totales                235             445        678            345       566       666   2935

                          visitas por semana            56              76         77             88        99        44    440

                          Site linking referrals         2              3           3             2         1         1     12


                               Vistas totales                                                visitas por semana
               800                                                               120
                                                                                 100
               600
                                                                                  80
               400                                                                60                                               visitas por
                                                       Vistas totales
                                                                                  40                                               semana
               200
                                                                                  20
                 0                                                                  0
                      1    2     3     4     5     6                                     1    2         3   4     5    6


4. Sobrevivir en ambientes virtuales: análisis de datos, fundraising, coproducciones, creación WEB.
5. Algunos indicadores cualitativos en caso de Páginas Web


       Documentando
        comentarios
         positivos o
          críticos


4. Sobrevivir en ambientes virtuales: análisis de datos, fundraising, coproducciones, creación WEB.
6. Algunos indicadores cualitativos en caso de Facebook


Documentando
comentarios
positivos o
críticos


 4. Sobrevivir en ambientes virtuales: análisis de datos, fundraising, coproducciones, creación WEB.
7. Algunos indicadores cualitativos en caso de Twitter


       Documentando
        comentarios
         positivos o
          críticos


4. Sobrevivir en ambientes virtuales: análisis de datos, fundraising, coproducciones, creación WEB.
8. Algunas herramientas estádisticas:


       Google Analytics:


                                              www.google.com/analytics/


4. Sobrevivir en ambientes virtuales: análisis de datos, fundraising, coproducciones, creación WEB.
9. Lecturas sugeridas:


           Salvador Carrasco Arroyo: Indicadores culturales, una reflexión.
           Universidad de Valencia. 1999.


4. Sobrevivir en ambientes virtuales: análisis de datos, fundraising, coproducciones, creación WEB.

Más contenido relacionado

Destacado

2024 State of Marketing Report – by Hubspot
2024 State of Marketing Report – by Hubspot2024 State of Marketing Report – by Hubspot
2024 State of Marketing Report – by HubspotMarius Sescu
 
Everything You Need To Know About ChatGPT
Everything You Need To Know About ChatGPTEverything You Need To Know About ChatGPT
Everything You Need To Know About ChatGPTExpeed Software
 
Product Design Trends in 2024 | Teenage Engineerings
Product Design Trends in 2024 | Teenage EngineeringsProduct Design Trends in 2024 | Teenage Engineerings
Product Design Trends in 2024 | Teenage EngineeringsPixeldarts
 
How Race, Age and Gender Shape Attitudes Towards Mental Health
How Race, Age and Gender Shape Attitudes Towards Mental HealthHow Race, Age and Gender Shape Attitudes Towards Mental Health
How Race, Age and Gender Shape Attitudes Towards Mental HealthThinkNow
 
AI Trends in Creative Operations 2024 by Artwork Flow.pdf
AI Trends in Creative Operations 2024 by Artwork Flow.pdfAI Trends in Creative Operations 2024 by Artwork Flow.pdf
AI Trends in Creative Operations 2024 by Artwork Flow.pdfmarketingartwork
 
PEPSICO Presentation to CAGNY Conference Feb 2024
PEPSICO Presentation to CAGNY Conference Feb 2024PEPSICO Presentation to CAGNY Conference Feb 2024
PEPSICO Presentation to CAGNY Conference Feb 2024Neil Kimberley
 
Content Methodology: A Best Practices Report (Webinar)
Content Methodology: A Best Practices Report (Webinar)Content Methodology: A Best Practices Report (Webinar)
Content Methodology: A Best Practices Report (Webinar)contently
 
How to Prepare For a Successful Job Search for 2024
How to Prepare For a Successful Job Search for 2024How to Prepare For a Successful Job Search for 2024
How to Prepare For a Successful Job Search for 2024Albert Qian
 
Social Media Marketing Trends 2024 // The Global Indie Insights
Social Media Marketing Trends 2024 // The Global Indie InsightsSocial Media Marketing Trends 2024 // The Global Indie Insights
Social Media Marketing Trends 2024 // The Global Indie InsightsKurio // The Social Media Age(ncy)
 
Trends In Paid Search: Navigating The Digital Landscape In 2024
Trends In Paid Search: Navigating The Digital Landscape In 2024Trends In Paid Search: Navigating The Digital Landscape In 2024
Trends In Paid Search: Navigating The Digital Landscape In 2024Search Engine Journal
 
5 Public speaking tips from TED - Visualized summary
5 Public speaking tips from TED - Visualized summary5 Public speaking tips from TED - Visualized summary
5 Public speaking tips from TED - Visualized summarySpeakerHub
 
ChatGPT and the Future of Work - Clark Boyd
ChatGPT and the Future of Work - Clark Boyd ChatGPT and the Future of Work - Clark Boyd
ChatGPT and the Future of Work - Clark Boyd Clark Boyd
 
Getting into the tech field. what next
Getting into the tech field. what next Getting into the tech field. what next
Getting into the tech field. what next Tessa Mero
 
Google's Just Not That Into You: Understanding Core Updates & Search Intent
Google's Just Not That Into You: Understanding Core Updates & Search IntentGoogle's Just Not That Into You: Understanding Core Updates & Search Intent
Google's Just Not That Into You: Understanding Core Updates & Search IntentLily Ray
 
Time Management & Productivity - Best Practices
Time Management & Productivity -  Best PracticesTime Management & Productivity -  Best Practices
Time Management & Productivity - Best PracticesVit Horky
 
The six step guide to practical project management
The six step guide to practical project managementThe six step guide to practical project management
The six step guide to practical project managementMindGenius
 
Beginners Guide to TikTok for Search - Rachel Pearson - We are Tilt __ Bright...
Beginners Guide to TikTok for Search - Rachel Pearson - We are Tilt __ Bright...Beginners Guide to TikTok for Search - Rachel Pearson - We are Tilt __ Bright...
Beginners Guide to TikTok for Search - Rachel Pearson - We are Tilt __ Bright...RachelPearson36
 

Destacado (20)

2024 State of Marketing Report – by Hubspot
2024 State of Marketing Report – by Hubspot2024 State of Marketing Report – by Hubspot
2024 State of Marketing Report – by Hubspot
 
Everything You Need To Know About ChatGPT
Everything You Need To Know About ChatGPTEverything You Need To Know About ChatGPT
Everything You Need To Know About ChatGPT
 
Product Design Trends in 2024 | Teenage Engineerings
Product Design Trends in 2024 | Teenage EngineeringsProduct Design Trends in 2024 | Teenage Engineerings
Product Design Trends in 2024 | Teenage Engineerings
 
How Race, Age and Gender Shape Attitudes Towards Mental Health
How Race, Age and Gender Shape Attitudes Towards Mental HealthHow Race, Age and Gender Shape Attitudes Towards Mental Health
How Race, Age and Gender Shape Attitudes Towards Mental Health
 
AI Trends in Creative Operations 2024 by Artwork Flow.pdf
AI Trends in Creative Operations 2024 by Artwork Flow.pdfAI Trends in Creative Operations 2024 by Artwork Flow.pdf
AI Trends in Creative Operations 2024 by Artwork Flow.pdf
 
Skeleton Culture Code
Skeleton Culture CodeSkeleton Culture Code
Skeleton Culture Code
 
PEPSICO Presentation to CAGNY Conference Feb 2024
PEPSICO Presentation to CAGNY Conference Feb 2024PEPSICO Presentation to CAGNY Conference Feb 2024
PEPSICO Presentation to CAGNY Conference Feb 2024
 
Content Methodology: A Best Practices Report (Webinar)
Content Methodology: A Best Practices Report (Webinar)Content Methodology: A Best Practices Report (Webinar)
Content Methodology: A Best Practices Report (Webinar)
 
How to Prepare For a Successful Job Search for 2024
How to Prepare For a Successful Job Search for 2024How to Prepare For a Successful Job Search for 2024
How to Prepare For a Successful Job Search for 2024
 
Social Media Marketing Trends 2024 // The Global Indie Insights
Social Media Marketing Trends 2024 // The Global Indie InsightsSocial Media Marketing Trends 2024 // The Global Indie Insights
Social Media Marketing Trends 2024 // The Global Indie Insights
 
Trends In Paid Search: Navigating The Digital Landscape In 2024
Trends In Paid Search: Navigating The Digital Landscape In 2024Trends In Paid Search: Navigating The Digital Landscape In 2024
Trends In Paid Search: Navigating The Digital Landscape In 2024
 
5 Public speaking tips from TED - Visualized summary
5 Public speaking tips from TED - Visualized summary5 Public speaking tips from TED - Visualized summary
5 Public speaking tips from TED - Visualized summary
 
ChatGPT and the Future of Work - Clark Boyd
ChatGPT and the Future of Work - Clark Boyd ChatGPT and the Future of Work - Clark Boyd
ChatGPT and the Future of Work - Clark Boyd
 
Getting into the tech field. what next
Getting into the tech field. what next Getting into the tech field. what next
Getting into the tech field. what next
 
Google's Just Not That Into You: Understanding Core Updates & Search Intent
Google's Just Not That Into You: Understanding Core Updates & Search IntentGoogle's Just Not That Into You: Understanding Core Updates & Search Intent
Google's Just Not That Into You: Understanding Core Updates & Search Intent
 
How to have difficult conversations
How to have difficult conversations How to have difficult conversations
How to have difficult conversations
 
Introduction to Data Science
Introduction to Data ScienceIntroduction to Data Science
Introduction to Data Science
 
Time Management & Productivity - Best Practices
Time Management & Productivity -  Best PracticesTime Management & Productivity -  Best Practices
Time Management & Productivity - Best Practices
 
The six step guide to practical project management
The six step guide to practical project managementThe six step guide to practical project management
The six step guide to practical project management
 
Beginners Guide to TikTok for Search - Rachel Pearson - We are Tilt __ Bright...
Beginners Guide to TikTok for Search - Rachel Pearson - We are Tilt __ Bright...Beginners Guide to TikTok for Search - Rachel Pearson - We are Tilt __ Bright...
Beginners Guide to TikTok for Search - Rachel Pearson - We are Tilt __ Bright...
 

Gestion cultural 2.0 4 indicadores culturales en redes sociales

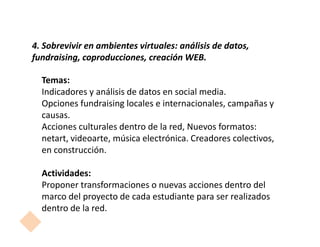
  • 1. 4. Sobrevivir en ambientes virtuales: análisis de datos, fundraising, coproducciones, creación WEB. Temas: Indicadores y análisis de datos en social media. Opciones fundraising locales e internacionales, campañas y causas. Acciones culturales dentro de la red, Nuevos formatos: netart, videoarte, música electrónica. Creadores colectivos, en construcción. Actividades: Proponer transformaciones o nuevas acciones dentro del marco del proyecto de cada estudiante para ser realizados dentro de la red.
  • 2. 1. Indicadores y análisis de datos en social media. En nuestras estrategias en Social Media debemos establecer indicadores de medición que nos digan si todo el trabajo que estamos realizando va por buen camino. Debemos realizar un trabajo de selección de indicadores con los cuáles vamos a medir nuestro proyecto desde el inicio hasta el fin. Los indicadores representan aquella parte de la realidad que ha sido considerada más relevante por quien los ha diseñado. Pierden, por tanto, una parte de la riqueza de aquello que quieren representar. 4. Sobrevivir en ambientes virtuales: análisis de datos, fundraising, coproducciones, creación WEB.
  • 3. 1. Indicadores y análisis de datos en social media. Para el diseño de los indicadores hay que tener en cuenta lo siguiente: FUNCIONES: Explicitar: sacar afuera lo implícito. Expresar claramente lo que se entiende. Verificar: Probar. CARACTERÍSTICAS: •Central: Debe medir lo esencial (o el núcleo). •Plausible: Lo que mide el indicador debe ser atribuible al proyecto. •Objetivo: No debe depender de otras mediciones. •Económico: No debe ser costoso obtenerlo. 4. Sobrevivir en ambientes virtuales: análisis de datos, fundraising, coproducciones, creación WEB.
  • 4. 1. Indicadores y análisis de datos en social media. COMPONENTES DE LOS INDICADORES: QUIÉN: Los beneficiarios. DÓNDE: Lugar CUÁNDO: Tiempo. QUÉ: Lo que pretende solucionar. CÓMO: Efecto o calidad. CUÁNTO: Cantidad. 4. Sobrevivir en ambientes virtuales: análisis de datos, fundraising, coproducciones, creación WEB.
  • 5. 1. Indicadores y análisis de datos en social media. Ejemplo de Indicador: Cincuenta egresados del curso han conseguido financiar sus proyectos en Noviembre 2011 en Lima. •CANTIDAD: Cincuenta •QUIEN: Egresados del curso. •QUÉ: Han conseguido financiar su proyecto •CÓMO : estrategia de fundraising. •CUÁNDO o TIEMPO: En noviembre 2011. •LUGAR: En Lima 4. Sobrevivir en ambientes virtuales: análisis de datos, fundraising, coproducciones, creación WEB.
  • 6. 1. Indicadores y análisis de datos en social media. Recordemos que los indicadores pueden ser: Cuantitavos: aquellos cuyos valores se pueden contar y ordenar de mayor a menor. Pueden expresarse numéricamente y gráficamente. Se utilizan sobre todo para medir cantidades y compararlas. Cualitativos: son elementos que indican la calidad del proyecto, pueden ser hechos, opiniones o percepciones que señalen condiciones o situaciones específicas. 4. Sobrevivir en ambientes virtuales: análisis de datos, fundraising, coproducciones, creación WEB.
  • 7. 1. Indicadores y análisis de datos en social media. Un indicador óptimo será aquel que dote de la información necesaria para la toma de decisiones a quién encarga el proyecto, al mismo tiempo que permite al gestor del proyecto sentirse seguro y confiado en la medición de sus resultado. En nuestras estrategias en Social Media debemos establecer indicadores de medición que nos digan si todo el trabajo que estamos realizando va por buen camino. Cada plataforma de Social Media tiene sus propios indicadores. 4. Sobrevivir en ambientes virtuales: análisis de datos, fundraising, coproducciones, creación WEB.
  • 8. 2. Algunos indicadores cuantitativos en caso de páginas web Estadísticas Página WEB Plataforma semana mes 1 mes 2 mes 3 mes 3 Total Páginas cargadas 100 264 245 277 786 Visitantes únicos 50 104 107 116 327 Visitantes por primera vez 30 63 75 90 228 Visitantes que regresan 16 41 32 26 99 Posición página etiquetada 5 9 7 9 25 280 120 270 Páginas cargadas Visitantes únicos 115 260 110 250 105 240 Páginas Visitantes cargadas únicos 230 100 220 95 1 2 3 1 2 3 4. Sobrevivir en ambientes virtuales: análisis de datos, fundraising, coproducciones, creación WEB.
  • 9. 2. Algunos indicadores cuantitativos en caso de páginas web Estadísticas Página WEB Plataforma semana mes 1 mes 2 mes 3 mes 3 Total Páginas cargadas 100 264 245 277 786 Visitantes únicos 50 104 107 116 327 Visitantes por primera vez 30 63 75 90 228 Visitantes que regresan 16 41 32 26 99 Posición página etiquetada 5 9 7 9 25 50 100 40 80 Visitantes que regresan 30 60 Visitantes por primera vez 40 Visitantes 20 Visitantes por primera que regresan 20 vez 10 0 0 1 2 3 1 2 3 4. Sobrevivir en ambientes virtuales: análisis de datos, fundraising, coproducciones, creación WEB.
  • 10. 3. Algunos indicadores cuantitativos en caso de Facebook Estadísticas Facebook semana 1 2 3 4 5 6 Total Facebook Posts Fan Page 2 6 3 4 5 6 26 Reply post Fan Page 0 0 3 0 0 0 3 Posts Perfil 4 6 7 8 9 34 Reply Perfil 0 3 2 0 0 0 5 Amigos Perfil 4 55 67 89 101 141 457 Total Actividad 6 68 81 100 114 156 525 1050 Posts Perfil Posts Fan Page Amigos Perfil 40 8 500 30 6 400 20 4 300 Posts Fan 200 Amigos 10 Posts 2 Page Perfil 100 0 Perfil 0 0 1 2 3 4 5 6 7 1 2 3 4 5 6 1 2 3 4 5 6 7 4. Sobrevivir en ambientes virtuales: análisis de datos, fundraising, coproducciones, creación WEB.
  • 11. 4. Algunos indicadores cuantitativos en caso de Twitter Estadísticas Twitter 1 2 3 4 5 6 Total Twitter Posteos Abril 10 16 17 24 36 34 127 Followers totales 22 34 51 67 89 109 350 Retweets 0 Twitteos Followers totales 40 120 30 100 80 20 60 Twitteos Followers 10 40 totales 20 0 0 1 2 3 4 5 6 1 2 3 4 5 6 4. Sobrevivir en ambientes virtuales: análisis de datos, fundraising, coproducciones, creación WEB.
  • 12. 4. Algunos indicadores cuantitativos en caso de Youtube Estadísticas Youtube semana 1 2 3 4 5 6 Youtube Nuevos videos 2 3 4 3 4 4 20 Vistas totales 235 445 678 345 566 666 2935 visitas por semana 56 76 77 88 99 44 440 Site linking referrals 2 3 3 2 1 1 12 Vistas totales visitas por semana 800 120 100 600 80 400 60 visitas por Vistas totales 40 semana 200 20 0 0 1 2 3 4 5 6 1 2 3 4 5 6 4. Sobrevivir en ambientes virtuales: análisis de datos, fundraising, coproducciones, creación WEB.
  • 13. 5. Algunos indicadores cualitativos en caso de Páginas Web Documentando comentarios positivos o críticos 4. Sobrevivir en ambientes virtuales: análisis de datos, fundraising, coproducciones, creación WEB.
  • 14. 6. Algunos indicadores cualitativos en caso de Facebook Documentando comentarios positivos o críticos 4. Sobrevivir en ambientes virtuales: análisis de datos, fundraising, coproducciones, creación WEB.
  • 15. 7. Algunos indicadores cualitativos en caso de Twitter Documentando comentarios positivos o críticos 4. Sobrevivir en ambientes virtuales: análisis de datos, fundraising, coproducciones, creación WEB.
  • 16. 8. Algunas herramientas estádisticas: Google Analytics: www.google.com/analytics/ 4. Sobrevivir en ambientes virtuales: análisis de datos, fundraising, coproducciones, creación WEB.
  • 17. 9. Lecturas sugeridas: Salvador Carrasco Arroyo: Indicadores culturales, una reflexión. Universidad de Valencia. 1999. 4. Sobrevivir en ambientes virtuales: análisis de datos, fundraising, coproducciones, creación WEB.