SlideShare una empresa de Scribd logo
1 de 5
Percent
Median1
Central tendency2
Range3
Variable 2016 2017 2018 2019 2016Longer
run
Change in real GDP

June projection

Unemployment rate
June projection
PCE inflation
June projection
Core PCE inflation4
June projection
1.8
2.0
4.8
4.7
1.3
1.4
1.7
1.7
2.0
2.0
4.6
4.6
1.9
1.9
1.8
1.9
2.0
2.0
4.5
4.6
2.0
2.0
2.0
2.0
1.8
n.a.
4.6
n.a.
2.0
n.a.
2.0
n.a.
1.8
2.0
4.8
4.8
2.0
2.0
1.7 – 1.9
1.9 – 2.0
4.7 – 4.9
4.6 – 4.8
1.2 – 1.4
1.3 – 1.7
1.6 – 1.8
1.6 – 1.8
Memo: Projected
appropriate policy path
Federal funds rate 0.6 1.1 1.9 2.6 2.9 0.6 – 0.9
June projection 0.9 1.6 2.4 n.a. 3.0 0.6 – 0.9
2017
1.9 – 2.2
1.9 – 2.2
4.5 – 4.7
4.5 – 4.7
1.7 – 1.9
1.7 – 2.0
1.7 – 1.9
1.7 – 2.0
1.1 – 1.8
1.4 – 1.9
2018
1.8 – 2.1
1.8 – 2.1
4.4 – 4.7
4.4 – 4.8
1.8 – 2.0
1.9 – 2.0
1.9 – 2.0
1.9 – 2.0
1.9 – 2.8
2.1 – 2.9
2019 2016Longer
run
1.7 – 2.0
n.a.
4.4 – 4.8
n.a.
1.9 – 2.0
n.a.
2.0
n.a.
1.7 – 2.0
1.8 – 2.0
4.7 – 5.0
4.7 – 5.0
2.0
2.0
1.7 – 2.0
1.8 – 2.2
4.7 – 4.9
4.5 – 4.9
1.1 – 1.7
1.3 – 2.0
1.5 – 2.0
1.3 – 2.0
2.4 – 3.0 2.8 – 3.0 0.4 – 1.1
n.a. 3.0 – 3.3 0.6 – 1.4
2017
1.6 – 2.5
1.6 – 2.4
4.4 – 4.8
4.3 – 4.8
1.5 – 2.0
1.6 – 2.0
1.6 – 2.0
1.6 – 2.0
0.6 – 2.1
0.6 – 2.4
2018
1.5 – 2.3
1.5 – 2.2
4.3 – 4.9
4.3 – 5.0
1.8 – 2.0
1.8 – 2.1
1.8 – 2.0
1.8 – 2.1
0.6 – 3.1
0.6 – 3.4
2019 Longer
run
1.6 – 2.2 1.6 – 2.2
n.a. 1.6 – 2.4
4.2 – 5.0 4.5 – 5.0
n.a. 4.6 – 5.0
1.8 – 2.1 2.0
n.a. 2.0
1.8 – 2.1
n.a.
0.6 – 3.8 2.5 – 3.8
n.a. 2.8 – 3.8
Note: Projections of change in real gross domestic product (GDP) and projections for both measures of inflation are percent changes from the fourth quarter of the previous
year to the fourth quarter of the year indicated. PCE inflation and core PCE inflation are the percentage rates of change in, respectively, the price index for personal consumption
expenditures (PCE) and the price index for PCE excluding food and energy. Projections for the unemployment rate are for the average civilian unemployment rate in the fourth
quarter of the year indicated. Each participant’s projections are based on his or her assessment of appropriate monetary policy. Longer-run projections represent each participant’s
assessment of the rate to which each variable would be expected to converge under appropriate monetary policy and in the absence of further shocks to the economy. The projections
for the federal funds rate are the value of the midpoint of the projected appropriate target range for the federal funds rate or the projected appropriate target level for the federal
funds rate at the end of the specified calendar year or over the longer run. The June projections were made in conjunction with the meeting of the Federal Open Market Committee on
June 14–15, 2016. One participant did not submit longer-run projections in conjunction with the June 14–15, 2016, meeting. For the September 20–21, 2016, meeting, one participant
did not submit longer-run projections for the change in real GDP, the unemployment rate, or the federal funds rate.
1. For each period, the median is the middle projection when the projections are arranged from lowest to highest. When the number of projections is even, the median is the
average of the two middle projections.
2. The central tendency excludes the three highest and three lowest projections for each variable in each year.
3. The range for a variable in a given year includes all participants’ projections, from lowest to highest, for that variable in that year.
4. Longer-run projections for core PCE inflation are not collected.
For release at 2:00 p.m., EDT, September 21, 2016
Economic projections of Federal Reserve Board members and Federal Reserve Bank presidents under
their individual assessments of projected appropriate monetary policy, September 2016
Advance release of table 1 of the Summary of Economic Projections to be released with the FOMC minutes
For release at 2:00 p.m., EDT, September 21, 2016
Figure 1. Medians, central tendencies, and ranges of economic projections, 2016–19 and over the longer run
Percent
Change in real GDP
Central tendency of projections
Range of projections
Median of projections
Actual
2011 2012 2013 2014 2015 2016 2017 2018 2019 Longer

run

Unemployment rate
2011 2012 2013 2014 2015 2016 2017 2018 2019 Longer

run

3

2

1

Percent

9

8

7

6

5

4

Percent
PCE inflation
2011 2012 2013 2014 2015 2016 2017 2018 2019 Longer

run

3

2

1

Note: Definitions of variables and other explanations are in the notes to the projections table. The data for the
actual values of the variables are annual.
For release at 2:00 p.m., EDT, September 21, 2016
Figure 2. FOMC participants’ assessments of appropriate monetary policy: Midpoint of target range or target level for
the federal funds rate
Percent
2016 2017 2018 2019 Longer run
0.0
0.5
1.0
1.5
2.0
2.5
3.0
3.5
4.0
4.5
5.0
Note: Each shaded circle indicates the value (rounded to the nearest 1/8 percentage point) of an individual par-
ticipant’s judgment of the midpoint of the appropriate target range for the federal funds rate or the appropriate target
level for the federal funds rate at the end of the specified calendar year or over the longer run. One participant did not
submit longer-run projections for the federal funds rate.
For release at 2:00 p.m., EDT, September 21, 2016
Explanation of Economic Projections Charts
The charts show actual values and projections for three economic variables, based on
FOMC participants’ individual assessments of appropriate monetary policy:
• Change in Real Gross Domestic Product (GDP)—as measured from the fourth
quarter of the previous year to the fourth quarter of the year indicated, with
values plotted at the end of each year.
• Unemployment Rate—the average civilian unemployment rate in the fourth
quarter of each year, with values plotted at the end of each year.
• PCE Inflation—as measured by the change in the personal consumption
expenditures (PCE) price index from the fourth quarter of the previous year to
the fourth quarter of the year indicated, with values plotted at the end of each
year.
Information for these variables is shown for each year from 2011 to 2019, and for the longer
run.
The solid black line, labeled “Actual,” shows the historical values for each variable.
The lightly shaded areas represent the ranges of the projections of policymakers. The
bottom of the range for each variable is the lowest of all of the projections for that year or
period. Likewise, the top of the range is the highest of all of the projections for that year or
period.
The dark shaded areas represent the central tendency, which is a narrower version of the
range that excludes the three highest and three lowest projections for each variable in each
year or period.
The solid red line depicts the median projection in each period for each variable. The
median value in each period is the middle projection when the projections are arranged from
lowest to highest. When the number of projections is even, the median is the average of the
two middle projections.
The longer-run projections, which are shown on the far right side of the charts, are the rates
of growth, unemployment, and inflation to which a policymaker expects the economy to
converge over time—maybe in five or six years—in the absence of further shocks and under
appropriate monetary policy. Because appropriate monetary policy, by definition, is aimed at
achieving the Federal Reserve’s dual mandate of maximum employment and price stability in
the longer run, policymakers’ longer-run projections for economic growth and
unemployment may be interpreted, respectively, as estimates of the economy’s normal or
trend rate of growth and its normal unemployment rate over the longer run. The longer-run
projection shown for inflation is the rate of inflation judged to be most consistent with the
Federal Reserve’s dual mandate.
For release at 2:00 p.m., EDT, September 21, 2016
Explanation of Policy Path Chart
This chart is based on policymakers’ assessments of appropriate monetary policy, which, by
definition, is the future path of policy that each participant deems most likely to foster
outcomes for economic activity and inflation that best satisfy his or her interpretation of the
Federal Reserve’s dual objectives of maximum employment and stable prices.
Each shaded circle indicates the value (rounded to the nearest ⅛ percentage point) of an
individual participant’s judgment of the midpoint of the appropriate target range for the
federal funds rate or the appropriate target level for the federal funds rate at the end of the
specified calendar year or over the longer run.

Más contenido relacionado

Último

THE OBSTACLES THAT IMPEDE THE DEVELOPMENT OF BRAZIL IN THE CONTEMPORARY ERA A...
THE OBSTACLES THAT IMPEDE THE DEVELOPMENT OF BRAZIL IN THE CONTEMPORARY ERA A...THE OBSTACLES THAT IMPEDE THE DEVELOPMENT OF BRAZIL IN THE CONTEMPORARY ERA A...
THE OBSTACLES THAT IMPEDE THE DEVELOPMENT OF BRAZIL IN THE CONTEMPORARY ERA A...
Faga1939
 
{Qatar{^🚀^(+971558539980**}})Abortion Pills for Sale in Dubai. .abu dhabi, sh...
{Qatar{^🚀^(+971558539980**}})Abortion Pills for Sale in Dubai. .abu dhabi, sh...{Qatar{^🚀^(+971558539980**}})Abortion Pills for Sale in Dubai. .abu dhabi, sh...
{Qatar{^🚀^(+971558539980**}})Abortion Pills for Sale in Dubai. .abu dhabi, sh...
hyt3577
 

Último (20)

Embed-4.pdf lkdiinlajeklhndklheduhuekjdh
Embed-4.pdf lkdiinlajeklhndklheduhuekjdhEmbed-4.pdf lkdiinlajeklhndklheduhuekjdh
Embed-4.pdf lkdiinlajeklhndklheduhuekjdh
 
THE OBSTACLES THAT IMPEDE THE DEVELOPMENT OF BRAZIL IN THE CONTEMPORARY ERA A...
THE OBSTACLES THAT IMPEDE THE DEVELOPMENT OF BRAZIL IN THE CONTEMPORARY ERA A...THE OBSTACLES THAT IMPEDE THE DEVELOPMENT OF BRAZIL IN THE CONTEMPORARY ERA A...
THE OBSTACLES THAT IMPEDE THE DEVELOPMENT OF BRAZIL IN THE CONTEMPORARY ERA A...
 
declarationleaders_sd_re_greens_theleft_5.pdf
declarationleaders_sd_re_greens_theleft_5.pdfdeclarationleaders_sd_re_greens_theleft_5.pdf
declarationleaders_sd_re_greens_theleft_5.pdf
 
KING VISHNU BHAGWANON KA BHAGWAN PARAMATMONKA PARATOMIC PARAMANU KASARVAMANVA...
KING VISHNU BHAGWANON KA BHAGWAN PARAMATMONKA PARATOMIC PARAMANU KASARVAMANVA...KING VISHNU BHAGWANON KA BHAGWAN PARAMATMONKA PARATOMIC PARAMANU KASARVAMANVA...
KING VISHNU BHAGWANON KA BHAGWAN PARAMATMONKA PARATOMIC PARAMANU KASARVAMANVA...
 
04052024_First India Newspaper Jaipur.pdf
04052024_First India Newspaper Jaipur.pdf04052024_First India Newspaper Jaipur.pdf
04052024_First India Newspaper Jaipur.pdf
 
Busty Desi⚡Call Girls in Vasundhara Ghaziabad >༒8448380779 Escort Service
Busty Desi⚡Call Girls in Vasundhara Ghaziabad >༒8448380779 Escort ServiceBusty Desi⚡Call Girls in Vasundhara Ghaziabad >༒8448380779 Escort Service
Busty Desi⚡Call Girls in Vasundhara Ghaziabad >༒8448380779 Escort Service
 
Nara Chandrababu Naidu's Visionary Policies For Andhra Pradesh's Development
Nara Chandrababu Naidu's Visionary Policies For Andhra Pradesh's DevelopmentNara Chandrababu Naidu's Visionary Policies For Andhra Pradesh's Development
Nara Chandrababu Naidu's Visionary Policies For Andhra Pradesh's Development
 
*Navigating Electoral Terrain: TDP's Performance under N Chandrababu Naidu's ...
*Navigating Electoral Terrain: TDP's Performance under N Chandrababu Naidu's ...*Navigating Electoral Terrain: TDP's Performance under N Chandrababu Naidu's ...
*Navigating Electoral Terrain: TDP's Performance under N Chandrababu Naidu's ...
 
WhatsApp 📞 8448380779 ✅Call Girls In Chaura Sector 22 ( Noida)
WhatsApp 📞 8448380779 ✅Call Girls In Chaura Sector 22 ( Noida)WhatsApp 📞 8448380779 ✅Call Girls In Chaura Sector 22 ( Noida)
WhatsApp 📞 8448380779 ✅Call Girls In Chaura Sector 22 ( Noida)
 
{Qatar{^🚀^(+971558539980**}})Abortion Pills for Sale in Dubai. .abu dhabi, sh...
{Qatar{^🚀^(+971558539980**}})Abortion Pills for Sale in Dubai. .abu dhabi, sh...{Qatar{^🚀^(+971558539980**}})Abortion Pills for Sale in Dubai. .abu dhabi, sh...
{Qatar{^🚀^(+971558539980**}})Abortion Pills for Sale in Dubai. .abu dhabi, sh...
 
422524114-Patriarchy-Kamla-Bhasin gg.pdf
422524114-Patriarchy-Kamla-Bhasin gg.pdf422524114-Patriarchy-Kamla-Bhasin gg.pdf
422524114-Patriarchy-Kamla-Bhasin gg.pdf
 
Gujarat-SEBCs.pdf pfpkoopapriorjfperjreie
Gujarat-SEBCs.pdf pfpkoopapriorjfperjreieGujarat-SEBCs.pdf pfpkoopapriorjfperjreie
Gujarat-SEBCs.pdf pfpkoopapriorjfperjreie
 
Busty Desi⚡Call Girls in Sector 62 Noida Escorts >༒8448380779 Escort Service
Busty Desi⚡Call Girls in Sector 62 Noida Escorts >༒8448380779 Escort ServiceBusty Desi⚡Call Girls in Sector 62 Noida Escorts >༒8448380779 Escort Service
Busty Desi⚡Call Girls in Sector 62 Noida Escorts >༒8448380779 Escort Service
 
Enjoy Night ≽ 8448380779 ≼ Call Girls In Gurgaon Sector 46 (Gurgaon)
Enjoy Night ≽ 8448380779 ≼ Call Girls In Gurgaon Sector 46 (Gurgaon)Enjoy Night ≽ 8448380779 ≼ Call Girls In Gurgaon Sector 46 (Gurgaon)
Enjoy Night ≽ 8448380779 ≼ Call Girls In Gurgaon Sector 46 (Gurgaon)
 
China's soft power in 21st century .pptx
China's soft power in 21st century   .pptxChina's soft power in 21st century   .pptx
China's soft power in 21st century .pptx
 
Enjoy Night ≽ 8448380779 ≼ Call Girls In Gurgaon Sector 47 (Gurgaon)
Enjoy Night ≽ 8448380779 ≼ Call Girls In Gurgaon Sector 47 (Gurgaon)Enjoy Night ≽ 8448380779 ≼ Call Girls In Gurgaon Sector 47 (Gurgaon)
Enjoy Night ≽ 8448380779 ≼ Call Girls In Gurgaon Sector 47 (Gurgaon)
 
Transformative Leadership: N Chandrababu Naidu and TDP's Vision for Innovatio...
Transformative Leadership: N Chandrababu Naidu and TDP's Vision for Innovatio...Transformative Leadership: N Chandrababu Naidu and TDP's Vision for Innovatio...
Transformative Leadership: N Chandrababu Naidu and TDP's Vision for Innovatio...
 
Enjoy Night ≽ 8448380779 ≼ Call Girls In Gurgaon Sector 48 (Gurgaon)
Enjoy Night ≽ 8448380779 ≼ Call Girls In Gurgaon Sector 48 (Gurgaon)Enjoy Night ≽ 8448380779 ≼ Call Girls In Gurgaon Sector 48 (Gurgaon)
Enjoy Night ≽ 8448380779 ≼ Call Girls In Gurgaon Sector 48 (Gurgaon)
 
Politician uddhav thackeray biography- Full Details
Politician uddhav thackeray biography- Full DetailsPolitician uddhav thackeray biography- Full Details
Politician uddhav thackeray biography- Full Details
 
05052024_First India Newspaper Jaipur.pdf
05052024_First India Newspaper Jaipur.pdf05052024_First India Newspaper Jaipur.pdf
05052024_First India Newspaper Jaipur.pdf
 

Destacado

How Race, Age and Gender Shape Attitudes Towards Mental Health
How Race, Age and Gender Shape Attitudes Towards Mental HealthHow Race, Age and Gender Shape Attitudes Towards Mental Health
How Race, Age and Gender Shape Attitudes Towards Mental Health
ThinkNow
 
Social Media Marketing Trends 2024 // The Global Indie Insights
Social Media Marketing Trends 2024 // The Global Indie InsightsSocial Media Marketing Trends 2024 // The Global Indie Insights
Social Media Marketing Trends 2024 // The Global Indie Insights
Kurio // The Social Media Age(ncy)
 

Destacado (20)

2024 State of Marketing Report – by Hubspot
2024 State of Marketing Report – by Hubspot2024 State of Marketing Report – by Hubspot
2024 State of Marketing Report – by Hubspot
 
Everything You Need To Know About ChatGPT
Everything You Need To Know About ChatGPTEverything You Need To Know About ChatGPT
Everything You Need To Know About ChatGPT
 
Product Design Trends in 2024 | Teenage Engineerings
Product Design Trends in 2024 | Teenage EngineeringsProduct Design Trends in 2024 | Teenage Engineerings
Product Design Trends in 2024 | Teenage Engineerings
 
How Race, Age and Gender Shape Attitudes Towards Mental Health
How Race, Age and Gender Shape Attitudes Towards Mental HealthHow Race, Age and Gender Shape Attitudes Towards Mental Health
How Race, Age and Gender Shape Attitudes Towards Mental Health
 
AI Trends in Creative Operations 2024 by Artwork Flow.pdf
AI Trends in Creative Operations 2024 by Artwork Flow.pdfAI Trends in Creative Operations 2024 by Artwork Flow.pdf
AI Trends in Creative Operations 2024 by Artwork Flow.pdf
 
Skeleton Culture Code
Skeleton Culture CodeSkeleton Culture Code
Skeleton Culture Code
 
PEPSICO Presentation to CAGNY Conference Feb 2024
PEPSICO Presentation to CAGNY Conference Feb 2024PEPSICO Presentation to CAGNY Conference Feb 2024
PEPSICO Presentation to CAGNY Conference Feb 2024
 
Content Methodology: A Best Practices Report (Webinar)
Content Methodology: A Best Practices Report (Webinar)Content Methodology: A Best Practices Report (Webinar)
Content Methodology: A Best Practices Report (Webinar)
 
How to Prepare For a Successful Job Search for 2024
How to Prepare For a Successful Job Search for 2024How to Prepare For a Successful Job Search for 2024
How to Prepare For a Successful Job Search for 2024
 
Social Media Marketing Trends 2024 // The Global Indie Insights
Social Media Marketing Trends 2024 // The Global Indie InsightsSocial Media Marketing Trends 2024 // The Global Indie Insights
Social Media Marketing Trends 2024 // The Global Indie Insights
 
Trends In Paid Search: Navigating The Digital Landscape In 2024
Trends In Paid Search: Navigating The Digital Landscape In 2024Trends In Paid Search: Navigating The Digital Landscape In 2024
Trends In Paid Search: Navigating The Digital Landscape In 2024
 
5 Public speaking tips from TED - Visualized summary
5 Public speaking tips from TED - Visualized summary5 Public speaking tips from TED - Visualized summary
5 Public speaking tips from TED - Visualized summary
 
ChatGPT and the Future of Work - Clark Boyd
ChatGPT and the Future of Work - Clark Boyd ChatGPT and the Future of Work - Clark Boyd
ChatGPT and the Future of Work - Clark Boyd
 
Getting into the tech field. what next
Getting into the tech field. what next Getting into the tech field. what next
Getting into the tech field. what next
 
Google's Just Not That Into You: Understanding Core Updates & Search Intent
Google's Just Not That Into You: Understanding Core Updates & Search IntentGoogle's Just Not That Into You: Understanding Core Updates & Search Intent
Google's Just Not That Into You: Understanding Core Updates & Search Intent
 
How to have difficult conversations
How to have difficult conversations How to have difficult conversations
How to have difficult conversations
 
Introduction to Data Science
Introduction to Data ScienceIntroduction to Data Science
Introduction to Data Science
 
Time Management & Productivity - Best Practices
Time Management & Productivity -  Best PracticesTime Management & Productivity -  Best Practices
Time Management & Productivity - Best Practices
 
The six step guide to practical project management
The six step guide to practical project managementThe six step guide to practical project management
The six step guide to practical project management
 
Beginners Guide to TikTok for Search - Rachel Pearson - We are Tilt __ Bright...
Beginners Guide to TikTok for Search - Rachel Pearson - We are Tilt __ Bright...Beginners Guide to TikTok for Search - Rachel Pearson - We are Tilt __ Bright...
Beginners Guide to TikTok for Search - Rachel Pearson - We are Tilt __ Bright...
 

Federal Reserve Open Market Committee Meeting Notes September 21 2016

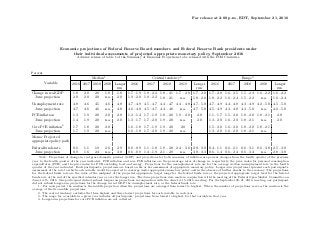
  • 1. Percent Median1 Central tendency2 Range3 Variable 2016 2017 2018 2019 2016Longer run Change in real GDP June projection Unemployment rate June projection PCE inflation June projection Core PCE inflation4 June projection 1.8 2.0 4.8 4.7 1.3 1.4 1.7 1.7 2.0 2.0 4.6 4.6 1.9 1.9 1.8 1.9 2.0 2.0 4.5 4.6 2.0 2.0 2.0 2.0 1.8 n.a. 4.6 n.a. 2.0 n.a. 2.0 n.a. 1.8 2.0 4.8 4.8 2.0 2.0 1.7 – 1.9 1.9 – 2.0 4.7 – 4.9 4.6 – 4.8 1.2 – 1.4 1.3 – 1.7 1.6 – 1.8 1.6 – 1.8 Memo: Projected appropriate policy path Federal funds rate 0.6 1.1 1.9 2.6 2.9 0.6 – 0.9 June projection 0.9 1.6 2.4 n.a. 3.0 0.6 – 0.9 2017 1.9 – 2.2 1.9 – 2.2 4.5 – 4.7 4.5 – 4.7 1.7 – 1.9 1.7 – 2.0 1.7 – 1.9 1.7 – 2.0 1.1 – 1.8 1.4 – 1.9 2018 1.8 – 2.1 1.8 – 2.1 4.4 – 4.7 4.4 – 4.8 1.8 – 2.0 1.9 – 2.0 1.9 – 2.0 1.9 – 2.0 1.9 – 2.8 2.1 – 2.9 2019 2016Longer run 1.7 – 2.0 n.a. 4.4 – 4.8 n.a. 1.9 – 2.0 n.a. 2.0 n.a. 1.7 – 2.0 1.8 – 2.0 4.7 – 5.0 4.7 – 5.0 2.0 2.0 1.7 – 2.0 1.8 – 2.2 4.7 – 4.9 4.5 – 4.9 1.1 – 1.7 1.3 – 2.0 1.5 – 2.0 1.3 – 2.0 2.4 – 3.0 2.8 – 3.0 0.4 – 1.1 n.a. 3.0 – 3.3 0.6 – 1.4 2017 1.6 – 2.5 1.6 – 2.4 4.4 – 4.8 4.3 – 4.8 1.5 – 2.0 1.6 – 2.0 1.6 – 2.0 1.6 – 2.0 0.6 – 2.1 0.6 – 2.4 2018 1.5 – 2.3 1.5 – 2.2 4.3 – 4.9 4.3 – 5.0 1.8 – 2.0 1.8 – 2.1 1.8 – 2.0 1.8 – 2.1 0.6 – 3.1 0.6 – 3.4 2019 Longer run 1.6 – 2.2 1.6 – 2.2 n.a. 1.6 – 2.4 4.2 – 5.0 4.5 – 5.0 n.a. 4.6 – 5.0 1.8 – 2.1 2.0 n.a. 2.0 1.8 – 2.1 n.a. 0.6 – 3.8 2.5 – 3.8 n.a. 2.8 – 3.8 Note: Projections of change in real gross domestic product (GDP) and projections for both measures of inflation are percent changes from the fourth quarter of the previous year to the fourth quarter of the year indicated. PCE inflation and core PCE inflation are the percentage rates of change in, respectively, the price index for personal consumption expenditures (PCE) and the price index for PCE excluding food and energy. Projections for the unemployment rate are for the average civilian unemployment rate in the fourth quarter of the year indicated. Each participant’s projections are based on his or her assessment of appropriate monetary policy. Longer-run projections represent each participant’s assessment of the rate to which each variable would be expected to converge under appropriate monetary policy and in the absence of further shocks to the economy. The projections for the federal funds rate are the value of the midpoint of the projected appropriate target range for the federal funds rate or the projected appropriate target level for the federal funds rate at the end of the specified calendar year or over the longer run. The June projections were made in conjunction with the meeting of the Federal Open Market Committee on June 14–15, 2016. One participant did not submit longer-run projections in conjunction with the June 14–15, 2016, meeting. For the September 20–21, 2016, meeting, one participant did not submit longer-run projections for the change in real GDP, the unemployment rate, or the federal funds rate. 1. For each period, the median is the middle projection when the projections are arranged from lowest to highest. When the number of projections is even, the median is the average of the two middle projections. 2. The central tendency excludes the three highest and three lowest projections for each variable in each year. 3. The range for a variable in a given year includes all participants’ projections, from lowest to highest, for that variable in that year. 4. Longer-run projections for core PCE inflation are not collected. For release at 2:00 p.m., EDT, September 21, 2016 Economic projections of Federal Reserve Board members and Federal Reserve Bank presidents under their individual assessments of projected appropriate monetary policy, September 2016 Advance release of table 1 of the Summary of Economic Projections to be released with the FOMC minutes
  • 2. For release at 2:00 p.m., EDT, September 21, 2016 Figure 1. Medians, central tendencies, and ranges of economic projections, 2016–19 and over the longer run Percent Change in real GDP Central tendency of projections Range of projections Median of projections Actual 2011 2012 2013 2014 2015 2016 2017 2018 2019 Longer run Unemployment rate 2011 2012 2013 2014 2015 2016 2017 2018 2019 Longer run 3 2 1 Percent 9 8 7 6 5 4 Percent PCE inflation 2011 2012 2013 2014 2015 2016 2017 2018 2019 Longer run 3 2 1 Note: Definitions of variables and other explanations are in the notes to the projections table. The data for the actual values of the variables are annual.
  • 3. For release at 2:00 p.m., EDT, September 21, 2016 Figure 2. FOMC participants’ assessments of appropriate monetary policy: Midpoint of target range or target level for the federal funds rate Percent 2016 2017 2018 2019 Longer run 0.0 0.5 1.0 1.5 2.0 2.5 3.0 3.5 4.0 4.5 5.0 Note: Each shaded circle indicates the value (rounded to the nearest 1/8 percentage point) of an individual par- ticipant’s judgment of the midpoint of the appropriate target range for the federal funds rate or the appropriate target level for the federal funds rate at the end of the specified calendar year or over the longer run. One participant did not submit longer-run projections for the federal funds rate.
  • 4. For release at 2:00 p.m., EDT, September 21, 2016 Explanation of Economic Projections Charts The charts show actual values and projections for three economic variables, based on FOMC participants’ individual assessments of appropriate monetary policy: • Change in Real Gross Domestic Product (GDP)—as measured from the fourth quarter of the previous year to the fourth quarter of the year indicated, with values plotted at the end of each year. • Unemployment Rate—the average civilian unemployment rate in the fourth quarter of each year, with values plotted at the end of each year. • PCE Inflation—as measured by the change in the personal consumption expenditures (PCE) price index from the fourth quarter of the previous year to the fourth quarter of the year indicated, with values plotted at the end of each year. Information for these variables is shown for each year from 2011 to 2019, and for the longer run. The solid black line, labeled “Actual,” shows the historical values for each variable. The lightly shaded areas represent the ranges of the projections of policymakers. The bottom of the range for each variable is the lowest of all of the projections for that year or period. Likewise, the top of the range is the highest of all of the projections for that year or period. The dark shaded areas represent the central tendency, which is a narrower version of the range that excludes the three highest and three lowest projections for each variable in each year or period. The solid red line depicts the median projection in each period for each variable. The median value in each period is the middle projection when the projections are arranged from lowest to highest. When the number of projections is even, the median is the average of the two middle projections. The longer-run projections, which are shown on the far right side of the charts, are the rates of growth, unemployment, and inflation to which a policymaker expects the economy to converge over time—maybe in five or six years—in the absence of further shocks and under appropriate monetary policy. Because appropriate monetary policy, by definition, is aimed at achieving the Federal Reserve’s dual mandate of maximum employment and price stability in the longer run, policymakers’ longer-run projections for economic growth and unemployment may be interpreted, respectively, as estimates of the economy’s normal or trend rate of growth and its normal unemployment rate over the longer run. The longer-run projection shown for inflation is the rate of inflation judged to be most consistent with the Federal Reserve’s dual mandate.
  • 5. For release at 2:00 p.m., EDT, September 21, 2016 Explanation of Policy Path Chart This chart is based on policymakers’ assessments of appropriate monetary policy, which, by definition, is the future path of policy that each participant deems most likely to foster outcomes for economic activity and inflation that best satisfy his or her interpretation of the Federal Reserve’s dual objectives of maximum employment and stable prices. Each shaded circle indicates the value (rounded to the nearest ⅛ percentage point) of an individual participant’s judgment of the midpoint of the appropriate target range for the federal funds rate or the appropriate target level for the federal funds rate at the end of the specified calendar year or over the longer run.