SlideShare una empresa de Scribd logo
1 de 12
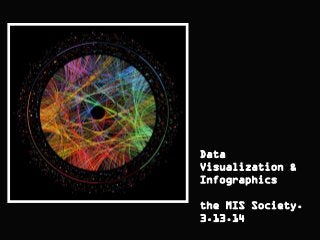
Data
Visualization &
Infographics
the MIS Society.
3.13.14
Data Visualization: What
is it?
Data visualization is the
graphical representation of
numerical data.
The right data tool can
present a complex data set in
a way that is simple to
understand.
Visual Analytics: What
is it?
Visual analytics is a form of inquiry
in which data that provides insight
into solving a problem
is displayed in an interactive,
graphical manner
Revealing patterns, trends and
correlations.
Why Visualize?
-test data management strategies
-helpful for understanding large
complex data sets
-process abstract business or
scientific data as images
Examples.
0
2
4
6
8
10
0 2 4 6 8 10 12
Pt. 1: Good data
visualization should
• Show the data
• Induce the viewer to think
about the substance rather than
about methodology, graphic
design, technology of graphic
production etc.
• Avoid distorting what the data
has to say
• Present many numbers in a small
space
Pt. 2: Good data
visualization should
• Make large data sets coherent
• Encourage the eye to compare
different pieces of data
• Reveal the data at several levels
of detail, from a broad overview
to the fine structure
• Serve a reasonably clear purpose:
description, exploration,
tabulation or decoration
• Be closely integrated with the
statistical and verbal
Infographics
• Best Infographics
• Parrot’s Emotion Classification
• Untranslatable Emotions in Languages other
than English

Más contenido relacionado

Destacado

10 Data Visualization Tools You Can Use Tomorrow!
10 Data Visualization Tools You Can Use Tomorrow!10 Data Visualization Tools You Can Use Tomorrow!
10 Data Visualization Tools You Can Use Tomorrow!Randy Krum
 
Introduction to Infographic Design
Introduction to Infographic DesignIntroduction to Infographic Design
Introduction to Infographic DesignAmanda Makulec
 
Broadcast news(1)
Broadcast news(1)Broadcast news(1)
Broadcast news(1)klstar1
 
Interactive Narratives: Creating the future of storytelling (SXSW 2011)
Interactive Narratives: Creating the future of storytelling (SXSW 2011)Interactive Narratives: Creating the future of storytelling (SXSW 2011)
Interactive Narratives: Creating the future of storytelling (SXSW 2011)Robert Pratten
 
Beyond bar charts best practices in data visualization
Beyond bar charts   best practices in data visualizationBeyond bar charts   best practices in data visualization
Beyond bar charts best practices in data visualizationBen Jones
 
Infographics introduction
Infographics introductionInfographics introduction
Infographics introductionkjcmetzger
 
5 Data Visualization Pitfalls
5 Data Visualization Pitfalls5 Data Visualization Pitfalls
5 Data Visualization PitfallsData IQ Argentina
 
Infographics & Data Visualisation
Infographics & Data VisualisationInfographics & Data Visualisation
Infographics & Data Visualisationtrisnadi
 
Psychology explains the power of Storytelling
Psychology explains the power of StorytellingPsychology explains the power of Storytelling
Psychology explains the power of StorytellingSebastien Juras
 
What is an Infographic?
What is an Infographic?What is an Infographic?
What is an Infographic?Bernard Marr
 
Storytelling & Knowledge Management
Storytelling & Knowledge ManagementStorytelling & Knowledge Management
Storytelling & Knowledge ManagementEric Brown
 
Visual Storytelling 101
Visual Storytelling 101Visual Storytelling 101
Visual Storytelling 101JESS3
 
Data stories - how to combine the power storytelling with effective data visu...
Data stories - how to combine the power storytelling with effective data visu...Data stories - how to combine the power storytelling with effective data visu...
Data stories - how to combine the power storytelling with effective data visu...Coincidencity
 
How to Tell a Story With Your Google Analytics Data
How to Tell a Story With Your Google Analytics DataHow to Tell a Story With Your Google Analytics Data
How to Tell a Story With Your Google Analytics DataJeff Sauer
 
Designing Around Storytelling - Breaking Borders, Reading 18 August 2015
Designing Around Storytelling - Breaking Borders, Reading 18 August 2015Designing Around Storytelling - Breaking Borders, Reading 18 August 2015
Designing Around Storytelling - Breaking Borders, Reading 18 August 2015Anna Dahlström
 

Destacado (17)

10 Data Visualization Tools You Can Use Tomorrow!
10 Data Visualization Tools You Can Use Tomorrow!10 Data Visualization Tools You Can Use Tomorrow!
10 Data Visualization Tools You Can Use Tomorrow!
 
Interviewing Tips
Interviewing TipsInterviewing Tips
Interviewing Tips
 
Introduction to Infographic Design
Introduction to Infographic DesignIntroduction to Infographic Design
Introduction to Infographic Design
 
Journalism Interviewing
Journalism InterviewingJournalism Interviewing
Journalism Interviewing
 
Broadcast news(1)
Broadcast news(1)Broadcast news(1)
Broadcast news(1)
 
Interactive Narratives: Creating the future of storytelling (SXSW 2011)
Interactive Narratives: Creating the future of storytelling (SXSW 2011)Interactive Narratives: Creating the future of storytelling (SXSW 2011)
Interactive Narratives: Creating the future of storytelling (SXSW 2011)
 
Beyond bar charts best practices in data visualization
Beyond bar charts   best practices in data visualizationBeyond bar charts   best practices in data visualization
Beyond bar charts best practices in data visualization
 
Infographics introduction
Infographics introductionInfographics introduction
Infographics introduction
 
5 Data Visualization Pitfalls
5 Data Visualization Pitfalls5 Data Visualization Pitfalls
5 Data Visualization Pitfalls
 
Infographics & Data Visualisation
Infographics & Data VisualisationInfographics & Data Visualisation
Infographics & Data Visualisation
 
Psychology explains the power of Storytelling
Psychology explains the power of StorytellingPsychology explains the power of Storytelling
Psychology explains the power of Storytelling
 
What is an Infographic?
What is an Infographic?What is an Infographic?
What is an Infographic?
 
Storytelling & Knowledge Management
Storytelling & Knowledge ManagementStorytelling & Knowledge Management
Storytelling & Knowledge Management
 
Visual Storytelling 101
Visual Storytelling 101Visual Storytelling 101
Visual Storytelling 101
 
Data stories - how to combine the power storytelling with effective data visu...
Data stories - how to combine the power storytelling with effective data visu...Data stories - how to combine the power storytelling with effective data visu...
Data stories - how to combine the power storytelling with effective data visu...
 
How to Tell a Story With Your Google Analytics Data
How to Tell a Story With Your Google Analytics DataHow to Tell a Story With Your Google Analytics Data
How to Tell a Story With Your Google Analytics Data
 
Designing Around Storytelling - Breaking Borders, Reading 18 August 2015
Designing Around Storytelling - Breaking Borders, Reading 18 August 2015Designing Around Storytelling - Breaking Borders, Reading 18 August 2015
Designing Around Storytelling - Breaking Borders, Reading 18 August 2015
 

Último

How to Troubleshoot Apps for the Modern Connected Worker
How to Troubleshoot Apps for the Modern Connected WorkerHow to Troubleshoot Apps for the Modern Connected Worker
How to Troubleshoot Apps for the Modern Connected WorkerThousandEyes
 
Mastering MySQL Database Architecture: Deep Dive into MySQL Shell and MySQL R...
Mastering MySQL Database Architecture: Deep Dive into MySQL Shell and MySQL R...Mastering MySQL Database Architecture: Deep Dive into MySQL Shell and MySQL R...
Mastering MySQL Database Architecture: Deep Dive into MySQL Shell and MySQL R...Miguel Araújo
 
Finology Group – Insurtech Innovation Award 2024
Finology Group – Insurtech Innovation Award 2024Finology Group – Insurtech Innovation Award 2024
Finology Group – Insurtech Innovation Award 2024The Digital Insurer
 
Bajaj Allianz Life Insurance Company - Insurer Innovation Award 2024
Bajaj Allianz Life Insurance Company - Insurer Innovation Award 2024Bajaj Allianz Life Insurance Company - Insurer Innovation Award 2024
Bajaj Allianz Life Insurance Company - Insurer Innovation Award 2024The Digital Insurer
 
A Year of the Servo Reboot: Where Are We Now?
A Year of the Servo Reboot: Where Are We Now?A Year of the Servo Reboot: Where Are We Now?
A Year of the Servo Reboot: Where Are We Now?Igalia
 
2024: Domino Containers - The Next Step. News from the Domino Container commu...
2024: Domino Containers - The Next Step. News from the Domino Container commu...2024: Domino Containers - The Next Step. News from the Domino Container commu...
2024: Domino Containers - The Next Step. News from the Domino Container commu...Martijn de Jong
 
Boost Fertility New Invention Ups Success Rates.pdf
Boost Fertility New Invention Ups Success Rates.pdfBoost Fertility New Invention Ups Success Rates.pdf
Boost Fertility New Invention Ups Success Rates.pdfsudhanshuwaghmare1
 
ProductAnonymous-April2024-WinProductDiscovery-MelissaKlemke
ProductAnonymous-April2024-WinProductDiscovery-MelissaKlemkeProductAnonymous-April2024-WinProductDiscovery-MelissaKlemke
ProductAnonymous-April2024-WinProductDiscovery-MelissaKlemkeProduct Anonymous
 
Advantages of Hiring UIUX Design Service Providers for Your Business
Advantages of Hiring UIUX Design Service Providers for Your BusinessAdvantages of Hiring UIUX Design Service Providers for Your Business
Advantages of Hiring UIUX Design Service Providers for Your BusinessPixlogix Infotech
 
Strategies for Landing an Oracle DBA Job as a Fresher
Strategies for Landing an Oracle DBA Job as a FresherStrategies for Landing an Oracle DBA Job as a Fresher
Strategies for Landing an Oracle DBA Job as a FresherRemote DBA Services
 
HTML Injection Attacks: Impact and Mitigation Strategies
HTML Injection Attacks: Impact and Mitigation StrategiesHTML Injection Attacks: Impact and Mitigation Strategies
HTML Injection Attacks: Impact and Mitigation StrategiesBoston Institute of Analytics
 
04-2024-HHUG-Sales-and-Marketing-Alignment.pptx
04-2024-HHUG-Sales-and-Marketing-Alignment.pptx04-2024-HHUG-Sales-and-Marketing-Alignment.pptx
04-2024-HHUG-Sales-and-Marketing-Alignment.pptxHampshireHUG
 
Apidays New York 2024 - Scaling API-first by Ian Reasor and Radu Cotescu, Adobe
Apidays New York 2024 - Scaling API-first by Ian Reasor and Radu Cotescu, AdobeApidays New York 2024 - Scaling API-first by Ian Reasor and Radu Cotescu, Adobe
Apidays New York 2024 - Scaling API-first by Ian Reasor and Radu Cotescu, Adobeapidays
 
Tata AIG General Insurance Company - Insurer Innovation Award 2024
Tata AIG General Insurance Company - Insurer Innovation Award 2024Tata AIG General Insurance Company - Insurer Innovation Award 2024
Tata AIG General Insurance Company - Insurer Innovation Award 2024The Digital Insurer
 
Exploring the Future Potential of AI-Enabled Smartphone Processors
Exploring the Future Potential of AI-Enabled Smartphone ProcessorsExploring the Future Potential of AI-Enabled Smartphone Processors
Exploring the Future Potential of AI-Enabled Smartphone Processorsdebabhi2
 
Boost PC performance: How more available memory can improve productivity
Boost PC performance: How more available memory can improve productivityBoost PC performance: How more available memory can improve productivity
Boost PC performance: How more available memory can improve productivityPrincipled Technologies
 
GenCyber Cyber Security Day Presentation
GenCyber Cyber Security Day PresentationGenCyber Cyber Security Day Presentation
GenCyber Cyber Security Day PresentationMichael W. Hawkins
 
Scaling API-first – The story of a global engineering organization
Scaling API-first – The story of a global engineering organizationScaling API-first – The story of a global engineering organization
Scaling API-first – The story of a global engineering organizationRadu Cotescu
 
From Event to Action: Accelerate Your Decision Making with Real-Time Automation
From Event to Action: Accelerate Your Decision Making with Real-Time AutomationFrom Event to Action: Accelerate Your Decision Making with Real-Time Automation
From Event to Action: Accelerate Your Decision Making with Real-Time AutomationSafe Software
 

Último (20)

How to Troubleshoot Apps for the Modern Connected Worker
How to Troubleshoot Apps for the Modern Connected WorkerHow to Troubleshoot Apps for the Modern Connected Worker
How to Troubleshoot Apps for the Modern Connected Worker
 
Mastering MySQL Database Architecture: Deep Dive into MySQL Shell and MySQL R...
Mastering MySQL Database Architecture: Deep Dive into MySQL Shell and MySQL R...Mastering MySQL Database Architecture: Deep Dive into MySQL Shell and MySQL R...
Mastering MySQL Database Architecture: Deep Dive into MySQL Shell and MySQL R...
 
Finology Group – Insurtech Innovation Award 2024
Finology Group – Insurtech Innovation Award 2024Finology Group – Insurtech Innovation Award 2024
Finology Group – Insurtech Innovation Award 2024
 
Bajaj Allianz Life Insurance Company - Insurer Innovation Award 2024
Bajaj Allianz Life Insurance Company - Insurer Innovation Award 2024Bajaj Allianz Life Insurance Company - Insurer Innovation Award 2024
Bajaj Allianz Life Insurance Company - Insurer Innovation Award 2024
 
A Year of the Servo Reboot: Where Are We Now?
A Year of the Servo Reboot: Where Are We Now?A Year of the Servo Reboot: Where Are We Now?
A Year of the Servo Reboot: Where Are We Now?
 
2024: Domino Containers - The Next Step. News from the Domino Container commu...
2024: Domino Containers - The Next Step. News from the Domino Container commu...2024: Domino Containers - The Next Step. News from the Domino Container commu...
2024: Domino Containers - The Next Step. News from the Domino Container commu...
 
Boost Fertility New Invention Ups Success Rates.pdf
Boost Fertility New Invention Ups Success Rates.pdfBoost Fertility New Invention Ups Success Rates.pdf
Boost Fertility New Invention Ups Success Rates.pdf
 
ProductAnonymous-April2024-WinProductDiscovery-MelissaKlemke
ProductAnonymous-April2024-WinProductDiscovery-MelissaKlemkeProductAnonymous-April2024-WinProductDiscovery-MelissaKlemke
ProductAnonymous-April2024-WinProductDiscovery-MelissaKlemke
 
Advantages of Hiring UIUX Design Service Providers for Your Business
Advantages of Hiring UIUX Design Service Providers for Your BusinessAdvantages of Hiring UIUX Design Service Providers for Your Business
Advantages of Hiring UIUX Design Service Providers for Your Business
 
Strategies for Landing an Oracle DBA Job as a Fresher
Strategies for Landing an Oracle DBA Job as a FresherStrategies for Landing an Oracle DBA Job as a Fresher
Strategies for Landing an Oracle DBA Job as a Fresher
 
HTML Injection Attacks: Impact and Mitigation Strategies
HTML Injection Attacks: Impact and Mitigation StrategiesHTML Injection Attacks: Impact and Mitigation Strategies
HTML Injection Attacks: Impact and Mitigation Strategies
 
+971581248768>> SAFE AND ORIGINAL ABORTION PILLS FOR SALE IN DUBAI AND ABUDHA...
+971581248768>> SAFE AND ORIGINAL ABORTION PILLS FOR SALE IN DUBAI AND ABUDHA...+971581248768>> SAFE AND ORIGINAL ABORTION PILLS FOR SALE IN DUBAI AND ABUDHA...
+971581248768>> SAFE AND ORIGINAL ABORTION PILLS FOR SALE IN DUBAI AND ABUDHA...
 
04-2024-HHUG-Sales-and-Marketing-Alignment.pptx
04-2024-HHUG-Sales-and-Marketing-Alignment.pptx04-2024-HHUG-Sales-and-Marketing-Alignment.pptx
04-2024-HHUG-Sales-and-Marketing-Alignment.pptx
 
Apidays New York 2024 - Scaling API-first by Ian Reasor and Radu Cotescu, Adobe
Apidays New York 2024 - Scaling API-first by Ian Reasor and Radu Cotescu, AdobeApidays New York 2024 - Scaling API-first by Ian Reasor and Radu Cotescu, Adobe
Apidays New York 2024 - Scaling API-first by Ian Reasor and Radu Cotescu, Adobe
 
Tata AIG General Insurance Company - Insurer Innovation Award 2024
Tata AIG General Insurance Company - Insurer Innovation Award 2024Tata AIG General Insurance Company - Insurer Innovation Award 2024
Tata AIG General Insurance Company - Insurer Innovation Award 2024
 
Exploring the Future Potential of AI-Enabled Smartphone Processors
Exploring the Future Potential of AI-Enabled Smartphone ProcessorsExploring the Future Potential of AI-Enabled Smartphone Processors
Exploring the Future Potential of AI-Enabled Smartphone Processors
 
Boost PC performance: How more available memory can improve productivity
Boost PC performance: How more available memory can improve productivityBoost PC performance: How more available memory can improve productivity
Boost PC performance: How more available memory can improve productivity
 
GenCyber Cyber Security Day Presentation
GenCyber Cyber Security Day PresentationGenCyber Cyber Security Day Presentation
GenCyber Cyber Security Day Presentation
 
Scaling API-first – The story of a global engineering organization
Scaling API-first – The story of a global engineering organizationScaling API-first – The story of a global engineering organization
Scaling API-first – The story of a global engineering organization
 
From Event to Action: Accelerate Your Decision Making with Real-Time Automation
From Event to Action: Accelerate Your Decision Making with Real-Time AutomationFrom Event to Action: Accelerate Your Decision Making with Real-Time Automation
From Event to Action: Accelerate Your Decision Making with Real-Time Automation
 

Data Visualization and Infographics

  • 2. Data Visualization: What is it? Data visualization is the graphical representation of numerical data. The right data tool can present a complex data set in a way that is simple to understand.
  • 3. Visual Analytics: What is it? Visual analytics is a form of inquiry in which data that provides insight into solving a problem is displayed in an interactive, graphical manner Revealing patterns, trends and correlations.
  • 4. Why Visualize? -test data management strategies -helpful for understanding large complex data sets -process abstract business or scientific data as images Examples.
  • 5. 0 2 4 6 8 10 0 2 4 6 8 10 12
  • 6. Pt. 1: Good data visualization should • Show the data • Induce the viewer to think about the substance rather than about methodology, graphic design, technology of graphic production etc. • Avoid distorting what the data has to say • Present many numbers in a small space
  • 7. Pt. 2: Good data visualization should • Make large data sets coherent • Encourage the eye to compare different pieces of data • Reveal the data at several levels of detail, from a broad overview to the fine structure • Serve a reasonably clear purpose: description, exploration, tabulation or decoration • Be closely integrated with the statistical and verbal
  • 8.
  • 9.
  • 10.
  • 11.
  • 12. Infographics • Best Infographics • Parrot’s Emotion Classification • Untranslatable Emotions in Languages other than English