Making an Orienteering Map in Seven Basic Steps
•Descargar como PPTX, PDF•
1 recomendación•1,586 vistas

Orienteering is a simple sport. The participant uses a map and compass to get to a series of checkpoints called controls. How he/she gets from one point to the next is entirely up to the participant. Deciding the best route depends a lot on having accurate information on the orienteering map. Are the trails accurately mapped? Are the woods accurately described? Will there be any steep cliffs, deep waterways or other obstacles in the way? All that has to be shown on the map. For many the making of the orienteering map is as much fun as the orienteering itself. Here is a quick look at how the mapping is done using a combination of modern computer technology and good old fashioned leg work.

Recomendados
Más contenido relacionado
La actualidad más candente
La actualidad más candente (20)
Similar a Making an Orienteering Map in Seven Basic Steps
Similar a Making an Orienteering Map in Seven Basic Steps (20)
Más de Gord Hunter
Más de Gord Hunter (17)
Último
Último (20)
Making an Orienteering Map in Seven Basic Steps
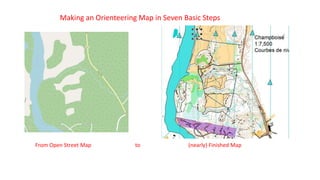
- 1. Making an Orienteering Map in Seven Basic Steps From Open Street Map to (nearly) Finished Map
- 2. 1) My Map Project Area in Open Street Map There is less to start with here than usual. However the road and river will give a valuable starting framework. Unseen in the file is important geo- referencing information that will come in handy with later information imports.
- 3. The area information imported into OCAD 2020 The area information imported into Open Orienteering Mapper The OOM preliminary information converted to orienteering symbols I find both mapping programs are very good. Some prefer OOM because it is free to use. I prefer OCAD because I am making a lot of maps and it automates some functions that end up saving me a lot of time. 2a) 2b)Or
- 4. Contour Detail Added In this case the LiDAR contour detail came from the government of the Province of Quebec, Canada. (Thanks to Vladimir Gavrilov of Montreal for his help.) The geo- referencing of the original map made positioning of the contour information automatic and quick. For similar maps in the United States my go- to source for LiDAR contour information is a site called the USGS National Map Viewer. 3)
- 5. In many settings valuable and time-saving information can be found from aerial images such as Google Earth. OCAD 2020 gives the mapper the ability to import the images geo-referenced directly into the maps background. Otherwise the mapper can manipulate the image into place. Either way it is a great time saver as well as improving the map product. A typical aerial image The image imported into the map background and detail – in this case clearings – traced onto the map 4) Using Satellite / Aerial Images The geo-reference information in the files of both the map and aerial image allow my OCAD program to align the two perfectly with one touch of the button.
- 6. An additional preliminary time saving step is to check an online service such as Strava Heat Map. The Strava map will show us where hikers, joggers, cyclists, equestrians etc. have gone in the area and recorded their route. Usually the darker the shown route the more heavily travelled is the path. 5) Strava Global Heat Map A clip from the Strava Global Heat Map The Heat Map in our map background The Strava map will not replace the need to check those trails for accuracy. However it does show the field checker where the trails are likely to be.
- 7. With information from background images and Strava this is about as far as one can get the map. Next comes checking the area for additional important details. This is called field work.
- 8. Field Work To make the map useful for orienteering the mapper must take the base map out to the area and compare it to the terrain. Details visible to a person on foot and important to the orienteer are added/ corrected or sometimes deleted when they are found to be gone. Many field workers today take a mapping tablet with them and do the field corrections directly onto the computer. I’m a bit ‘old-school’. I use a map board and mylar sheet over the map with coloured pencils for drawing. GPS tracks (shown here in purple) back up my work. 6)
- 9. Voila! A few pleasant days in the forest or park and the mapper finds the area actually looks like this. Just add some important ‘layout details’ and a course then the map is ready for orienteering. 7)