
Recomendados
Recomendados
Más contenido relacionado
Último
Último (20)
Destacado
Destacado (20)
Visually Analyzing People with Graphs
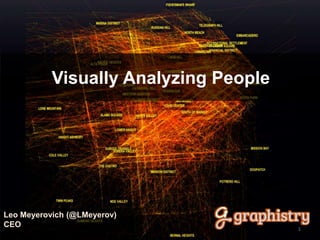
- 1. Visually Analyzing People Leo Meyerovich (@LMeyerov) CEO 1
- 2. is: Supercharging visual analytics through GPU cloud streaming. (We tricky graphs.)
- 4. CASE STUDY: TWITTER FRAUD Naïve layout on 1K+ node graphs give impenetrable hairballs. Gauss-Seidel Force-Directed Graph, O(N^2) n-body, GPU Node: Twitter account Edge: Friendship Friends and friend-of-friends of a bot who randomly messaged real people and retweeted them.
- 5. Even on a small graph (77 nodes), smart design starts adding clarity
- 6. With smart layouts, fake account clusters pop out ForceAtlas2 Layout, O(n log n) n-body, GPU The spambot is an entrypoint to more bots… Obviously fake account names
- 7. A quiet small business who buys virtual game currency from gamers…
- 8. Who somehow got exactly 1 message massively trended & advertised by Twitter
- 9. spammer laundering accounts bot retweet network It’s a “retweet laundering” botnet! Tricks Twitter into targeting gamers to check out a cyberfraud site. They steal gamers’ money and identities.
- 10. Relationships hard to see without graphs with smart layouts & interactions. Next step: explore the time dimension Ex: how do mobs launch from Twitter?
- 11. Leo A. Meyerovich, @lmeyerov, Graphistry THE SOCIOLOGY OF PROGRAMMING LANGUAGES 11
- 14. Fastest? C > Java> JavaScript > Pascal Safest? Java > Pascal > JavaScript > C Goal: Rank Beliefs Programmers won’t agree on ranking..
- 16. Let’s run a competition for the friendliest language! (Glicko2) Each survey response is a game match: 1. Person A says Python beats C in friendliness 2. Person A says Java beats C in friendliness 3. Person B says C beats APL in friendliness …
- 17. Score Points set by a Bookie Every language starts with rank 1000 1. “Person A: Python friendlier than C” Python’s rank goes up 2. “Person B: Python friendlier than C” Python already > C, less valuable win 3. “Person C: Haskell friendlier than Python” Problem: little known about Haskell (“sparse”) Haskell beat a high-rank language: big level increase! (Bayesian!)
- 18. Many Tournaments = Correlation Matrix! Language x Belief
- 20. Reduce Dimensionality: Pick fun languages & cluster centers
- 22. Correlation Matrices are Fuzzy Graphs 0.5 0.5 0.5 0.5 0.5 0.5 0.5 0.5 0.5 0.5 0.5 0.5 0.5 0.5 0.5 0.5 0.5 0.5
- 23. Weak Edges Are Annoying!
- 24. Filter: Only Show Strong Relationships
- 25. Relationships hard to see without graphs with smart layouts & interactions. Step 2 of analysis is correlate (step 1 is count). Correlations are relationships, so explore them as graphs!
- 27. 0% 20% 40% 60% Popularity Project categories (223) Java 0% 1% 2% 3% 4% Project categories (223) Scheme Popularity Across Niches 27 bloggin g searc h build tools
- 28. Prolog VBScript Scheme Fortran PL/SQL Assembly C# Java 0.0001 0.001 0.01 0.1 1 0 1 2 3 4 5 Popularity Dispersion across niches (σ / μ) Popularity vs. Niche: Dispersion 28
- 29. 0.0100% 0.1000% 1.0000% 10.0000% 100.0000% 1 10 100 Proportion of Projects for Language Language Rank (Decreasing ) Language Use (survey) 29 Java: winner takes all Long Tail Design for niches and grow
- 30. Survey of 1,679 Developers Extrinsic factors dominate! (on last project) 30
- 31. FUTURE STEP: Now that we’ve counted things, let’s correlate them! Topics in Free-form ResponsesAnswer Correlations
- 32. Relationships hard to see without graphs with smart layouts & interactions. Step 2 of analysis is correlate (step 1 is count). Correlations are relationships, so explore them as graphs! Powerful because correlations everywhere: raw features, inferred topics, …
- 33. We’re Hiring Designers! (and contact if you have interesting graphs) 33 info@graphistry.com Twitter: @LMeyerov