1. 9/24/2008 10:48 PM Pacific
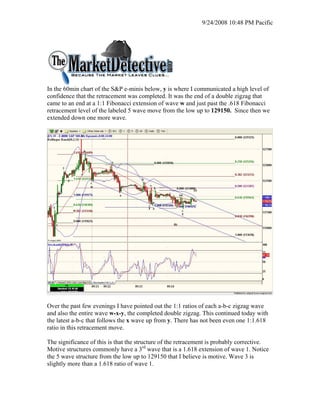
In the 60min chart of the S&P e-minis below, y is where I communicated a high level of
confidence that the retracement was completed. It was the end of a double zigzag that
came to an end at a 1:1 Fibonacci extension of wave w and just past the .618 Fibonacci
retracement level of the labeled 5 wave move from the low up to 129150. Since then we
extended down one more wave.
Over the past few evenings I have pointed out the 1:1 ratios of each a-b-c zigzag wave
and also the entire wave w-x-y, the completed double zigzag. This continued today with
the latest a-b-c that follows the x wave up from y. There has not been even one 1:1.618
ratio in this retracement move.
The significance of this is that the structure of the retracement is probably corrective.
Motive structures commonly have a 3rd wave that is a 1.618 extension of wave 1. Notice
the 5 wave structure from the low up to 129150 that I believe is motive. Wave 3 is
slightly more than a 1.618 ratio of wave 1.
2. 9/24/2008 10:48 PM Pacific
The extended move down from y so far is a single a-b-c zigzag. I went ahead and labeled
it z. Z waves are uncommon, however, single zigzags are the most common z wave
extensions following a double zigzag.
There can only be 3 extensions in a correction (w-y-z). the x’s are connectors. It is an
Elliott rule that has never been broken. If my wave count is correct, then we are finished
going down. Did I say that last night? If I did, then on a closing basis, we didn’t.
Some other bullish indicators on the chart above: We did not return to the bottom of
the channel before turning back up. There is a negative divergence in the Stochastic, and
we are hugging the top of the channel instead of spiking down from it.
Also, the RSI bounce off the oversold indicator in the NAZ I showed last night is still
valid.
Another Elliott rule is that 5 waves are never alone (except C waves of Flats). So, to be
clear, I believe that the 5 wave structure up from the low is motive and should be
followed by another motive wave that should travel higher than the first.
I believe that the retracement from the high is a corrective structure, there are only 3
extensions allowed, and z was/is the last extension. Z could extend, but the most common
pattern of a third extension (z wave) is a single zigzag. Other indicators support that a
turn is imminent.
TMD/DW
The market detective provides personal market opinion based on sound technical
analysis and research. However, no warranty is given or implied as to its true reliability.
The market detective will make errors and mistakes. The market detective is not
an investment adviser and is not making recommendations to buy, sell, or place orders
relating to the futures contracts, ETFs, or stocks that he writes about. The responsibility
for decisions made from information contained in this service are solely that of the
individual subscriber. The individual must fully research and make his/her own
decisions before acting on any information provided by the market detective. The
market detective assumes no responsibility for subscriber investment or trading results.