SlideShare una empresa de Scribd logo
1 de 69
***Do Not Edit This Page Unless it is a Colored Cell
RUN REVENUE SCENARIO (ENTER 1-3)                 2      ***This cell affects multiple sheets
                            ****LEAVE THIS CELL ON 2 WHEN PRINTING

Revenue Assumptions

                                                                  Division A- Biopolymer
                                                                                   Scenario
                                       Revenue Growth               1                 2                   3
                                            2009                    -                -                     -
                                            2010                    -                -                     -
                                            2011                  2.0%             20.0%                15.0%
                                            2012                  2.0%             18.0%                17.0%

                                             2013                 2.0%             15.0%                18.0%
                                             2014                 2.0%             10.0%                15.0%

                                             2015                 2.0%              8.0%                12.0%
                                             2016                 2.0%              6.0%                10.0%
                                             2017                 2.0%              4.0%                 7.5%
                                             2018                 2.0%              3.0%                 3.0%

                                                                                   Scenario
                                          Revenues                  1                 2                   3
                                           2009                            $0               $0                   $0
                                           2010                   $18,000,000      $25,000,000          $36,000,000
                                           2011                   $18,360,000      $30,000,000          $41,400,000
                                           2012                   $18,727,200      $35,400,000          $48,438,000
                                           2013                   $19,101,744      $40,710,000          $57,156,840
                                           2014                   $19,483,779      $44,781,000          $65,730,366
                                           2015                   $19,873,454      $48,363,480          $73,618,010
                                           2016                   $20,270,924      $51,265,289          $80,979,811
                                           2017                   $20,676,342      $53,315,900          $87,053,297
                                           2018                   $21,089,869      $54,915,377          $89,664,896

                                           Additional Sources of Revenue Scenario 1
                               International Licensing Revenue:                               Grants:
                       Burns           Chronic Wounds      Reconstruction         AFFIRM      Dept. of Defense
       2009                                                                          $500,000
       2010                                                                        $1,000,000       $5,000,000
       2011           $125,222,002
       2012             $1,565,275         $292,184,671
       2013             $3,130,550           $3,652,308           $30,406,107
       2014             $4,695,825           $7,304,617              $380,076
       2015             $6,261,100          $10,956,925              $760,153
       2016             $7,826,375          $14,609,234            $1,140,229
       2017             $7,904,639          $18,261,542            $1,520,305
       2018             $7,983,685          $18,444,157            $1,900,382


                                          Additional Sources of Revenue Scenario 3
                             International Licensing Revenue:                          Grants:
                       Burns          Chronic Wounds      Reconstruction     AFFIRM        Dept. of Defense
       2009                                                                      $500,000
       2010           $250,000,000                                             $1,000,000        $5,000,000
       2011            $25,000,000         $250,000,000                        $7,500,000        $5,000,000
2012                   $25,000,000         $25,000,000     $250,000,000         $5,000,000         $5,000,000
         2013                   $25,000,000         $25,000,000      $25,000,000         $5,000,000         $5,000,000
         2014                   $25,000,000         $25,000,000      $25,000,000
         2015                   $25,000,000         $25,000,000      $25,000,000
         2016                   $25,000,000         $25,000,000      $25,000,000
         2017                   $25,000,000         $25,000,000      $25,000,000
         2018                   $25,000,000         $25,000,000      $25,000,000


                                                                                                                                      M

                                                                      2009               2010               2011
Manufacturing (% of Revenues)                                                  50%                50%                50%
Lonza Sales Fee (% of Revenues)                                                15%                15%                15%
Total Production Cost (% of Revenues)                                          65%                65%                65%
Lonzas Share of Profit                                                         50%                50%                50%
McCoy's Profit (% of Revenues)                                               17.5%              17.5%              17.5%


                                               In HUD Phase
                                                    2009              2010               2011
Manufacturing (% of Revenues)                                 85%              85%               85% Price Paid (per cm³)
Administrative (% of Revenues)                                15%              15%               15% Selling Price (per cm³)
McCoy's Profit (% of Revenues)                                 0%               0%                0% Manufacturing (% of Revenues)
                                                                                                     McCoy's Profit (% of Revenues)


                                                                                                                             Expense A
                                                                      2009               2010               2011
Operating Expenses
Manufacturing Expenses- Division A                                     $0             $12,500,000        $15,000,000
Manufacturing Expenses- Division B                                     $0             $23,375,000        $46,750,000
Total Manufacturing Expense                                            $0             $35,875,000        $61,750,000
Employee Expense
 HDE Application Clinical                                                   $30,000               $0                 $0
 HDE Application Technical                                                  $30,000               $0                 $0
 PMA Application Clinical                                                        $0         $100,000           $100,000
 PMA Application Technical                                                       $0         $100,000           $100,000
Total Employee Expense                                                      $60,000         $200,000           $200,000
Laboratory: Trial Tech Transfer Verification
 Media Prep 1                                                           $200,000            $400,000           $600,000
 Media Release 1                                                        $100,000            $200,000           $300,000
 Lonza Skin Culture 1                                                    $60,000            $120,000           $180,000
 Cincinnati Skin Culture 1                                               $60,000             $60,000            $60,000
 Lonza Mouse Graft Study 1                                               $50,000            $100,000           $150,000
Total Lab Expenses                                                      $470,000            $880,000         $1,290,000
Cost of Goods Sold                                                      $530,000         $36,955,000        $63,240,000

Sales, General & Administrative
 Lonza's "Sales and Marketing" Payments                                $0             $8,125,000         $9,750,000
 CEO/Regulatory                                                          $100,000           $200,000           $200,000
 COO/Corporate Liason                                                    $100,000           $200,000           $200,000
 Senior Research Scientist Boyce                                         $100,000           $100,000           $100,000
Adult Clinical Program Manager                                           $50,000        $100,000         $225,000
 National Securities 7%                                                  $525,000        $525,000               $0
 Accounting Expenses
 Corporate Counsel                                                       $120,000         $200,000        $200,000
Total Personnel Expense                                                  $995,000       $9,450,000     $10,675,000
 Patents                                                                  $24,000          $24,000        $175,000
 Office Supplies                                                           $1,200           $2,400           $4,800
 Telephone, Internet Service                                               $5,400          $10,800          $21,600
 General Liability (Fire theft)                                            $1,500           $3,000           $6,000
 Product Liability                                                        $12,000          $24,000          $48,000
 Key Man Insurance 3 Employees                                             $5,400          $10,800          $21,600
 Director & Officer Insurance                                             $16,000          $32,000          $64,000
 Employee Health Insurance                                                $36,000          $72,000        $144,000
 Marketing/Tradeshow/Conference                                           $50,000         $100,000        $200,000
 Employment Benefits                                                     $100,000         $200,000        $400,000
 Travel                                                                   $72,000         $144,000        $288,000
Increase in Patents & Legal due to Licensing Agreements                         0         $25,000          $50,000
Increase in Travel due to Licensing Agreements                                  0         $25,000          $50,000
Additional Administrative Expense Related to HUD                       $0               $0              $0
Total Other Expenses                                                     $323,500         $673,000      $1,473,000
Total SG&A Expenses                                                    $1,318,500      $10,123,000     $12,148,000

R&D as % Gross Profit                                       10.0%
R&D Expenses                                                                    $0              $0              $0


                                                     2009             2010            2011            2012
                                                     35%               35%             35%             35%


                                                                                                                            Am
Years to Amortize Intangibles                         15


                           Total Intangible
                               Assets                                  2009            2010            2011
         2009                $4,000,000                              $266,667        $266,667        $266,667
         2010                $4,000,000                                              $266,667        $266,667
         2011                     $-                                                                    $0
         2012                     $-
         2013                     $-
         2014                     $-
         2015                     $-
         2016                     $-
         2017                     $-
         2018                     $-

                                              Total Amortization     $266,667        $533,333        $533,333


                                                                                                                      Straight L
Years to Depreciat Office Equipment                    5
Years to Depreciate CAPEX                             15

                          Office Equipment
                              Purchase        Capital Expenditures                     2009            2010
         2009                  $30,000                                                $6,000          $6,000
         2010                  $30,000                                                                $6,000
2011                $30,000               $-
          2012                $30,000               $-
          2013                $30,000               $-
          2014                  $-                  $-
          2015                  $-                  $-
          2016                  $-                  $-
          2017                  $-                  $-
          2018                  $-                  $-

                                                          Total Depreciation   $6,000         $12,000


                                                                                                              CASH FLOW
                                                                2009            2010           2011
Equity Issuance in Year 1                                       $7,500,000              $0              $0

Intangible Assets
Licensing payment Lonza Marketing & Distribution                 $2,000,000              $0              $0
Cutanogen Final Payment Lonza                                            $0      $2,000,000              $0
 Milestone Payment Boyce HDE app                                 $1,000,000              $0             $0
 Milestone Payment University Cincinati HDE APP                  $1,000,000              $0             $0
 Milestone Payment Boyce PMA application                                 $0      $1,000,000             $0
 Milestone Payment University Cinncinati PMA APP                         $0      $1,000,000             $0
Total Intangible Asset Purchased                                 $4,000,000      $4,000,000             $0
Amortization                                                       $266,667        $533,333       $533,333
Net Intangible Value                                             $3,733,333      $7,200,000     $6,666,667


Capital Expenditures
Capital Expenditures                                                     $0             $0              $0
Asset Purchases Office Equipment                                    $30,000        $30,000         $30,000
Total Capital Expenditures                                          $30,000        $30,000         $30,000
Net Asset Value                                                     $24,000        $42,000         $54,000


                                                                                                               Balance She
                                                                2009           2010            2011
Assets
Accounts Receivable (% Revenues)                                        15%             15%             15%
Restricted Cash                                                          $0              $0              $0
Other Current Assets                                                     $0              $0              $0
Other Current Asssets                                                    $0              $0              $0
Existing Goodwill and Intangibles                                        $0              $0              $0
Transaction Goodwill                                                     $0              $0              $0
Other Long-Term Assets                                                   $0              $0              $0

Liabilities
Accounts Payable (% Revenues)                                           10%             10%             10%
Other Current Liabilities                                                $0              $0              $0
Existing Long-Term Debt                                                  $0              $0              $0
Exisiting Other Debt Affirm Grant Payment                          $500,000                              $0
Other Long-Term Liabilities                                              $0              $0              $0


Minority Interest                                                         $0             $0              $0
% of Dividend to be Paid out of CF After Operations and         80%
Investing Activities Post 2009
% of Dividend to be Paid out of CF After Operations and            80%
Investing Activities Post 2009


                                                                                                   If debt is incurred, make sure to accou


                                                                                                             Valuation Assumpt

Cost of Equity- CAPM                               2009            2010            2011                   2012
Risk Free Rate (20-Year Treasury)                         4.47%           4.47%           4.47%                  4.47%
Beta                                                         1.0             1.0             1.0                    1.0
Risk Premium                                                25%             25%             20%                    20%
Cost of Equity- CAPM                                      29.5%           29.5%           24.5%                  24.5%

Cost of Debt
Milestone Payments Interest                                 0%              0%              0%                     0%
Working Capital
Working Capital as % of Revenues                            2%

Terminal Value Calculation
Terminal Growth Rate                                       3.0%
Discount Rate                                             10.0%


                                                              1               2               3                      4
                                                              2
                                                              3
                                                              4
                                                              5
                                                              6
                                                              7
                                                              8
                                                              9
                                                             10
                                                             11
Division B- HUD/PMA
                                                                             Scenario
                          Revenue Growth                1
                               2009                     -
                               2010                     -
                               2011                     -
                               2012                     -

                              2013                      -
                              2014                      -

                              2015                    0.0%
                              2016                    0.0%
                              2017                    0.0%
                              2018                    0.0%

                                                                              Scenario
                             Revenues                   1
                              2009                                 $0
                              2010                                 $0
                              2011                                 $0
                              2012                                 $0
                              2013                                 $0
                              2014                                 $0
                              2015                                 $0
                              2016                                 $0
                              2017                                 $0
                              2018                                 $0

                                                        Additional Sources of Revenue Scenario 2
                                           International Licensing Revenue:
Total Additional
   Revenue                    Burns             Chronic Wounds
        $500,000   2009
      $6,000,000   2010
   $125,222,002    2011       $125,222,002
   $293,749,946    2012         $1,565,275             $292,184,671
    $37,188,966    2013         $3,130,550               $3,652,308
    $12,380,518    2014         $4,695,825               $7,304,617
    $17,978,178    2015         $6,261,100              $10,956,925
    $23,575,838    2016         $7,826,375              $14,609,234
    $27,686,486    2017         $7,904,639              $18,261,542
    $28,328,224    2018         $7,983,685              $18,444,157


Total Additional                                               Total Revenues
   Revenue                   Scenario                   1
       $500,000                2009                        $500,000
   $256,000,000                2010                     $24,000,000
   $287,500,000                2011                    $143,582,002
$310,000,000                                                2012                 $312,477,146
                     $85,000,000                                                2013                  $56,290,710
                     $75,000,000                                                2014                  $31,864,297
                     $75,000,000                                                2015                  $37,851,632
                     $75,000,000                                                2016                  $43,846,761
                     $75,000,000                                                2017                  $48,362,828
                     $75,000,000                                                2018                  $49,418,093


                                 Margin Assumptions
                                     Division A
                      2012               2013               2014                2015                2016
                               50%                50%                50%                  50%                     50%
                               15%                15%                15%                  15%                     15%
                               65%                65%                65%                  65%                     65%
                               50%                50%                50%                  50%                     50%
                             17.5%              17.5%              17.5%                17.5%                   17.5%


                                      Division B
                                                                                  In PMA Phase
                                         2012               2013                2014                2015
 e Paid (per cm³)                               $25.00             $25.00             $20.00                $20.00
 ing Price (per cm³)                            $55.00             $55.00             $55.00                $55.00
 ufacturing (% of Revenues)                       45%                45%                36%                   36%
Coy's Profit (% of Revenues)                      55%                55%                64%                   64%


                     Expense Assumptions
                      2012               2013               2014                2015                2016

                   $17,700,000         $20,355,000        $22,390,500        $24,181,740          $25,632,644
                   $70,125,000         $93,500,000       $116,875,000        $119,796,875        $122,791,797
                   $87,825,000        $113,855,000       $139,265,500        $143,978,615        $148,424,441

                               $0                  $0                   $0                  $0                    $0
                               $0                  $0                   $0                  $0                    $0
                         $100,000            $100,000                   $0                  $0                    $0
                         $100,000            $100,000                   $0                  $0                    $0
                         $200,000            $200,000                   $0                  $0                    $0

                         $400,000            $200,000                 $0                   $0                    $0
                         $200,000            $100,000                 $0                   $0                    $0
                         $120,000             $60,000                 $0                   $0                    $0
                               $0                  $0                 $0                   $0                    $0
                         $100,000             $50,000                 $0                   $0                    $0
                         $820,000            $410,000                 $0                   $0                    $0
                      $88,845,000        $114,465,000       $139,265,500         $143,978,615          $148,424,441


                   $11,505,000        $13,230,750        $14,553,825         $15,718,131         $16,661,219
                         $200,000          $1,000,000          $1,000,000           $1,000,000           $1,000,000
                         $200,000          $1,000,000          $1,000,000           $1,000,000           $1,000,000
                         $100,000            $100,000            $100,000             $100,000             $100,000
$375,000              $375,000         $375,000            $375,000              $375,000
          $0                    $0               $0                  $0                    $0

     $200,000              $200,000        $200,000           $200,000              $200,000
  $12,580,000           $15,905,750     $17,228,825       $18,393,131            $19,336,219
     $200,000              $200,000        $200,000           $200,000              $100,000
       $9,600               $19,200         $19,200            $19,200               $19,200
      $43,200               $86,400         $86,400            $86,400               $86,400
      $12,000               $24,000         $24,000            $24,000               $24,000
      $96,000              $192,000        $192,000           $192,000              $192,000
      $43,200               $86,400         $86,400            $86,400               $86,400
     $128,000              $256,000        $256,000           $256,000              $256,000
     $288,000              $576,000        $576,000           $576,000              $576,000
     $400,000              $800,000        $800,000           $800,000              $800,000
     $800,000            $1,600,000      $1,600,000         $1,600,000            $1,600,000
     $576,000            $1,152,000      $1,152,000         $1,152,000            $1,152,000
     $50,000               $50,000         $50,000            $50,000               $50,000
     $50,000               $50,000         $50,000            $50,000               $50,000
   $0                   $0              $0               $0                 $0
   $2,696,000            $5,092,000      $5,092,000         $5,092,000            $4,992,000
  $15,276,000           $20,997,750     $22,320,825       $23,485,131            $24,328,219


  $32,280,495            $7,343,397       $5,539,602        $6,330,054            $7,087,762

                Tax Rate Assumption
 2013                  2014            2015             2016               2017
  35%                  35%              35%              35%                35%


           Amortizaiton Schedule


  2012                 2013             2014            2015               2016
$266,667             $266,667         $266,667         $266,667           $266,667
$266,667             $266,667         $266,667         $266,667           $266,667
   $0                   $0               $0               $0                 $0
   $0                   $0               $0               $0                 $0
                        $0               $0               $0                 $0
                                         $0               $0                 $0
                                                          $0                 $0
                                                                             $0


$533,333             $533,333         $533,333         $533,333           $533,333


 Straight Line Depreciation Schedule


  2011                 2012             2013             2014              2015
 $6,000               $6,000           $6,000             $0                $0
 $6,000               $6,000           $6,000           $6,000              $0
$6,000         $6,000            $6,000            $6,000              $6,000
                  $6,000            $6,000            $6,000              $6,000
                                    $6,000            $6,000              $6,000
                                                        $0                  $0
                                                                            $0


  $18,000         $24,000           $30,000           $24,000             $18,000


CASH FLOW ASSUMPTIONS
    2012           2013              2014              2015                2016
            $0                $0                $0                  $0                   $0


             $0               $0                $0                  $0                   $0
             $0               $0                $0                  $0                   $0
             $0              $0                $0                 $0                      $0
             $0              $0                $0                 $0                      $0
             $0              $0                $0                 $0                      $0
             $0              $0                $0                 $0                      $0
             $0              $0                $0                 $0                      $0
       $533,333        $533,333          $533,333           $533,333                $533,333
     $6,133,333      $5,600,000        $5,066,667         $4,533,333              $4,000,000


            $0                 $0               $0                  $0                   $0
       $30,000            $30,000               $0                  $0                   $0
       $30,000            $30,000               $0                  $0                   $0
       $60,000            $60,000           $36,000             $18,000              $6,000


 Balance Sheet Assumption
   2012            2013              2014              2015                2016

            15%              15%               15%                 15%                  15%
             $0               $0                $0                  $0                   $0
             $0               $0                $0                  $0                   $0
             $0               $0                $0                  $0                   $0
             $0               $0                $0                  $0                   $0
             $0               $0                $0                  $0                   $0
             $0               $0                $0                  $0                   $0


            10%              10%               10%                 10%                  10%
             $0               $0                $0                  $0                   $0
             $0               $0                $0                  $0                   $0
             $0               $0                $0                  $0                   $0
             $0               $0                $0                  $0                   $0


             $0               $0                $0                  $0                   $0
ebt is incurred, make sure to account for interest


       Valuation Assumptions

                        2013                  2014            2015            2016            2017
                               4.47%                 4.47%           4.47%           4.47%           4.47%
                                  1.0                   1.0             1.0             1.0             1.0
                                 20%                   15%             15%             10%             10%
                               24.5%                 19.5%           19.5%           14.5%           14.5%


                                  0%                   0%              0%              0%              0%


                                    5                    6               7               8               9
Division B- HUD/PMA
                    Scenario
                             2                    3
                             -                    -
                             -                    -
                             -                    -
                             -                    -

                             -                    -
                             -                    -

                           2.5%                 5.0%
                           2.5%                 5.0%
                           2.5%                 5.0%
                           2.5%                 5.0%

                        Scenario
                            2                     3
                                       $0                 $0
                              $27,500,000        $90,000,000
                              $55,000,000       $125,000,000
                              $82,500,000       $200,000,000
                             $110,000,000       $600,000,000
                             $137,500,000       $750,000,000
                             $140,937,500       $787,500,000
                             $144,460,938       $826,875,000
                             $148,072,461       $868,218,750
                             $151,774,272       $911,629,688

  Additional Sources of Revenue Scenario 2
l Licensing Revenue:                                   Grants:
                                                                                Total Additional
                       Reconstruction          AFFIRM        Dept. of Defense      Revenue
                                                    $500,000                            $500,000
                                                  $1,000,000     $5,000,000           $6,000,000
                                                  $7,500,000     $5,000,000        $137,722,002
                                                                                   $293,749,946
                                 $30,406,107                                        $37,188,966
                                   $380,076                                         $12,380,518
                                   $760,153                                         $17,978,178
                                  $1,140,229                                        $23,575,838
                                  $1,520,305                                        $27,686,486
                                  $1,900,382                                        $28,328,224


       Total Revenues
                             2                    3
                                $500,000            $500,000
                              $58,500,000       $382,000,000
                             $222,722,002       $453,900,000
$411,649,946          $558,438,000
     $187,898,966          $742,156,840
     $194,661,518          $890,730,366
     $207,279,158          $936,118,010
     $219,302,064          $982,854,811
     $229,074,847        $1,030,272,047
     $235,017,874        $1,076,294,583


   2017                    2018
                 50%                50%
                 15%                15%
                 65%                65%
                 50%                50%
               17.5%              17.5%


   2016                    2017             2018
               $20.00             $20.00       $20.00
               $55.00             $55.00       $55.00
                 36%                36%          36%
                 64%                64%          64%


   2017                    2018

 $26,657,950             $27,457,689
$125,861,592            $129,008,132
$152,519,542            $156,465,820

                  $0                   $0
                  $0                   $0
                  $0                   $0
                  $0                   $0
                  $0                   $0

                 $0                   $0
                 $0                   $0
                 $0                   $0
                 $0                   $0
                 $0                   $0
                 $0                   $0
       $152,519,542         $156,465,820


$17,327,668             $17,847,498
         $1,000,000           $1,000,000
         $1,000,000           $1,000,000
           $100,000             $100,000
$375,000          $375,000
                 $0                $0

           $200,000         $200,000
        $20,002,668      $20,522,498
           $100,000         $100,000
            $19,200          $19,200    Assumed Growth Rate in Item Line Expense (Year 1 - 5):
            $86,400          $86,400    Assumed Growth Rate in Item Line Expense (Year 1 - 5):
            $24,000          $24,000    Assumed Growth Rate in Item Line Expense (Year 1 - 5):
           $192,000         $192,000    Assumed Growth Rate in Item Line Expense (Year 1 - 5):
            $86,400          $86,400    Assumed Growth Rate in Item Line Expense (Year 1 - 5):
           $256,000         $256,000    Assumed Growth Rate in Item Line Expense (Year 1 - 5):
           $576,000         $576,000    Assumed Growth Rate in Item Line Expense (Year 1 - 5):
           $800,000         $800,000    Assumed Growth Rate in Item Line Expense (Year 1 - 5):
         $1,600,000       $1,600,000    Assumed Growth Rate in Item Line Expense (Year 1 - 5):
         $1,152,000       $1,152,000    Assumed Growth Rate in Item Line Expense (Year 1 - 5):
           $50,000          $50,000
           $50,000          $50,000
  $0                    $0
         $4,992,000       $4,992,000
        $24,994,668      $25,514,498


         $7,655,531       $7,855,205


 2018
  35%


 2017                  2018
$266,667              $266,667
$266,667              $266,667
   $0                    $0
   $0                    $0
   $0                    $0
   $0                    $0
   $0                    $0
   $0                    $0
   $0                    $0
                         $0

$533,333              $533,333


 2016                  2017                  2018
  $0                    $0                    $0
  $0                    $0                    $0
$0                     $0            $0
$6,000                   $0            $0
$6,000                 $6,000          $0
  $0                     $0            $0
  $0                     $0            $0
  $0                     $0            $0
                         $0            $0
                                       $0

$12,000                $6,000          $0


 2017                   2018
                 $0              $0


                 $0              $0
                 $0              $0
                  $0              $0
                  $0              $0
                  $0              $0
                  $0              $0
                  $0              $0
            $533,333        $533,333
          $3,466,667      $2,933,333


                 $0              $0
                 $0              $0
                 $0              $0
                 $0              $0


 2017                  2018

                15%             15%
                 $0              $0
                 $0              $0
                 $0              $0
                 $0              $0
                 $0              $0
                 $0              $0


                10%             10%
                 $0              $0
                 $0              $0
                 $0              $0
                 $0              $0


                 $0              $0
2018
       4.47%
          1.0
         10%
       14.5%


         0%


          10    11
USA STATISTICS USED FOR FORECASTING


Total expenditure on health as % GDP (2005)
GDP (2008, official exchange rate)


                                                S. Korea
Total Expenditure on Health as % of GDP
(2005]                                                   05.9%²
GDP (2008, official exchange rate)             $857,500,000,000

Total Health Expenditure                        $50,592,500,000
Burns Market                                        $69,681,520
Wounds                                             $162,590,214
Reconstructive                                      $12,310,402

                                         Population and GDP figures from CIA world
                                         Health Data from WHO
                                       2 Data reported from WHO on Republic of Kor
 Assumed Licensing Agreement as % of Mkt Value
                                                S. Korea
Total Health Expenditure                       $50,592,500,000
Implied Burns Market                                $69,681,520
Implied Wounds                                    $162,590,214
Implied Reconstructive                              $12,310,402
Licensing Agreement Payment                     S. Korea
Burns Market                                         $2,787,261
Wounds                                               $6,503,609
Reconstructive                                         $492,416


                                                                            Burn
                                                    1
                      2009                                  $-
                      2010                                  $-
                      2011                        $125,222,002
                      2012                          $1,565,275
                      2013                          $3,130,550
                      2014                          $4,695,825
                      2015                          $6,261,100
                      2016                          $7,826,375
                      2017                          $7,904,639
                      2018                          $7,983,685
R&D as % of Gross Profit Under 0% Scenario   5.0%
100%
100%
100%
100%
100%
100%
100%
100%
100%
100%
Forecasting Licensing Agreements and Royalty P


                                                                                                 Health Care Expenditure
                                                      15.2%                                      Burns Market
                                                 $14,330,000,000,000                             Wounds
                                                                                                 Reconstructive


                         China                Japan                    India                     Denmark                   Finland

                                      4.7%                     8.2%                    5.0%                       9.1%                       7.5%
                        $4,222,000,000,000       $4,844,000,000,000      $1,237,000,000,000           $369,600,000,000           $281,200,000,000

                          $198,434,000,000         $397,208,000,000            $61,850,000,000         $33,633,600,000               $21,090,000,000
                             $273,304,991              $547,078,268                $85,186,579             $46,323,870                   $29,047,453
                             $637,711,647            $1,276,515,958               $198,768,685            $108,089,029                   $67,777,390
                               $35,347,446             $149,899,445                 $5,395,150             $12,986,125                    $7,532,973

n and GDP figures from CIA world factbook

orted from WHO on Republic of Korea
                                                                 4%
                          China                       Japan                      India                  "Europe"                     Denmark
                          $198,434,000,000         $397,208,000,000            $61,850,000,000      $1,564,861,800,000               $33,633,600,000
                              $273,304,991             $547,078,268                $85,186,579           $2,155,298,692                  $46,323,870
                              $637,711,647           $1,276,515,958               $198,768,685           $5,029,030,282                 $108,089,029
                                $35,347,446            $149,899,445                 $5,395,150             $557,200,235                  $12,986,125
                          China                       Japan                      India                  "Europe"                      Total
                                $10,932,200             $21,883,131                 $3,407,463              $86,211,948                 $125,222,002
                                $25,508,466             $51,060,638                 $7,950,747             $201,161,211                 $292,184,671
                                 $1,413,898              $5,995,978                   $215,806              $22,288,009                  $30,406,107


                                                                                                                              Additional Sources of Revenue Hlookup T
                                                                                            International Licensing
                          Burn                                                                       Chronic Wounds
                           2                            3                         1                        2                            3
                                        $-                       $-                        $-                       $-                            $-
                                        $-             $250,000,000                        $-                       $-                            $-
                              $125,222,002              $25,000,000                        $-                       $-                  $250,000,000
                                $1,565,275              $25,000,000              $292,184,671            $292,184,671                    $25,000,000
                                $3,130,550              $25,000,000                $3,652,308               $3,652,308                   $25,000,000
                                $4,695,825              $25,000,000                $7,304,617               $7,304,617                   $25,000,000
                                $6,261,100              $25,000,000               $10,956,925              $10,956,925                   $25,000,000
                                $7,826,375              $25,000,000               $14,609,234              $14,609,234                   $25,000,000
                                $7,904,639              $25,000,000               $18,261,542              $18,261,542                   $25,000,000
                                $7,983,685              $25,000,000               $18,444,157              $18,444,157                   $25,000,000


                                                                                                                            Forecasting Figures
                                                                                                        Scenario 2 Revs as % of Skin Graft Market ($11,000,000,000)
0.250%           Year 1
                                                                                            0.500%           Year 2
                                                                                            0.750%           Year 3
                                                                                            1.000%           Year 4
                                                                                            1.250%           Year 5

                                                                            Assumed Royalty Payment
                                                                            Assumed Growth in Markets after first 5 years


                                                                                                NI Under Revenue Scenario 1 for Valuation S
                                  2009                      2010                     2011                  2012
Revenues                                    $0               $25,000,000              $30,000,000            $35,400,000
COGS                                  $530,000               $10,080,000              $10,670,000            $10,383,600
SG&A                                $1,318,500                $7,798,000               $8,265,000             $9,757,340
R&D                                         $0                        $0                       $0                     $0
Depreciation                            $6,000                   $12,000                  $18,000                $24,000
Amortization                          $266,667                  $533,333                 $533,333               $533,333
Pretax Profit                      ($2,121,167)               $6,576,667              $10,513,667            $14,701,727
Tax                                         $0                $2,301,833               $3,679,783             $5,145,604
Corresponding NI                   ($2,121,167)               $4,274,833               $6,833,883             $9,556,122


                                                                                                NI Under Revenue Scenario 2 for Valuation S
                                  2009                       2010                   2011                   2012
Revenues                              $500,000           $58,500,000            $222,722,002           $411,649,946
COGS                                  $530,000                $36,955,000             $63,240,000             $88,845,000
SG&A                                $1,318,500                $10,073,000             $12,048,000             $15,176,000
R&D                                         $0                         $0                      $0             $32,280,495
Depreciation                            $6,000                    $12,000                 $18,000                 $24,000
Amortization                          $266,667                   $533,333                $533,333                $533,333
Pretax Profit                      ($1,621,167)               $10,926,667           $146,882,669             $274,791,119
Tax                                         $0                 $3,824,333             $51,408,934             $96,176,891
Corresponding NI                   ($1,621,167)                $7,102,333             $95,473,735            $178,614,227


Matrix Calculations
      Revenue Matrix
                                                                                       US Company Value with a 0% Chance of the Skin Gra
                           2009                   2010                      2011                   2012
US 0% Skin Graft                      $500,000               $31,000,000              $42,500,000           $35,400,000
COGS                                  $530,000               $12,500,000              $15,000,000           $17,700,000
SG&A                                $1,318,500               $10,073,000              $12,048,000           $15,176,000
R&D                                         $0                        $0                       $0              $885,000
Depr. & Amort                         $272,667                  $545,333                 $551,333              $557,333
EBIT                               ($1,621,167)               $7,881,667              $14,900,667            $1,081,667
Taxes                                       $0                $2,758,583               $5,215,233              $378,583
NI                                 ($1,621,167)               $5,123,083               $9,685,433              $703,083
Non-Cash Charges                      $272,667                  $545,333                 $551,333              $557,333
Less Net Working Capital              ($10,000)                ($610,000)               ($230,000)             $142,000
FCFF                               ($1,358,500)               $5,058,417              $10,006,767            $1,402,417
PV of FCFF                         ($1,068,339)               $3,072,521               $4,883,255              $549,829
Terminal Value                              $0
Sum of PV of FCFF                  $6,698,474
Value of Firm                      $6,698,474

                                                                                                                  US 100% Skin Graft
Revenues                             $500,000           $58,500,000              $97,500,000               $117,900,000
COGS                                 $530,000           $36,955,000              $63,240,000                $88,845,000
SG&A                               $1,318,500           $10,073,000              $12,048,000                $15,176,000
R&D                                        $0                    $0                       $0                $32,280,495
Depr. & Amort                        $272,667              $545,333                 $551,333                   $557,333
EBIT                              ($1,621,167)          $10,926,667              $21,660,667               ($18,958,828)
Taxes                                      $0            $3,824,333               $7,581,233                ($6,635,590)
NI                                ($1,621,167)           $7,102,333              $14,079,433               ($12,323,238)
Non-Cash Charges                     $272,667              $545,333                 $551,333                   $557,333
Less Net Working Capital             ($10,000)          ($1,160,000)               ($780,000)                 ($408,000)
FCFF                              ($1,358,500)           $6,487,667              $13,850,767               ($12,173,905)
PV of FCFF                        ($1,068,339)           $3,940,659               $6,759,108                ($4,772,883)
Terminal Value
Sum of PV of FCFF                 $16,549,853
Value of Firm                     $16,549,853
                                                                                                                International Revenues
South Korea
 Burns                                                                            $2,787,261                    $34,841
 Wounds                                                                                                      $6,503,609
 Reconstructive
South Korea Total                                                                 $2,787,261                 $6,538,449
China
 Burns                                                                           $10,932,200                   $136,652
 Wounds                                                                                                     $25,508,466
 Reconstructive
China Total                                                                      $10,932,200                $25,645,118
Japan
 Burns                                                                           $21,883,131                   $273,539
 Wounds                                                                                                     $51,060,638
 Reconstructive
Japan Total                                                                      $21,883,131                $51,334,177

India
 Burns                                                                            $3,407,463                    $42,593
 Wounds                                                                                                      $7,950,747
 Reconstructive
India Total                                                                       $3,407,463                 $7,993,341
Europe
 Burns                                                                           $86,211,948                 $1,077,649
 Wounds                                                                                                    $201,161,211
 Reconstructive
Europe Total                                                                     $86,211,948               $202,238,861


                                                                              Incremental Change in SG&A Expenses as a result of Licens
                           2009                  2010                  2011                 2012
Patents & Legal                            $0               $5,000                  $10,000                $10,000
Travel                                     $0               $5,000                  $10,000                $10,000
Total                                      $0              $10,000                  $20,000                $20,000


                                                                                                       Value of South Korea Licensing Agr
                           2009                  2010                  2011                     2012
Increase in Revenue                                 $0                    $0            $2,787,261              $6,538,449
Increase in Expenses                                $0               $10,000               $20,000                 $20,000
Increase (Decrease) in Taxes                        $0               ($3,500)             $968,541              $2,281,457
Increase in NI                                      $0               ($6,500)           $1,798,720              $4,236,992
Change in NWC                                       $0                      0             ($55,745)               ($75,024)
Change in FCFF                                      $0               ($6,500)           $1,742,974              $4,161,968
PV of FCFF                                          $0               ($3,948)             $850,563              $1,631,735
Value of South Korea Licensing Agreement                          $2,924,935

                                                                                                             Value of China Licensing Agreem
                              2009                        2010                  2011                  2012
Increase in Revenue                                 $0                    $0           $10,932,200             $25,645,118
Increase in Expenses                                $0               $10,000               $20,000                 $20,000
Increase (Decrease) in Taxes                        $0               ($3,500)           $3,819,270              $8,968,791
Increase in NI                                      $0               ($6,500)           $7,092,930             $16,656,327
Change in NWC                                       $0                      0            ($218,644)              ($294,258)
Change in FCFF                                      $0               ($6,500)           $6,874,286             $16,362,069
PV of FCFF                                          $0               ($3,948)           $3,354,619              $6,414,888
Value of China Licensing Agreement                               $11,450,226

                                                                                                             Value of Japan Licensing Agreem
                              2009                        2010                  2011                  2012
Increase in Revenue                                 $0                    $0           $21,883,131             $51,334,177
Increase in Expenses                                $0               $10,000               $20,000                 $20,000
Increase (Decrease) in Taxes                        $0               ($3,500)           $7,652,096             $17,959,962
Increase in NI                                      $0               ($6,500)          $14,211,035             $33,354,215
Change in NWC                                       $0                      0            ($437,663)              ($589,021)
Change in FCFF                                      $0               ($6,500)          $13,773,372             $32,765,194
PV of FCFF                                          $0               ($3,948)           $6,721,340             $12,845,874
Value of Japan Licensing Agreement                               $23,665,893

                                                                                                             Value of India Licensing Agreem
                              2009                        2010                  2011                  2012
Increase in Revenue                                 $0                    $0            $3,407,463              $7,993,341
Increase in Expenses                                $0               $10,000               $20,000                 $20,000
Increase (Decrease) in Taxes                        $0               ($3,500)           $1,185,612              $2,790,669
Increase in NI                                      $0               ($6,500)           $2,201,851              $5,182,671
Change in NWC                                       $0                      0             ($68,149)               ($91,718)
Change in FCFF                                      $0               ($6,500)           $2,133,702              $5,090,954
PV of FCFF                                          $0               ($3,948)           $1,041,236              $1,995,952
Value of India Licensing Agreement                                $3,495,956

                                                                                                             Value of Europe Licensing Agreem
                              2009                        2010                  2011                  2012
Increase in Revenue                                 $0                    $0           $86,211,948            $202,238,861
Increase in Expenses                                $0               $10,000               $20,000                 $20,000
Increase (Decrease) in Taxes                        $0               ($3,500)          $30,167,182             $70,776,601
Increase in NI                                      $0               ($6,500)          $56,024,766            $131,442,259
Change in NWC                                       $0                      0          ($1,724,239)            ($2,320,538)
Change in FCFF                                      $0               ($6,500)          $54,300,527            $129,121,721
PV of FCFF                                          $0               ($3,948)          $26,498,399             $50,623,271
Value of Europe Licensing Agreement                              $93,030,003

NI                                         ($1,621,167)           $7,069,833           $95,408,735            $178,549,227
PV of FCFF                                 ($1,068,339)           $3,920,918           $45,225,265             $68,738,837
NI difference                           $0               $0               $0
Revenues                       $58,500,000     $222,722,002     $411,649,946
COGS                           $36,955,000      $63,240,000      $88,845,000
SG&A                           $10,123,000      $12,148,000      $15,276,000
R&D                                     $0               $0      $32,280,495
Taxes                    $0      $3,806,833      $51,373,934      $96,141,891


NWC               ($10,000)     ($1,160,000)     ($3,284,440)     ($3,778,559)


FCFF            ($1,358,500)     $6,455,167      $92,675,628     $175,328,001
                ($1,068,339)     $3,920,918      $45,225,265      $68,738,837
                         $0              $0               $0               $0
                ($1,068,339)     $3,920,918      $45,225,265      $68,738,837
greements and Royalty Payments Calculations


                                           Market as % of Health
                   $2,178,160,000,000         Expenditures
                        $3,000,000,000                    0.138%
                        $7,000,000,000                    0.321%
                        $1,000,000,000                    0.046%


               France                      Germany                 Italy                  Netherlands             Spain

                                11.2%                     10.7%               8.9%                        9.2%               8.2%
                   $2,987,000,000,000        $3,818,000,000,000 $2,399,000,000,000            $909,500,000,000 $1,683,000,000,000

                     $334,544,000,000         $408,526,000,000        $213,511,000,000         $83,674,000,000      $138,006,000,000
                         $460,770,559             $562,666,654            $294,070,684            $115,244,977          $190,076,946
                       $1,075,131,303           $1,312,888,860            $686,164,928            $268,904,947          $443,512,873
                         $122,718,559             $144,230,219             $75,086,048             $24,931,330           $45,238,313


                         Finland                 France                  Germany                  Italy              Netherlands
                        $21,090,000,000       $334,544,000,000        $408,526,000,000        $213,511,000,000       $83,674,000,000
                            $29,047,453           $460,770,559            $562,666,654            $294,070,684          $115,244,977
                            $67,777,390         $1,075,131,303          $1,312,888,860            $686,164,928          $268,904,947
                              $7,532,973          $122,718,559            $144,230,219              $75,086,048          $24,931,330


nal Sources of Revenue Hlookup Table
                                                                                                                                       Grants
                                            Reconstruction                                                            AFIRM
                           1                        2                        3                     1                     2
                                     $-                       $-                     $-               $500,000             $500,000
                                     $-                       $-                     $-             $1,000,000           $1,000,000
                                     $-                       $-                     $-                     $-           $7,500,000
                                     $-                       $-           $250,000,000                     $-                   $-
                            $30,406,107              $30,406,107            $25,000,000                     $-                   $-
                               $380,076                 $380,076            $25,000,000                     $-                   $-
                               $760,153                 $760,153            $25,000,000                     $-                   $-
                             $1,140,229               $1,140,229            $25,000,000                     $-                   $-
                             $1,520,305               $1,520,305            $25,000,000                     $-                   $-
                             $1,900,382               $1,900,382            $25,000,000                     $-                   $-


ting Figures
  Graft Market ($11,000,000,000)
20%
                        1%


venue Scenario 1 for Valuation Sheet in Print Doc
                        2013                    2014                2015                  2016                   2017
                          $40,710,000             $44,781,000       $48,363,480            $51,265,289           $53,315,900
                          $10,160,872              $9,741,889        $9,936,727            $10,135,462           $10,338,171
                          $13,875,067             $13,999,228       $14,125,873            $14,155,050           $14,286,811
                                   $0                      $0                $0                     $0                    $0
                              $30,000                 $24,000           $18,000                $12,000                $6,000
                             $533,333                $533,333          $533,333               $533,333              $533,333
                          $16,110,728             $20,482,549       $23,749,547            $26,429,444           $28,151,585
                           $5,638,755              $7,168,892        $8,312,341             $9,250,305            $9,853,055
                          $10,471,973             $13,313,657       $15,437,205            $17,179,138           $18,298,530


venue Scenario 2 for Valuation Sheet in Print Doc
                        2013                    2014                2015                  2016                   2017
                    $187,898,966            $194,661,518        $207,279,158          $219,302,064           $229,074,847
                         $114,465,000           $139,265,500       $143,978,615           $148,424,441          $152,519,542
                          $20,897,750             $22,220,825       $23,385,131            $24,228,219           $24,894,668
                           $7,343,397              $5,539,602         $6,330,054            $7,087,762             $7,655,531
                              $30,000                 $24,000            $18,000               $12,000                 $6,000
                             $533,333                $533,333           $533,333              $533,333               $533,333
                          $44,629,486             $27,078,258       $33,034,024            $39,016,308           $43,465,774
                          $15,620,320              $9,477,390       $11,561,909            $13,655,708           $15,213,021
                          $29,009,166             $17,600,868       $21,472,116            $25,360,600           $28,252,753


th a 0% Chance of the Skin Graft Getting FDA Approval
            2013                     2014                  2015                    2016                   2017
                        $40,710,000          $44,781,000            $48,363,480            $51,265,289           $53,315,900
                        $20,355,000          $22,390,500            $24,181,740            $25,632,644           $26,657,950
                        $20,897,750          $22,220,825            $23,385,131            $24,228,219           $24,894,668
                         $1,017,750            $1,119,525            $1,209,087             $1,281,632            $1,332,898
                           $563,333              $557,333              $551,333               $545,333              $539,333
                        ($2,123,833)          ($1,507,183)            ($963,811)             ($422,540)            ($108,948)
                                 $0                    $0                    $0                     $0                    $0
                        ($2,123,833)          ($1,507,183)            ($963,811)             ($422,540)            ($108,948)
                           $563,333              $557,333              $551,333               $545,333              $539,333
                          ($106,200)             ($81,420)             ($71,650)              ($58,036)             ($41,012)
                        ($1,666,700)          ($1,031,270)            ($484,128)               $64,757              $389,373
                          ($524,981)            ($271,894)            ($106,839)               $12,484               $65,577
US 100% Skin Graft
                        $150,710,000          $182,281,000           $189,300,980           $195,726,226           $201,388,361
                        $114,465,000          $139,265,500           $143,978,615           $148,424,441           $152,519,542
                         $20,897,750           $22,220,825            $23,385,131            $24,228,219            $24,894,668
                          $7,343,397            $5,539,602             $6,330,054             $7,087,762             $7,655,531
                            $563,333              $557,333               $551,333               $545,333               $539,333
                          $7,440,520           $14,697,740            $15,055,846            $15,440,471            $15,779,288
                          $2,604,182            $5,144,209             $5,269,546             $5,404,165             $5,522,751
                          $4,836,338            $9,553,531             $9,786,300            $10,036,306            $10,256,537
                            $563,333              $557,333               $551,333               $545,333               $539,333
                           ($656,200)            ($631,420)             ($140,400)             ($128,505)             ($113,243)
                          $4,743,471            $9,479,444            $10,197,234            $10,453,134            $10,682,628
                          $1,494,110            $2,499,253             $2,250,354             $2,015,224             $1,799,133


      International Revenues

                                $69,682           $104,522               $139,363               $174,204               $175,946
                                $81,295           $162,590               $243,885               $325,180               $406,476
                               $492,416             $6,155                $12,310                $18,466                $24,621
                               $643,393           $273,268               $395,559               $517,850               $607,042

                               $273,305            $409,957              $546,610               $683,262               $690,095
                               $318,856            $637,712              $956,567             $1,275,423             $1,594,279
                             $1,413,898             $17,674               $35,347                $53,021                $70,695
                             $2,006,059          $1,065,343            $1,538,525             $2,011,707             $2,355,069

                               $547,078            $820,617            $1,094,157             $1,367,696             $1,381,373
                               $638,258          $1,276,516            $1,914,774             $2,553,032             $3,191,290
                             $5,995,978             $74,950              $149,899               $224,849               $299,799
                             $7,181,314          $2,172,083            $3,158,830             $4,145,577             $4,872,461


                                $85,187           $127,780               $170,373               $212,966               $215,096
                                $99,384           $198,769               $298,153               $397,537               $496,922
                               $215,806             $2,698                 $5,395                 $8,093                $10,790
                               $400,377           $329,246               $473,921               $618,597               $722,808

                           $2,155,299            $3,232,948            $4,310,597             $5,388,247             $5,442,129
                           $2,514,515            $5,029,030            $7,543,545            $10,058,061            $12,572,576
                          $22,288,009              $278,600              $557,200               $835,800             $1,114,400
                          $26,957,823            $8,540,578           $12,411,343            $16,282,108            $19,129,105


&A Expenses as a result of Licensing Agreements (per Country)
             2013                      2014                 2015                     2016                   2017
                              $10,000               $10,000               $10,000                $10,000                $10,000
                              $10,000               $10,000               $10,000                $10,000                $10,000
                              $20,000               $20,000               $20,000                $20,000                $20,000


ue of South Korea Licensing Agreement
              2013                  2014                      2015                   2016                   2017
$643,393           $273,268             $395,559              $517,850              $607,042
                            $20,000            $20,000              $20,000               $20,000               $20,000
                           $218,187            $88,644             $131,446              $174,247              $205,465
                           $405,205           $164,624             $244,113              $323,602              $381,577
                           $117,901             $7,403              ($2,446)              ($2,446)              ($1,784)
                           $523,106           $172,027             $241,667              $321,157              $379,794
                           $164,769            $45,355              $53,332               $61,915               $63,964


Value of China Licensing Agreement
              2013                   2014                 2015                  2016                  2017
                          $2,006,059         $1,065,343           $1,538,525            $2,011,707            $2,355,069
                             $20,000            $20,000              $20,000               $20,000               $20,000
                            $695,121           $365,870             $531,484             $697,097               $817,274
                          $1,290,938           $679,473             $987,041            $1,294,610            $1,517,795
                            $472,781            $18,814              ($9,464)              ($9,464)              ($6,867)
                          $1,763,719           $698,287             $977,578            $1,285,146            $1,510,928
                            $555,540           $184,103             $215,735             $247,759               $254,465


Value of Japan Licensing Agreement
              2013                   2014                 2015                  2016                  2017
                          $7,181,314         $2,172,083           $3,158,830            $4,145,577            $4,872,461
                             $20,000            $20,000              $20,000               $20,000               $20,000
                          $2,506,460           $753,229           $1,098,590            $1,443,952            $1,698,361
                          $4,654,854         $1,398,854           $2,040,239            $2,681,625            $3,154,100
                            $883,057           $100,185             ($19,735)             ($19,735)             ($14,538)
                          $5,537,911         $1,499,039           $2,020,505            $2,661,890            $3,139,562
                          $1,744,344           $395,221             $445,891             $513,177               $528,755


Value of India Licensing Agreement
               2013                  2014                 2015                  2016                  2017
                            $400,377          $329,246             $473,921              $618,597              $722,808
                             $20,000           $20,000              $20,000               $20,000               $20,000
                            $133,132          $108,236             $158,872              $209,509              $245,983
                            $247,245          $201,010             $295,049              $389,088              $456,825
                            $151,859            $1,423              ($2,894)              ($2,894)              ($2,084)
                            $399,104          $202,433             $292,155              $386,194              $454,741
                            $125,711           $53,371              $64,474               $74,453               $76,586


alue of Europe Licensing Agreement
             2013                    2014                 2015                  2016                  2017
                         $26,957,823         $8,540,578          $12,411,343           $16,282,108           $19,129,105
                             $20,000            $20,000              $20,000               $20,000               $20,000
                          $9,428,238         $2,982,202           $4,336,970            $5,691,738            $6,688,187
                         $17,509,585         $5,538,376           $8,054,373           $10,570,370           $12,420,918
                          $3,505,621           $368,345             ($77,415)             ($77,415)             ($56,940)
                         $21,015,206         $5,906,721           $7,976,958           $10,492,955           $12,363,979
                          $6,619,419         $1,557,305           $1,760,377            $2,022,901            $2,082,300


                        $28,944,166         $17,535,868          $21,407,116           $25,295,600           $28,187,753
                        $10,703,893          $4,734,609           $4,790,162            $4,935,428            $4,805,203
$0            $0            $0            $0            $0


$7,343,397
$15,585,320    $9,442,390   $11,526,909   $13,620,708   $15,178,021


 $4,475,020    ($135,251)    ($252,353)    ($240,458)    ($195,456)


$33,982,519   $17,957,950   $21,706,096   $25,600,476   $28,531,631
$10,703,893    $4,734,609    $4,790,162    $4,935,428    $4,805,203
         $0            $0            $0            $0            $0
$10,703,893    $4,734,609    $4,790,162    $4,935,428    $4,805,203
Sweden                Switzerland            UK

                      9.2%                   11.4%               8.2%
          $512,900,000,000        $492,600,000,000 $2,787,000,000,000

           $47,186,800,000         $56,156,400,000     $228,534,000,000
               $64,990,818             $77,344,731         $314,762,001
              $151,645,242            $180,471,040         $734,444,669
               $17,699,166             $15,391,602          $91,385,901


              Spain                 Sweden                 Switzerland          UK
          $138,006,000,000         $47,186,800,000        $56,156,400,000 $228,534,000,000
              $190,076,946             $64,990,818            $77,344,731     $314,762,001
              $443,512,873            $151,645,242           $180,471,040     $734,444,669
               $45,238,313             $17,699,166            $15,391,602      $91,385,901


             Grants
AFIRM                                                Dept. of Defense
                 3                     1                       2                 3
                   $500,000                     $-                    $-                $-
                 $1,000,000             $5,000,000            $5,000,000        $5,000,000
                 $7,500,000                     $-            $5,000,000        $5,000,000
                 $5,000,000                     $-                    $-        $5,000,000
                 $5,000,000                     $-                    $-        $5,000,000
                         $-                     $-                    $-                $-
                         $-                     $-                    $-                $-
                         $-                     $-                    $-                $-
                         $-                     $-                    $-                $-
                         $-                     $-                    $-                $-
2018
       $54,915,377
       $10,544,934
       $14,421,207
                $0
                $0
          $533,333
       $29,415,902
       $10,295,566
       $19,120,336


       2018
   $235,017,874
      $156,465,820
       $25,414,498
         $7,855,205
                 $0
           $533,333
       $44,749,018
       $15,662,156
       $29,086,861


2018
       $54,915,377 ***From 2010 Onward Assumes Lab Expenses and Employee Expenses for HUD are Done upon FDA FAILURE
       $27,457,689
       $25,414,498 ***Dropped R&D To 5% if HUD NOT APPROVE
        $1,372,884
          $533,333
          $136,973
           $47,941
           $89,033
          $533,333
          ($31,990)
          $590,376
           $86,861
                    Assumes Terminal Value is Zero, Update when you get SG&A numbers for this scenario and have a realistic 2018 FCFF
$206,689,650
       $156,465,820    What is Difference Between SG&A for him if HUD Does NOT GET APPROVE???????
        $25,414,498
         $7,855,205
           $533,333
        $16,420,793
         $5,747,278
        $10,673,516
           $533,333
          ($106,026)
        $11,100,823
         $1,633,235


           $177,705
           $410,540
            $30,776
           $619,022

           $696,996
         $1,610,222
            $88,369
         $2,395,587

         $1,395,186
         $3,223,203
           $374,749
         $4,993,138


           $217,247
           $501,891
            $13,488
           $732,626

         $5,496,550
        $12,698,301
         $1,393,001
        $19,587,853


2018
            $10,000
            $10,000
            $20,000


2018
$619,022
          $20,000
         $209,658
         $389,364
            ($240)
         $389,124
          $57,251


2018
        $2,395,587
           $20,000
          $831,455
        $1,544,131
             ($810)
        $1,543,321
          $227,065


2018
        $4,993,138
           $20,000
        $1,740,598
        $3,232,540
           ($2,414)
        $3,230,126
          $475,240


2018
         $732,626
          $20,000
         $249,419
         $463,207
            ($196)
         $463,010
          $68,122


2018
       $19,587,853
           $20,000
        $6,848,748
       $12,719,104
           ($9,175)
       $12,709,929
        $1,869,978


       $29,021,861
        $4,330,890
$0


$15,627,156


 ($118,861)


$29,436,334
 $4,330,890
         $0
 $4,330,890
Other Potentially Useful Forecasting Statistics
                                               S. Korea       China     Japan        India    Denmark
0-14 Population                                 8,166,097 265,167,835 17,149,265 362,874,979        997,664
15-64 Population                               35,093,893 964,906,976 81,721,301 741,248,288      3,616,764

65 + Population                                 5,248,982 108,538,157   28,208,113   61,955,950        886,082
Population Growth                                 0.266%      0.655%      -0.191%       1.548%         0.280%
Private Expenditure on Health as % of Total
Expenditures on Health (2005)                      47.0%²      61.2%        17.8%        81.0%          15.9%
Public Expenditure                                    ###        ###          ###          ###             ###
Private Expenditure                                   ###        ###          ###          ### $5,347,742,400
one upon FDA FAILURE


o and have a realistic 2018 FCFF
NOT GET APPROVE???????
Finland             France         Germany       Italy         Netherlands Spain          Sweden        Switzerland
        861,202         11,968,714    11,238,882     7,870,226     2,902,872    5,864,419       740,518    1,188,171
      3,506,287         41,892,404    54,384,520 38,511,780       11,324,401   27,306,506     5,930,396    5,176,918

          882,786       10,559,015    16,706,356   11,744,206    1,525,726     7,354,077      1,703,464    1,239,378
          0.098%           0.549%       -0.053%      -0.047%       0.412%        0.072%         0.158%       0.276%

          22.2%             20.1%         23.1%        23.4%        35.1%         28.6%          18.3%        40.3%
             ###              ###           ###          ###          ###           ###            ###          ###
 $4,681,980,000               ###           ###          ###          ###           ###            ###          ###
UK
       10,219,887
       41,020,711

        9,872,607
          0.279%

            12.9%
 $199,053,114,000
  $29,480,886,000
Income Statement


                                      2009            2010           2011           2012           2013           2014           2015           2016           2017           2018

Net Sales                                $500,000     $58,500,000   $222,722,002   $411,649,946   $187,898,966   $194,661,518   $207,279,158   $219,302,064   $229,074,847   $235,017,874
               % Growth                        NA       11600.0%          280.7%          84.8%         -54.4%           3.6%           6.5%           5.8%           4.5%           2.6%

Cost of Goods Sold                       $530,000     $36,955,000    $63,240,000    $88,845,000   $114,465,000   $139,265,500   $143,978,615   $148,424,441   $152,519,542   $156,465,820
               Gross Profit              ($30,000)    $21,545,000   $159,482,002   $322,804,946    $73,433,966    $55,396,018    $63,300,543    $70,877,623    $76,555,306    $78,552,054
               Gross Profit Margin          -6.0%           36.8%          71.6%          78.4%          39.1%          28.5%          30.5%          32.3%          33.4%          33.4%

SG&A                                    $1,318,500    $10,123,000    $12,148,000    $15,276,000    $20,997,750    $22,320,825    $23,485,131    $24,328,219    $24,994,668    $25,514,498
               SG&A (% of Sales)            263.7%          17.3%           5.5%           3.7%          11.2%          11.5%          11.3%          11.1%          10.9%          10.9%

R&D                                             $0             $0             $0    $32,280,495     $7,343,397     $5,539,602     $6,330,054     $7,087,762     $7,655,531     $7,855,205
               R&D (% of Sales)               0.0%           0.0%           0.0%           7.8%           3.9%           2.8%           3.1%           3.2%           3.3%           3.3%

               EBITDA                  ($1,348,500)   $11,422,000   $147,334,002   $275,248,452    $45,092,819    $27,535,591    $33,485,358    $39,461,642    $43,905,107    $45,182,351
               EBITDA Margin               -269.7%          19.5%          66.2%          66.9%          24.0%          14.1%          16.2%          18.0%          19.2%          19.2%

Depreciation                                $6,000        $12,000        $18,000        $24,000        $30,000        $24,000        $18,000        $12,000         $6,000             $0
Amortization                              $266,667       $533,333       $533,333       $533,333       $533,333       $533,333       $533,333       $533,333       $533,333       $533,333
               Pretax Income           ($1,621,167)   $10,876,667   $146,782,669   $274,691,119    $44,529,486    $26,978,258    $32,934,024    $38,916,308    $43,365,774    $44,649,018
               Pretax Margin               -324.2%          18.6%          65.9%          66.7%          23.7%          13.9%          15.9%          17.7%          18.9%          19.0%

Income Taxes                                    $0     $3,806,833    $51,373,934    $96,141,891    $15,585,320     $9,442,390    $11,526,909    $13,620,708    $15,178,021    $15,627,156
               Effective Tax Rate            35.0%          35.0%          35.0%          35.0%          35.0%          35.0%          35.0%          35.0%          35.0%          35.0%
               Net Income to Common    ($1,621,167)    $7,069,833    $95,408,735   $178,549,227    $28,944,166    $17,535,868    $21,407,116    $25,295,600    $28,187,753    $29,021,861
               Net Income Margin           -324.2%          12.1%          42.8%          43.4%          15.4%           9.0%          10.3%          11.5%          12.3%          12.3%
Cash F

Cash Flow from Operating Activities:
                   Net Income

                     Plus:                  Depreciation
                                            Amortization

                                            Funds Flow from Operations

                                            (Increase) / Decrease in Accounts Receivable
                                            (Increase) / Decrease in Other Current Assets
                                                                             (Increase) / Decrease in Current Operating Assets

                                            Increase / (Decrease) in Accounts Payable
                                            Increase / (Decrease) in Other Current Liabilities
                                                                             Increase / (Decrease) in Current Operating Liabilities

                                            (Increase) Decrease in Operating Working Capital

                                            (Increase) / Decrease in Other Long-Term Assets
                                            Increase / (Decrease) in Other Long-Term Liabilities

                     Cash Flow from Operations

Cash Flow from Investing Activities:
                   Less:                                                     Capital Expenditures

                     Cash Flow from Investing

                     OPERATING CASH FLOW AFTER INVESTING ACTIVITIES


Cash Flow from Financing Activities:
                   Cash Flow from Anticipated Debt and Equity Issuance
                                                                             Anticipated Issuance of New Common Equity Issuance
                                                                             Total Anticipated Debt and Equity Issuance


                     Total Change in Cash

                                            Beginning Cash Balance
                                                                             Total Change in Cash
                                            Ending Cash Balance
Cavit Financial Model(1)

Más contenido relacionado

La actualidad más candente

2005 Annual results
2005 Annual results2005 Annual results
2005 Annual resultsve-finance
 
petsmart ar2003
petsmart  ar2003petsmart  ar2003
petsmart ar2003finance49
 
cmi_07/03/06
cmi_07/03/06cmi_07/03/06
cmi_07/03/06finance21
 
pitney bowes FastFacts
pitney bowes FastFactspitney bowes FastFacts
pitney bowes FastFactsfinance47
 
2013 M&A Silicon Valley Gathering (MASiV)
2013 M&A Silicon Valley Gathering (MASiV)2013 M&A Silicon Valley Gathering (MASiV)
2013 M&A Silicon Valley Gathering (MASiV)Tricia Salinero
 
petsmart AR02
petsmart  AR02petsmart  AR02
petsmart AR02finance49
 
northrop grumman Annual Report 2004
northrop grumman Annual Report 2004northrop grumman Annual Report 2004
northrop grumman Annual Report 2004finance8
 
U.S. Airlines: Their Nascent Recovery and the Benefits to the Nation
U.S. Airlines: Their Nascent Recovery and the Benefits to the NationU.S. Airlines: Their Nascent Recovery and the Benefits to the Nation
U.S. Airlines: Their Nascent Recovery and the Benefits to the NationAdina Young
 
July 2012 plsn pdf
July 2012 plsn pdfJuly 2012 plsn pdf
July 2012 plsn pdfPLSN
 
Qr Codes in Magazine Advertising Q2 2012
Qr Codes in Magazine Advertising Q2 2012Qr Codes in Magazine Advertising Q2 2012
Qr Codes in Magazine Advertising Q2 2012Nellymoser, Inc.
 

La actualidad más candente (11)

2005 Annual results
2005 Annual results2005 Annual results
2005 Annual results
 
petsmart ar2003
petsmart  ar2003petsmart  ar2003
petsmart ar2003
 
2012 Recap, 1/15 mls meeting
2012 Recap, 1/15 mls meeting2012 Recap, 1/15 mls meeting
2012 Recap, 1/15 mls meeting
 
cmi_07/03/06
cmi_07/03/06cmi_07/03/06
cmi_07/03/06
 
pitney bowes FastFacts
pitney bowes FastFactspitney bowes FastFacts
pitney bowes FastFacts
 
2013 M&A Silicon Valley Gathering (MASiV)
2013 M&A Silicon Valley Gathering (MASiV)2013 M&A Silicon Valley Gathering (MASiV)
2013 M&A Silicon Valley Gathering (MASiV)
 
petsmart AR02
petsmart  AR02petsmart  AR02
petsmart AR02
 
northrop grumman Annual Report 2004
northrop grumman Annual Report 2004northrop grumman Annual Report 2004
northrop grumman Annual Report 2004
 
U.S. Airlines: Their Nascent Recovery and the Benefits to the Nation
U.S. Airlines: Their Nascent Recovery and the Benefits to the NationU.S. Airlines: Their Nascent Recovery and the Benefits to the Nation
U.S. Airlines: Their Nascent Recovery and the Benefits to the Nation
 
July 2012 plsn pdf
July 2012 plsn pdfJuly 2012 plsn pdf
July 2012 plsn pdf
 
Qr Codes in Magazine Advertising Q2 2012
Qr Codes in Magazine Advertising Q2 2012Qr Codes in Magazine Advertising Q2 2012
Qr Codes in Magazine Advertising Q2 2012
 

Similar a Cavit Financial Model(1)

2010 q3 google_earnings_slides
2010 q3 google_earnings_slides2010 q3 google_earnings_slides
2010 q3 google_earnings_slidesrabier
 
2012 q1 google_earnings_slides
2012 q1 google_earnings_slides2012 q1 google_earnings_slides
2012 q1 google_earnings_slidesDrew Olanoff
 
2012 q1 google_earnings_slides
2012 q1 google_earnings_slides2012 q1 google_earnings_slides
2012 q1 google_earnings_slidestheextraaedge
 
2012 q3 google_earnings_slides
2012 q3 google_earnings_slides2012 q3 google_earnings_slides
2012 q3 google_earnings_slidesGreg Sterling
 
2012 q2 google_earnings_slides
2012 q2 google_earnings_slides2012 q2 google_earnings_slides
2012 q2 google_earnings_slidesDrew Olanoff
 
Google Q4 2012 Quarterly Earnings Summary
Google Q4 2012 Quarterly Earnings SummaryGoogle Q4 2012 Quarterly Earnings Summary
Google Q4 2012 Quarterly Earnings SummaryKamaldeep Singh SEO
 
Google Q4 2012 Quarterly Earnings Summary
Google Q4 2012 Quarterly Earnings SummaryGoogle Q4 2012 Quarterly Earnings Summary
Google Q4 2012 Quarterly Earnings SummaryKit Seeborg
 
pitney bowes Monahan_2
pitney bowes  Monahan_2pitney bowes  Monahan_2
pitney bowes Monahan_2finance47
 
Yahoo! 2 Q 2007 Earnings Presentation
Yahoo! 2 Q 2007 Earnings PresentationYahoo! 2 Q 2007 Earnings Presentation
Yahoo! 2 Q 2007 Earnings Presentationeraz
 
Creditor Presentation
Creditor Presentation Creditor Presentation
Creditor Presentation finance2
 
Cummins_07/03/06
Cummins_07/03/06Cummins_07/03/06
Cummins_07/03/06finance21
 
Teton Valley Recycling, Llc Financial Plan
Teton Valley Recycling, Llc Financial PlanTeton Valley Recycling, Llc Financial Plan
Teton Valley Recycling, Llc Financial PlanScot Acocks
 

Similar a Cavit Financial Model(1) (20)

EXOTIC CARS ASSOCIATION
EXOTIC CARS ASSOCIATIONEXOTIC CARS ASSOCIATION
EXOTIC CARS ASSOCIATION
 
2010 q3 google_earnings_slides
2010 q3 google_earnings_slides2010 q3 google_earnings_slides
2010 q3 google_earnings_slides
 
Google Earnings Slides 2009 Q2
Google Earnings Slides 2009 Q2Google Earnings Slides 2009 Q2
Google Earnings Slides 2009 Q2
 
2012 q1 google_earnings_slides
2012 q1 google_earnings_slides2012 q1 google_earnings_slides
2012 q1 google_earnings_slides
 
2012 q1 google_earnings_slides
2012 q1 google_earnings_slides2012 q1 google_earnings_slides
2012 q1 google_earnings_slides
 
Dalkeith
DalkeithDalkeith
Dalkeith
 
2012 q3 google_earnings_slides
2012 q3 google_earnings_slides2012 q3 google_earnings_slides
2012 q3 google_earnings_slides
 
2012 q2 google_earnings_slides
2012 q2 google_earnings_slides2012 q2 google_earnings_slides
2012 q2 google_earnings_slides
 
Google Q4 2012 Quarterly Earnings Summary
Google Q4 2012 Quarterly Earnings SummaryGoogle Q4 2012 Quarterly Earnings Summary
Google Q4 2012 Quarterly Earnings Summary
 
Google Q4 2012 Quarterly Earnings Summary
Google Q4 2012 Quarterly Earnings SummaryGoogle Q4 2012 Quarterly Earnings Summary
Google Q4 2012 Quarterly Earnings Summary
 
Bemis mar13brief
Bemis mar13briefBemis mar13brief
Bemis mar13brief
 
Bemis mar13brief
Bemis mar13briefBemis mar13brief
Bemis mar13brief
 
IT Industry Statistics 2007 Final Report
IT Industry Statistics 2007 Final ReportIT Industry Statistics 2007 Final Report
IT Industry Statistics 2007 Final Report
 
pitney bowes Monahan_2
pitney bowes  Monahan_2pitney bowes  Monahan_2
pitney bowes Monahan_2
 
Yahoo! 2 Q 2007 Earnings Presentation
Yahoo! 2 Q 2007 Earnings PresentationYahoo! 2 Q 2007 Earnings Presentation
Yahoo! 2 Q 2007 Earnings Presentation
 
Car Net Business Plan
Car Net Business PlanCar Net Business Plan
Car Net Business Plan
 
Creditor Presentation
Creditor Presentation Creditor Presentation
Creditor Presentation
 
Cummins_07/03/06
Cummins_07/03/06Cummins_07/03/06
Cummins_07/03/06
 
Teton Valley Recycling, Llc Financial Plan
Teton Valley Recycling, Llc Financial PlanTeton Valley Recycling, Llc Financial Plan
Teton Valley Recycling, Llc Financial Plan
 
Hhaf Defaultprob
Hhaf DefaultprobHhaf Defaultprob
Hhaf Defaultprob
 

Último

Case study on tata clothing brand zudio in detail
Case study on tata clothing brand zudio in detailCase study on tata clothing brand zudio in detail
Case study on tata clothing brand zudio in detailAriel592675
 
FULL ENJOY Call girls in Paharganj Delhi | 8377087607
FULL ENJOY Call girls in Paharganj Delhi | 8377087607FULL ENJOY Call girls in Paharganj Delhi | 8377087607
FULL ENJOY Call girls in Paharganj Delhi | 8377087607dollysharma2066
 
NewBase 19 April 2024 Energy News issue - 1717 by Khaled Al Awadi.pdf
NewBase  19 April  2024  Energy News issue - 1717 by Khaled Al Awadi.pdfNewBase  19 April  2024  Energy News issue - 1717 by Khaled Al Awadi.pdf
NewBase 19 April 2024 Energy News issue - 1717 by Khaled Al Awadi.pdfKhaled Al Awadi
 
Cybersecurity Awareness Training Presentation v2024.03
Cybersecurity Awareness Training Presentation v2024.03Cybersecurity Awareness Training Presentation v2024.03
Cybersecurity Awareness Training Presentation v2024.03DallasHaselhorst
 
Investment in The Coconut Industry by Nancy Cheruiyot
Investment in The Coconut Industry by Nancy CheruiyotInvestment in The Coconut Industry by Nancy Cheruiyot
Investment in The Coconut Industry by Nancy Cheruiyotictsugar
 
(Best) ENJOY Call Girls in Faridabad Ex | 8377087607
(Best) ENJOY Call Girls in Faridabad Ex | 8377087607(Best) ENJOY Call Girls in Faridabad Ex | 8377087607
(Best) ENJOY Call Girls in Faridabad Ex | 8377087607dollysharma2066
 
Traction part 2 - EOS Model JAX Bridges.
Traction part 2 - EOS Model JAX Bridges.Traction part 2 - EOS Model JAX Bridges.
Traction part 2 - EOS Model JAX Bridges.Anamaria Contreras
 
Ten Organizational Design Models to align structure and operations to busines...
Ten Organizational Design Models to align structure and operations to busines...Ten Organizational Design Models to align structure and operations to busines...
Ten Organizational Design Models to align structure and operations to busines...Seta Wicaksana
 
Kenya’s Coconut Value Chain by Gatsby Africa
Kenya’s Coconut Value Chain by Gatsby AfricaKenya’s Coconut Value Chain by Gatsby Africa
Kenya’s Coconut Value Chain by Gatsby Africaictsugar
 
8447779800, Low rate Call girls in Tughlakabad Delhi NCR
8447779800, Low rate Call girls in Tughlakabad Delhi NCR8447779800, Low rate Call girls in Tughlakabad Delhi NCR
8447779800, Low rate Call girls in Tughlakabad Delhi NCRashishs7044
 
Digital Transformation in the PLM domain - distrib.pdf
Digital Transformation in the PLM domain - distrib.pdfDigital Transformation in the PLM domain - distrib.pdf
Digital Transformation in the PLM domain - distrib.pdfJos Voskuil
 
MAHA Global and IPR: Do Actions Speak Louder Than Words?
MAHA Global and IPR: Do Actions Speak Louder Than Words?MAHA Global and IPR: Do Actions Speak Louder Than Words?
MAHA Global and IPR: Do Actions Speak Louder Than Words?Olivia Kresic
 
PSCC - Capability Statement Presentation
PSCC - Capability Statement PresentationPSCC - Capability Statement Presentation
PSCC - Capability Statement PresentationAnamaria Contreras
 
8447779800, Low rate Call girls in Kotla Mubarakpur Delhi NCR
8447779800, Low rate Call girls in Kotla Mubarakpur Delhi NCR8447779800, Low rate Call girls in Kotla Mubarakpur Delhi NCR
8447779800, Low rate Call girls in Kotla Mubarakpur Delhi NCRashishs7044
 
Contemporary Economic Issues Facing the Filipino Entrepreneur (1).pptx
Contemporary Economic Issues Facing the Filipino Entrepreneur (1).pptxContemporary Economic Issues Facing the Filipino Entrepreneur (1).pptx
Contemporary Economic Issues Facing the Filipino Entrepreneur (1).pptxMarkAnthonyAurellano
 
Kenya Coconut Production Presentation by Dr. Lalith Perera
Kenya Coconut Production Presentation by Dr. Lalith PereraKenya Coconut Production Presentation by Dr. Lalith Perera
Kenya Coconut Production Presentation by Dr. Lalith Pereraictsugar
 
Marketplace and Quality Assurance Presentation - Vincent Chirchir
Marketplace and Quality Assurance Presentation - Vincent ChirchirMarketplace and Quality Assurance Presentation - Vincent Chirchir
Marketplace and Quality Assurance Presentation - Vincent Chirchirictsugar
 

Último (20)

Call Us ➥9319373153▻Call Girls In North Goa
Call Us ➥9319373153▻Call Girls In North GoaCall Us ➥9319373153▻Call Girls In North Goa
Call Us ➥9319373153▻Call Girls In North Goa
 
Case study on tata clothing brand zudio in detail
Case study on tata clothing brand zudio in detailCase study on tata clothing brand zudio in detail
Case study on tata clothing brand zudio in detail
 
FULL ENJOY Call girls in Paharganj Delhi | 8377087607
FULL ENJOY Call girls in Paharganj Delhi | 8377087607FULL ENJOY Call girls in Paharganj Delhi | 8377087607
FULL ENJOY Call girls in Paharganj Delhi | 8377087607
 
Corporate Profile 47Billion Information Technology
Corporate Profile 47Billion Information TechnologyCorporate Profile 47Billion Information Technology
Corporate Profile 47Billion Information Technology
 
NewBase 19 April 2024 Energy News issue - 1717 by Khaled Al Awadi.pdf
NewBase  19 April  2024  Energy News issue - 1717 by Khaled Al Awadi.pdfNewBase  19 April  2024  Energy News issue - 1717 by Khaled Al Awadi.pdf
NewBase 19 April 2024 Energy News issue - 1717 by Khaled Al Awadi.pdf
 
Cybersecurity Awareness Training Presentation v2024.03
Cybersecurity Awareness Training Presentation v2024.03Cybersecurity Awareness Training Presentation v2024.03
Cybersecurity Awareness Training Presentation v2024.03
 
Investment in The Coconut Industry by Nancy Cheruiyot
Investment in The Coconut Industry by Nancy CheruiyotInvestment in The Coconut Industry by Nancy Cheruiyot
Investment in The Coconut Industry by Nancy Cheruiyot
 
(Best) ENJOY Call Girls in Faridabad Ex | 8377087607
(Best) ENJOY Call Girls in Faridabad Ex | 8377087607(Best) ENJOY Call Girls in Faridabad Ex | 8377087607
(Best) ENJOY Call Girls in Faridabad Ex | 8377087607
 
Traction part 2 - EOS Model JAX Bridges.
Traction part 2 - EOS Model JAX Bridges.Traction part 2 - EOS Model JAX Bridges.
Traction part 2 - EOS Model JAX Bridges.
 
Ten Organizational Design Models to align structure and operations to busines...
Ten Organizational Design Models to align structure and operations to busines...Ten Organizational Design Models to align structure and operations to busines...
Ten Organizational Design Models to align structure and operations to busines...
 
Kenya’s Coconut Value Chain by Gatsby Africa
Kenya’s Coconut Value Chain by Gatsby AfricaKenya’s Coconut Value Chain by Gatsby Africa
Kenya’s Coconut Value Chain by Gatsby Africa
 
8447779800, Low rate Call girls in Tughlakabad Delhi NCR
8447779800, Low rate Call girls in Tughlakabad Delhi NCR8447779800, Low rate Call girls in Tughlakabad Delhi NCR
8447779800, Low rate Call girls in Tughlakabad Delhi NCR
 
Digital Transformation in the PLM domain - distrib.pdf
Digital Transformation in the PLM domain - distrib.pdfDigital Transformation in the PLM domain - distrib.pdf
Digital Transformation in the PLM domain - distrib.pdf
 
MAHA Global and IPR: Do Actions Speak Louder Than Words?
MAHA Global and IPR: Do Actions Speak Louder Than Words?MAHA Global and IPR: Do Actions Speak Louder Than Words?
MAHA Global and IPR: Do Actions Speak Louder Than Words?
 
PSCC - Capability Statement Presentation
PSCC - Capability Statement PresentationPSCC - Capability Statement Presentation
PSCC - Capability Statement Presentation
 
8447779800, Low rate Call girls in Kotla Mubarakpur Delhi NCR
8447779800, Low rate Call girls in Kotla Mubarakpur Delhi NCR8447779800, Low rate Call girls in Kotla Mubarakpur Delhi NCR
8447779800, Low rate Call girls in Kotla Mubarakpur Delhi NCR
 
Contemporary Economic Issues Facing the Filipino Entrepreneur (1).pptx
Contemporary Economic Issues Facing the Filipino Entrepreneur (1).pptxContemporary Economic Issues Facing the Filipino Entrepreneur (1).pptx
Contemporary Economic Issues Facing the Filipino Entrepreneur (1).pptx
 
Enjoy ➥8448380779▻ Call Girls In Sector 18 Noida Escorts Delhi NCR
Enjoy ➥8448380779▻ Call Girls In Sector 18 Noida Escorts Delhi NCREnjoy ➥8448380779▻ Call Girls In Sector 18 Noida Escorts Delhi NCR
Enjoy ➥8448380779▻ Call Girls In Sector 18 Noida Escorts Delhi NCR
 
Kenya Coconut Production Presentation by Dr. Lalith Perera
Kenya Coconut Production Presentation by Dr. Lalith PereraKenya Coconut Production Presentation by Dr. Lalith Perera
Kenya Coconut Production Presentation by Dr. Lalith Perera
 
Marketplace and Quality Assurance Presentation - Vincent Chirchir
Marketplace and Quality Assurance Presentation - Vincent ChirchirMarketplace and Quality Assurance Presentation - Vincent Chirchir
Marketplace and Quality Assurance Presentation - Vincent Chirchir
 

Cavit Financial Model(1)

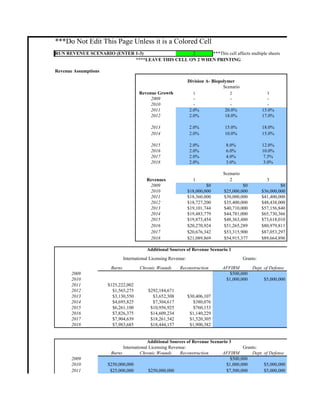
  • 1. ***Do Not Edit This Page Unless it is a Colored Cell RUN REVENUE SCENARIO (ENTER 1-3) 2 ***This cell affects multiple sheets ****LEAVE THIS CELL ON 2 WHEN PRINTING Revenue Assumptions Division A- Biopolymer Scenario Revenue Growth 1 2 3 2009 - - - 2010 - - - 2011 2.0% 20.0% 15.0% 2012 2.0% 18.0% 17.0% 2013 2.0% 15.0% 18.0% 2014 2.0% 10.0% 15.0% 2015 2.0% 8.0% 12.0% 2016 2.0% 6.0% 10.0% 2017 2.0% 4.0% 7.5% 2018 2.0% 3.0% 3.0% Scenario Revenues 1 2 3 2009 $0 $0 $0 2010 $18,000,000 $25,000,000 $36,000,000 2011 $18,360,000 $30,000,000 $41,400,000 2012 $18,727,200 $35,400,000 $48,438,000 2013 $19,101,744 $40,710,000 $57,156,840 2014 $19,483,779 $44,781,000 $65,730,366 2015 $19,873,454 $48,363,480 $73,618,010 2016 $20,270,924 $51,265,289 $80,979,811 2017 $20,676,342 $53,315,900 $87,053,297 2018 $21,089,869 $54,915,377 $89,664,896 Additional Sources of Revenue Scenario 1 International Licensing Revenue: Grants: Burns Chronic Wounds Reconstruction AFFIRM Dept. of Defense 2009 $500,000 2010 $1,000,000 $5,000,000 2011 $125,222,002 2012 $1,565,275 $292,184,671 2013 $3,130,550 $3,652,308 $30,406,107 2014 $4,695,825 $7,304,617 $380,076 2015 $6,261,100 $10,956,925 $760,153 2016 $7,826,375 $14,609,234 $1,140,229 2017 $7,904,639 $18,261,542 $1,520,305 2018 $7,983,685 $18,444,157 $1,900,382 Additional Sources of Revenue Scenario 3 International Licensing Revenue: Grants: Burns Chronic Wounds Reconstruction AFFIRM Dept. of Defense 2009 $500,000 2010 $250,000,000 $1,000,000 $5,000,000 2011 $25,000,000 $250,000,000 $7,500,000 $5,000,000
  • 2. 2012 $25,000,000 $25,000,000 $250,000,000 $5,000,000 $5,000,000 2013 $25,000,000 $25,000,000 $25,000,000 $5,000,000 $5,000,000 2014 $25,000,000 $25,000,000 $25,000,000 2015 $25,000,000 $25,000,000 $25,000,000 2016 $25,000,000 $25,000,000 $25,000,000 2017 $25,000,000 $25,000,000 $25,000,000 2018 $25,000,000 $25,000,000 $25,000,000 M 2009 2010 2011 Manufacturing (% of Revenues) 50% 50% 50% Lonza Sales Fee (% of Revenues) 15% 15% 15% Total Production Cost (% of Revenues) 65% 65% 65% Lonzas Share of Profit 50% 50% 50% McCoy's Profit (% of Revenues) 17.5% 17.5% 17.5% In HUD Phase 2009 2010 2011 Manufacturing (% of Revenues) 85% 85% 85% Price Paid (per cm³) Administrative (% of Revenues) 15% 15% 15% Selling Price (per cm³) McCoy's Profit (% of Revenues) 0% 0% 0% Manufacturing (% of Revenues) McCoy's Profit (% of Revenues) Expense A 2009 2010 2011 Operating Expenses Manufacturing Expenses- Division A $0 $12,500,000 $15,000,000 Manufacturing Expenses- Division B $0 $23,375,000 $46,750,000 Total Manufacturing Expense $0 $35,875,000 $61,750,000 Employee Expense HDE Application Clinical $30,000 $0 $0 HDE Application Technical $30,000 $0 $0 PMA Application Clinical $0 $100,000 $100,000 PMA Application Technical $0 $100,000 $100,000 Total Employee Expense $60,000 $200,000 $200,000 Laboratory: Trial Tech Transfer Verification Media Prep 1 $200,000 $400,000 $600,000 Media Release 1 $100,000 $200,000 $300,000 Lonza Skin Culture 1 $60,000 $120,000 $180,000 Cincinnati Skin Culture 1 $60,000 $60,000 $60,000 Lonza Mouse Graft Study 1 $50,000 $100,000 $150,000 Total Lab Expenses $470,000 $880,000 $1,290,000 Cost of Goods Sold $530,000 $36,955,000 $63,240,000 Sales, General & Administrative Lonza's "Sales and Marketing" Payments $0 $8,125,000 $9,750,000 CEO/Regulatory $100,000 $200,000 $200,000 COO/Corporate Liason $100,000 $200,000 $200,000 Senior Research Scientist Boyce $100,000 $100,000 $100,000
  • 3. Adult Clinical Program Manager $50,000 $100,000 $225,000 National Securities 7% $525,000 $525,000 $0 Accounting Expenses Corporate Counsel $120,000 $200,000 $200,000 Total Personnel Expense $995,000 $9,450,000 $10,675,000 Patents $24,000 $24,000 $175,000 Office Supplies $1,200 $2,400 $4,800 Telephone, Internet Service $5,400 $10,800 $21,600 General Liability (Fire theft) $1,500 $3,000 $6,000 Product Liability $12,000 $24,000 $48,000 Key Man Insurance 3 Employees $5,400 $10,800 $21,600 Director & Officer Insurance $16,000 $32,000 $64,000 Employee Health Insurance $36,000 $72,000 $144,000 Marketing/Tradeshow/Conference $50,000 $100,000 $200,000 Employment Benefits $100,000 $200,000 $400,000 Travel $72,000 $144,000 $288,000 Increase in Patents & Legal due to Licensing Agreements 0 $25,000 $50,000 Increase in Travel due to Licensing Agreements 0 $25,000 $50,000 Additional Administrative Expense Related to HUD $0 $0 $0 Total Other Expenses $323,500 $673,000 $1,473,000 Total SG&A Expenses $1,318,500 $10,123,000 $12,148,000 R&D as % Gross Profit 10.0% R&D Expenses $0 $0 $0 2009 2010 2011 2012 35% 35% 35% 35% Am Years to Amortize Intangibles 15 Total Intangible Assets 2009 2010 2011 2009 $4,000,000 $266,667 $266,667 $266,667 2010 $4,000,000 $266,667 $266,667 2011 $- $0 2012 $- 2013 $- 2014 $- 2015 $- 2016 $- 2017 $- 2018 $- Total Amortization $266,667 $533,333 $533,333 Straight L Years to Depreciat Office Equipment 5 Years to Depreciate CAPEX 15 Office Equipment Purchase Capital Expenditures 2009 2010 2009 $30,000 $6,000 $6,000 2010 $30,000 $6,000
  • 4. 2011 $30,000 $- 2012 $30,000 $- 2013 $30,000 $- 2014 $- $- 2015 $- $- 2016 $- $- 2017 $- $- 2018 $- $- Total Depreciation $6,000 $12,000 CASH FLOW 2009 2010 2011 Equity Issuance in Year 1 $7,500,000 $0 $0 Intangible Assets Licensing payment Lonza Marketing & Distribution $2,000,000 $0 $0 Cutanogen Final Payment Lonza $0 $2,000,000 $0 Milestone Payment Boyce HDE app $1,000,000 $0 $0 Milestone Payment University Cincinati HDE APP $1,000,000 $0 $0 Milestone Payment Boyce PMA application $0 $1,000,000 $0 Milestone Payment University Cinncinati PMA APP $0 $1,000,000 $0 Total Intangible Asset Purchased $4,000,000 $4,000,000 $0 Amortization $266,667 $533,333 $533,333 Net Intangible Value $3,733,333 $7,200,000 $6,666,667 Capital Expenditures Capital Expenditures $0 $0 $0 Asset Purchases Office Equipment $30,000 $30,000 $30,000 Total Capital Expenditures $30,000 $30,000 $30,000 Net Asset Value $24,000 $42,000 $54,000 Balance She 2009 2010 2011 Assets Accounts Receivable (% Revenues) 15% 15% 15% Restricted Cash $0 $0 $0 Other Current Assets $0 $0 $0 Other Current Asssets $0 $0 $0 Existing Goodwill and Intangibles $0 $0 $0 Transaction Goodwill $0 $0 $0 Other Long-Term Assets $0 $0 $0 Liabilities Accounts Payable (% Revenues) 10% 10% 10% Other Current Liabilities $0 $0 $0 Existing Long-Term Debt $0 $0 $0 Exisiting Other Debt Affirm Grant Payment $500,000 $0 Other Long-Term Liabilities $0 $0 $0 Minority Interest $0 $0 $0 % of Dividend to be Paid out of CF After Operations and 80% Investing Activities Post 2009
  • 5. % of Dividend to be Paid out of CF After Operations and 80% Investing Activities Post 2009 If debt is incurred, make sure to accou Valuation Assumpt Cost of Equity- CAPM 2009 2010 2011 2012 Risk Free Rate (20-Year Treasury) 4.47% 4.47% 4.47% 4.47% Beta 1.0 1.0 1.0 1.0 Risk Premium 25% 25% 20% 20% Cost of Equity- CAPM 29.5% 29.5% 24.5% 24.5% Cost of Debt Milestone Payments Interest 0% 0% 0% 0% Working Capital Working Capital as % of Revenues 2% Terminal Value Calculation Terminal Growth Rate 3.0% Discount Rate 10.0% 1 2 3 4 2 3 4 5 6 7 8 9 10 11
  • 6. Division B- HUD/PMA Scenario Revenue Growth 1 2009 - 2010 - 2011 - 2012 - 2013 - 2014 - 2015 0.0% 2016 0.0% 2017 0.0% 2018 0.0% Scenario Revenues 1 2009 $0 2010 $0 2011 $0 2012 $0 2013 $0 2014 $0 2015 $0 2016 $0 2017 $0 2018 $0 Additional Sources of Revenue Scenario 2 International Licensing Revenue: Total Additional Revenue Burns Chronic Wounds $500,000 2009 $6,000,000 2010 $125,222,002 2011 $125,222,002 $293,749,946 2012 $1,565,275 $292,184,671 $37,188,966 2013 $3,130,550 $3,652,308 $12,380,518 2014 $4,695,825 $7,304,617 $17,978,178 2015 $6,261,100 $10,956,925 $23,575,838 2016 $7,826,375 $14,609,234 $27,686,486 2017 $7,904,639 $18,261,542 $28,328,224 2018 $7,983,685 $18,444,157 Total Additional Total Revenues Revenue Scenario 1 $500,000 2009 $500,000 $256,000,000 2010 $24,000,000 $287,500,000 2011 $143,582,002
  • 7. $310,000,000 2012 $312,477,146 $85,000,000 2013 $56,290,710 $75,000,000 2014 $31,864,297 $75,000,000 2015 $37,851,632 $75,000,000 2016 $43,846,761 $75,000,000 2017 $48,362,828 $75,000,000 2018 $49,418,093 Margin Assumptions Division A 2012 2013 2014 2015 2016 50% 50% 50% 50% 50% 15% 15% 15% 15% 15% 65% 65% 65% 65% 65% 50% 50% 50% 50% 50% 17.5% 17.5% 17.5% 17.5% 17.5% Division B In PMA Phase 2012 2013 2014 2015 e Paid (per cm³) $25.00 $25.00 $20.00 $20.00 ing Price (per cm³) $55.00 $55.00 $55.00 $55.00 ufacturing (% of Revenues) 45% 45% 36% 36% Coy's Profit (% of Revenues) 55% 55% 64% 64% Expense Assumptions 2012 2013 2014 2015 2016 $17,700,000 $20,355,000 $22,390,500 $24,181,740 $25,632,644 $70,125,000 $93,500,000 $116,875,000 $119,796,875 $122,791,797 $87,825,000 $113,855,000 $139,265,500 $143,978,615 $148,424,441 $0 $0 $0 $0 $0 $0 $0 $0 $0 $0 $100,000 $100,000 $0 $0 $0 $100,000 $100,000 $0 $0 $0 $200,000 $200,000 $0 $0 $0 $400,000 $200,000 $0 $0 $0 $200,000 $100,000 $0 $0 $0 $120,000 $60,000 $0 $0 $0 $0 $0 $0 $0 $0 $100,000 $50,000 $0 $0 $0 $820,000 $410,000 $0 $0 $0 $88,845,000 $114,465,000 $139,265,500 $143,978,615 $148,424,441 $11,505,000 $13,230,750 $14,553,825 $15,718,131 $16,661,219 $200,000 $1,000,000 $1,000,000 $1,000,000 $1,000,000 $200,000 $1,000,000 $1,000,000 $1,000,000 $1,000,000 $100,000 $100,000 $100,000 $100,000 $100,000
  • 8. $375,000 $375,000 $375,000 $375,000 $375,000 $0 $0 $0 $0 $0 $200,000 $200,000 $200,000 $200,000 $200,000 $12,580,000 $15,905,750 $17,228,825 $18,393,131 $19,336,219 $200,000 $200,000 $200,000 $200,000 $100,000 $9,600 $19,200 $19,200 $19,200 $19,200 $43,200 $86,400 $86,400 $86,400 $86,400 $12,000 $24,000 $24,000 $24,000 $24,000 $96,000 $192,000 $192,000 $192,000 $192,000 $43,200 $86,400 $86,400 $86,400 $86,400 $128,000 $256,000 $256,000 $256,000 $256,000 $288,000 $576,000 $576,000 $576,000 $576,000 $400,000 $800,000 $800,000 $800,000 $800,000 $800,000 $1,600,000 $1,600,000 $1,600,000 $1,600,000 $576,000 $1,152,000 $1,152,000 $1,152,000 $1,152,000 $50,000 $50,000 $50,000 $50,000 $50,000 $50,000 $50,000 $50,000 $50,000 $50,000 $0 $0 $0 $0 $0 $2,696,000 $5,092,000 $5,092,000 $5,092,000 $4,992,000 $15,276,000 $20,997,750 $22,320,825 $23,485,131 $24,328,219 $32,280,495 $7,343,397 $5,539,602 $6,330,054 $7,087,762 Tax Rate Assumption 2013 2014 2015 2016 2017 35% 35% 35% 35% 35% Amortizaiton Schedule 2012 2013 2014 2015 2016 $266,667 $266,667 $266,667 $266,667 $266,667 $266,667 $266,667 $266,667 $266,667 $266,667 $0 $0 $0 $0 $0 $0 $0 $0 $0 $0 $0 $0 $0 $0 $0 $0 $0 $0 $0 $0 $533,333 $533,333 $533,333 $533,333 $533,333 Straight Line Depreciation Schedule 2011 2012 2013 2014 2015 $6,000 $6,000 $6,000 $0 $0 $6,000 $6,000 $6,000 $6,000 $0
  • 9. $6,000 $6,000 $6,000 $6,000 $6,000 $6,000 $6,000 $6,000 $6,000 $6,000 $6,000 $6,000 $0 $0 $0 $18,000 $24,000 $30,000 $24,000 $18,000 CASH FLOW ASSUMPTIONS 2012 2013 2014 2015 2016 $0 $0 $0 $0 $0 $0 $0 $0 $0 $0 $0 $0 $0 $0 $0 $0 $0 $0 $0 $0 $0 $0 $0 $0 $0 $0 $0 $0 $0 $0 $0 $0 $0 $0 $0 $0 $0 $0 $0 $0 $533,333 $533,333 $533,333 $533,333 $533,333 $6,133,333 $5,600,000 $5,066,667 $4,533,333 $4,000,000 $0 $0 $0 $0 $0 $30,000 $30,000 $0 $0 $0 $30,000 $30,000 $0 $0 $0 $60,000 $60,000 $36,000 $18,000 $6,000 Balance Sheet Assumption 2012 2013 2014 2015 2016 15% 15% 15% 15% 15% $0 $0 $0 $0 $0 $0 $0 $0 $0 $0 $0 $0 $0 $0 $0 $0 $0 $0 $0 $0 $0 $0 $0 $0 $0 $0 $0 $0 $0 $0 10% 10% 10% 10% 10% $0 $0 $0 $0 $0 $0 $0 $0 $0 $0 $0 $0 $0 $0 $0 $0 $0 $0 $0 $0 $0 $0 $0 $0 $0
  • 10. ebt is incurred, make sure to account for interest Valuation Assumptions 2013 2014 2015 2016 2017 4.47% 4.47% 4.47% 4.47% 4.47% 1.0 1.0 1.0 1.0 1.0 20% 15% 15% 10% 10% 24.5% 19.5% 19.5% 14.5% 14.5% 0% 0% 0% 0% 0% 5 6 7 8 9
  • 11. Division B- HUD/PMA Scenario 2 3 - - - - - - - - - - - - 2.5% 5.0% 2.5% 5.0% 2.5% 5.0% 2.5% 5.0% Scenario 2 3 $0 $0 $27,500,000 $90,000,000 $55,000,000 $125,000,000 $82,500,000 $200,000,000 $110,000,000 $600,000,000 $137,500,000 $750,000,000 $140,937,500 $787,500,000 $144,460,938 $826,875,000 $148,072,461 $868,218,750 $151,774,272 $911,629,688 Additional Sources of Revenue Scenario 2 l Licensing Revenue: Grants: Total Additional Reconstruction AFFIRM Dept. of Defense Revenue $500,000 $500,000 $1,000,000 $5,000,000 $6,000,000 $7,500,000 $5,000,000 $137,722,002 $293,749,946 $30,406,107 $37,188,966 $380,076 $12,380,518 $760,153 $17,978,178 $1,140,229 $23,575,838 $1,520,305 $27,686,486 $1,900,382 $28,328,224 Total Revenues 2 3 $500,000 $500,000 $58,500,000 $382,000,000 $222,722,002 $453,900,000
  • 12. $411,649,946 $558,438,000 $187,898,966 $742,156,840 $194,661,518 $890,730,366 $207,279,158 $936,118,010 $219,302,064 $982,854,811 $229,074,847 $1,030,272,047 $235,017,874 $1,076,294,583 2017 2018 50% 50% 15% 15% 65% 65% 50% 50% 17.5% 17.5% 2016 2017 2018 $20.00 $20.00 $20.00 $55.00 $55.00 $55.00 36% 36% 36% 64% 64% 64% 2017 2018 $26,657,950 $27,457,689 $125,861,592 $129,008,132 $152,519,542 $156,465,820 $0 $0 $0 $0 $0 $0 $0 $0 $0 $0 $0 $0 $0 $0 $0 $0 $0 $0 $0 $0 $0 $0 $152,519,542 $156,465,820 $17,327,668 $17,847,498 $1,000,000 $1,000,000 $1,000,000 $1,000,000 $100,000 $100,000
  • 13. $375,000 $375,000 $0 $0 $200,000 $200,000 $20,002,668 $20,522,498 $100,000 $100,000 $19,200 $19,200 Assumed Growth Rate in Item Line Expense (Year 1 - 5): $86,400 $86,400 Assumed Growth Rate in Item Line Expense (Year 1 - 5): $24,000 $24,000 Assumed Growth Rate in Item Line Expense (Year 1 - 5): $192,000 $192,000 Assumed Growth Rate in Item Line Expense (Year 1 - 5): $86,400 $86,400 Assumed Growth Rate in Item Line Expense (Year 1 - 5): $256,000 $256,000 Assumed Growth Rate in Item Line Expense (Year 1 - 5): $576,000 $576,000 Assumed Growth Rate in Item Line Expense (Year 1 - 5): $800,000 $800,000 Assumed Growth Rate in Item Line Expense (Year 1 - 5): $1,600,000 $1,600,000 Assumed Growth Rate in Item Line Expense (Year 1 - 5): $1,152,000 $1,152,000 Assumed Growth Rate in Item Line Expense (Year 1 - 5): $50,000 $50,000 $50,000 $50,000 $0 $0 $4,992,000 $4,992,000 $24,994,668 $25,514,498 $7,655,531 $7,855,205 2018 35% 2017 2018 $266,667 $266,667 $266,667 $266,667 $0 $0 $0 $0 $0 $0 $0 $0 $0 $0 $0 $0 $0 $0 $0 $533,333 $533,333 2016 2017 2018 $0 $0 $0 $0 $0 $0
  • 14. $0 $0 $0 $6,000 $0 $0 $6,000 $6,000 $0 $0 $0 $0 $0 $0 $0 $0 $0 $0 $0 $0 $0 $12,000 $6,000 $0 2017 2018 $0 $0 $0 $0 $0 $0 $0 $0 $0 $0 $0 $0 $0 $0 $0 $0 $533,333 $533,333 $3,466,667 $2,933,333 $0 $0 $0 $0 $0 $0 $0 $0 2017 2018 15% 15% $0 $0 $0 $0 $0 $0 $0 $0 $0 $0 $0 $0 10% 10% $0 $0 $0 $0 $0 $0 $0 $0 $0 $0
  • 15. 2018 4.47% 1.0 10% 14.5% 0% 10 11
  • 16. USA STATISTICS USED FOR FORECASTING Total expenditure on health as % GDP (2005) GDP (2008, official exchange rate) S. Korea Total Expenditure on Health as % of GDP (2005] 05.9%² GDP (2008, official exchange rate) $857,500,000,000 Total Health Expenditure $50,592,500,000 Burns Market $69,681,520 Wounds $162,590,214 Reconstructive $12,310,402 Population and GDP figures from CIA world Health Data from WHO 2 Data reported from WHO on Republic of Kor Assumed Licensing Agreement as % of Mkt Value S. Korea Total Health Expenditure $50,592,500,000 Implied Burns Market $69,681,520 Implied Wounds $162,590,214 Implied Reconstructive $12,310,402 Licensing Agreement Payment S. Korea Burns Market $2,787,261 Wounds $6,503,609 Reconstructive $492,416 Burn 1 2009 $- 2010 $- 2011 $125,222,002 2012 $1,565,275 2013 $3,130,550 2014 $4,695,825 2015 $6,261,100 2016 $7,826,375 2017 $7,904,639 2018 $7,983,685
  • 17. R&D as % of Gross Profit Under 0% Scenario 5.0%
  • 19.
  • 20.
  • 21. Forecasting Licensing Agreements and Royalty P Health Care Expenditure 15.2% Burns Market $14,330,000,000,000 Wounds Reconstructive China Japan India Denmark Finland 4.7% 8.2% 5.0% 9.1% 7.5% $4,222,000,000,000 $4,844,000,000,000 $1,237,000,000,000 $369,600,000,000 $281,200,000,000 $198,434,000,000 $397,208,000,000 $61,850,000,000 $33,633,600,000 $21,090,000,000 $273,304,991 $547,078,268 $85,186,579 $46,323,870 $29,047,453 $637,711,647 $1,276,515,958 $198,768,685 $108,089,029 $67,777,390 $35,347,446 $149,899,445 $5,395,150 $12,986,125 $7,532,973 n and GDP figures from CIA world factbook orted from WHO on Republic of Korea 4% China Japan India "Europe" Denmark $198,434,000,000 $397,208,000,000 $61,850,000,000 $1,564,861,800,000 $33,633,600,000 $273,304,991 $547,078,268 $85,186,579 $2,155,298,692 $46,323,870 $637,711,647 $1,276,515,958 $198,768,685 $5,029,030,282 $108,089,029 $35,347,446 $149,899,445 $5,395,150 $557,200,235 $12,986,125 China Japan India "Europe" Total $10,932,200 $21,883,131 $3,407,463 $86,211,948 $125,222,002 $25,508,466 $51,060,638 $7,950,747 $201,161,211 $292,184,671 $1,413,898 $5,995,978 $215,806 $22,288,009 $30,406,107 Additional Sources of Revenue Hlookup T International Licensing Burn Chronic Wounds 2 3 1 2 3 $- $- $- $- $- $- $250,000,000 $- $- $- $125,222,002 $25,000,000 $- $- $250,000,000 $1,565,275 $25,000,000 $292,184,671 $292,184,671 $25,000,000 $3,130,550 $25,000,000 $3,652,308 $3,652,308 $25,000,000 $4,695,825 $25,000,000 $7,304,617 $7,304,617 $25,000,000 $6,261,100 $25,000,000 $10,956,925 $10,956,925 $25,000,000 $7,826,375 $25,000,000 $14,609,234 $14,609,234 $25,000,000 $7,904,639 $25,000,000 $18,261,542 $18,261,542 $25,000,000 $7,983,685 $25,000,000 $18,444,157 $18,444,157 $25,000,000 Forecasting Figures Scenario 2 Revs as % of Skin Graft Market ($11,000,000,000)
  • 22. 0.250% Year 1 0.500% Year 2 0.750% Year 3 1.000% Year 4 1.250% Year 5 Assumed Royalty Payment Assumed Growth in Markets after first 5 years NI Under Revenue Scenario 1 for Valuation S 2009 2010 2011 2012 Revenues $0 $25,000,000 $30,000,000 $35,400,000 COGS $530,000 $10,080,000 $10,670,000 $10,383,600 SG&A $1,318,500 $7,798,000 $8,265,000 $9,757,340 R&D $0 $0 $0 $0 Depreciation $6,000 $12,000 $18,000 $24,000 Amortization $266,667 $533,333 $533,333 $533,333 Pretax Profit ($2,121,167) $6,576,667 $10,513,667 $14,701,727 Tax $0 $2,301,833 $3,679,783 $5,145,604 Corresponding NI ($2,121,167) $4,274,833 $6,833,883 $9,556,122 NI Under Revenue Scenario 2 for Valuation S 2009 2010 2011 2012 Revenues $500,000 $58,500,000 $222,722,002 $411,649,946 COGS $530,000 $36,955,000 $63,240,000 $88,845,000 SG&A $1,318,500 $10,073,000 $12,048,000 $15,176,000 R&D $0 $0 $0 $32,280,495 Depreciation $6,000 $12,000 $18,000 $24,000 Amortization $266,667 $533,333 $533,333 $533,333 Pretax Profit ($1,621,167) $10,926,667 $146,882,669 $274,791,119 Tax $0 $3,824,333 $51,408,934 $96,176,891 Corresponding NI ($1,621,167) $7,102,333 $95,473,735 $178,614,227 Matrix Calculations Revenue Matrix US Company Value with a 0% Chance of the Skin Gra 2009 2010 2011 2012 US 0% Skin Graft $500,000 $31,000,000 $42,500,000 $35,400,000 COGS $530,000 $12,500,000 $15,000,000 $17,700,000 SG&A $1,318,500 $10,073,000 $12,048,000 $15,176,000 R&D $0 $0 $0 $885,000 Depr. & Amort $272,667 $545,333 $551,333 $557,333 EBIT ($1,621,167) $7,881,667 $14,900,667 $1,081,667 Taxes $0 $2,758,583 $5,215,233 $378,583 NI ($1,621,167) $5,123,083 $9,685,433 $703,083 Non-Cash Charges $272,667 $545,333 $551,333 $557,333 Less Net Working Capital ($10,000) ($610,000) ($230,000) $142,000 FCFF ($1,358,500) $5,058,417 $10,006,767 $1,402,417 PV of FCFF ($1,068,339) $3,072,521 $4,883,255 $549,829 Terminal Value $0
  • 23. Sum of PV of FCFF $6,698,474 Value of Firm $6,698,474 US 100% Skin Graft Revenues $500,000 $58,500,000 $97,500,000 $117,900,000 COGS $530,000 $36,955,000 $63,240,000 $88,845,000 SG&A $1,318,500 $10,073,000 $12,048,000 $15,176,000 R&D $0 $0 $0 $32,280,495 Depr. & Amort $272,667 $545,333 $551,333 $557,333 EBIT ($1,621,167) $10,926,667 $21,660,667 ($18,958,828) Taxes $0 $3,824,333 $7,581,233 ($6,635,590) NI ($1,621,167) $7,102,333 $14,079,433 ($12,323,238) Non-Cash Charges $272,667 $545,333 $551,333 $557,333 Less Net Working Capital ($10,000) ($1,160,000) ($780,000) ($408,000) FCFF ($1,358,500) $6,487,667 $13,850,767 ($12,173,905) PV of FCFF ($1,068,339) $3,940,659 $6,759,108 ($4,772,883) Terminal Value Sum of PV of FCFF $16,549,853 Value of Firm $16,549,853 International Revenues South Korea Burns $2,787,261 $34,841 Wounds $6,503,609 Reconstructive South Korea Total $2,787,261 $6,538,449 China Burns $10,932,200 $136,652 Wounds $25,508,466 Reconstructive China Total $10,932,200 $25,645,118 Japan Burns $21,883,131 $273,539 Wounds $51,060,638 Reconstructive Japan Total $21,883,131 $51,334,177 India Burns $3,407,463 $42,593 Wounds $7,950,747 Reconstructive India Total $3,407,463 $7,993,341 Europe Burns $86,211,948 $1,077,649 Wounds $201,161,211 Reconstructive Europe Total $86,211,948 $202,238,861 Incremental Change in SG&A Expenses as a result of Licens 2009 2010 2011 2012 Patents & Legal $0 $5,000 $10,000 $10,000 Travel $0 $5,000 $10,000 $10,000 Total $0 $10,000 $20,000 $20,000 Value of South Korea Licensing Agr 2009 2010 2011 2012
  • 24. Increase in Revenue $0 $0 $2,787,261 $6,538,449 Increase in Expenses $0 $10,000 $20,000 $20,000 Increase (Decrease) in Taxes $0 ($3,500) $968,541 $2,281,457 Increase in NI $0 ($6,500) $1,798,720 $4,236,992 Change in NWC $0 0 ($55,745) ($75,024) Change in FCFF $0 ($6,500) $1,742,974 $4,161,968 PV of FCFF $0 ($3,948) $850,563 $1,631,735 Value of South Korea Licensing Agreement $2,924,935 Value of China Licensing Agreem 2009 2010 2011 2012 Increase in Revenue $0 $0 $10,932,200 $25,645,118 Increase in Expenses $0 $10,000 $20,000 $20,000 Increase (Decrease) in Taxes $0 ($3,500) $3,819,270 $8,968,791 Increase in NI $0 ($6,500) $7,092,930 $16,656,327 Change in NWC $0 0 ($218,644) ($294,258) Change in FCFF $0 ($6,500) $6,874,286 $16,362,069 PV of FCFF $0 ($3,948) $3,354,619 $6,414,888 Value of China Licensing Agreement $11,450,226 Value of Japan Licensing Agreem 2009 2010 2011 2012 Increase in Revenue $0 $0 $21,883,131 $51,334,177 Increase in Expenses $0 $10,000 $20,000 $20,000 Increase (Decrease) in Taxes $0 ($3,500) $7,652,096 $17,959,962 Increase in NI $0 ($6,500) $14,211,035 $33,354,215 Change in NWC $0 0 ($437,663) ($589,021) Change in FCFF $0 ($6,500) $13,773,372 $32,765,194 PV of FCFF $0 ($3,948) $6,721,340 $12,845,874 Value of Japan Licensing Agreement $23,665,893 Value of India Licensing Agreem 2009 2010 2011 2012 Increase in Revenue $0 $0 $3,407,463 $7,993,341 Increase in Expenses $0 $10,000 $20,000 $20,000 Increase (Decrease) in Taxes $0 ($3,500) $1,185,612 $2,790,669 Increase in NI $0 ($6,500) $2,201,851 $5,182,671 Change in NWC $0 0 ($68,149) ($91,718) Change in FCFF $0 ($6,500) $2,133,702 $5,090,954 PV of FCFF $0 ($3,948) $1,041,236 $1,995,952 Value of India Licensing Agreement $3,495,956 Value of Europe Licensing Agreem 2009 2010 2011 2012 Increase in Revenue $0 $0 $86,211,948 $202,238,861 Increase in Expenses $0 $10,000 $20,000 $20,000 Increase (Decrease) in Taxes $0 ($3,500) $30,167,182 $70,776,601 Increase in NI $0 ($6,500) $56,024,766 $131,442,259 Change in NWC $0 0 ($1,724,239) ($2,320,538) Change in FCFF $0 ($6,500) $54,300,527 $129,121,721 PV of FCFF $0 ($3,948) $26,498,399 $50,623,271 Value of Europe Licensing Agreement $93,030,003 NI ($1,621,167) $7,069,833 $95,408,735 $178,549,227 PV of FCFF ($1,068,339) $3,920,918 $45,225,265 $68,738,837
  • 25. NI difference $0 $0 $0 Revenues $58,500,000 $222,722,002 $411,649,946 COGS $36,955,000 $63,240,000 $88,845,000 SG&A $10,123,000 $12,148,000 $15,276,000 R&D $0 $0 $32,280,495 Taxes $0 $3,806,833 $51,373,934 $96,141,891 NWC ($10,000) ($1,160,000) ($3,284,440) ($3,778,559) FCFF ($1,358,500) $6,455,167 $92,675,628 $175,328,001 ($1,068,339) $3,920,918 $45,225,265 $68,738,837 $0 $0 $0 $0 ($1,068,339) $3,920,918 $45,225,265 $68,738,837
  • 26. greements and Royalty Payments Calculations Market as % of Health $2,178,160,000,000 Expenditures $3,000,000,000 0.138% $7,000,000,000 0.321% $1,000,000,000 0.046% France Germany Italy Netherlands Spain 11.2% 10.7% 8.9% 9.2% 8.2% $2,987,000,000,000 $3,818,000,000,000 $2,399,000,000,000 $909,500,000,000 $1,683,000,000,000 $334,544,000,000 $408,526,000,000 $213,511,000,000 $83,674,000,000 $138,006,000,000 $460,770,559 $562,666,654 $294,070,684 $115,244,977 $190,076,946 $1,075,131,303 $1,312,888,860 $686,164,928 $268,904,947 $443,512,873 $122,718,559 $144,230,219 $75,086,048 $24,931,330 $45,238,313 Finland France Germany Italy Netherlands $21,090,000,000 $334,544,000,000 $408,526,000,000 $213,511,000,000 $83,674,000,000 $29,047,453 $460,770,559 $562,666,654 $294,070,684 $115,244,977 $67,777,390 $1,075,131,303 $1,312,888,860 $686,164,928 $268,904,947 $7,532,973 $122,718,559 $144,230,219 $75,086,048 $24,931,330 nal Sources of Revenue Hlookup Table Grants Reconstruction AFIRM 1 2 3 1 2 $- $- $- $500,000 $500,000 $- $- $- $1,000,000 $1,000,000 $- $- $- $- $7,500,000 $- $- $250,000,000 $- $- $30,406,107 $30,406,107 $25,000,000 $- $- $380,076 $380,076 $25,000,000 $- $- $760,153 $760,153 $25,000,000 $- $- $1,140,229 $1,140,229 $25,000,000 $- $- $1,520,305 $1,520,305 $25,000,000 $- $- $1,900,382 $1,900,382 $25,000,000 $- $- ting Figures Graft Market ($11,000,000,000)
  • 27. 20% 1% venue Scenario 1 for Valuation Sheet in Print Doc 2013 2014 2015 2016 2017 $40,710,000 $44,781,000 $48,363,480 $51,265,289 $53,315,900 $10,160,872 $9,741,889 $9,936,727 $10,135,462 $10,338,171 $13,875,067 $13,999,228 $14,125,873 $14,155,050 $14,286,811 $0 $0 $0 $0 $0 $30,000 $24,000 $18,000 $12,000 $6,000 $533,333 $533,333 $533,333 $533,333 $533,333 $16,110,728 $20,482,549 $23,749,547 $26,429,444 $28,151,585 $5,638,755 $7,168,892 $8,312,341 $9,250,305 $9,853,055 $10,471,973 $13,313,657 $15,437,205 $17,179,138 $18,298,530 venue Scenario 2 for Valuation Sheet in Print Doc 2013 2014 2015 2016 2017 $187,898,966 $194,661,518 $207,279,158 $219,302,064 $229,074,847 $114,465,000 $139,265,500 $143,978,615 $148,424,441 $152,519,542 $20,897,750 $22,220,825 $23,385,131 $24,228,219 $24,894,668 $7,343,397 $5,539,602 $6,330,054 $7,087,762 $7,655,531 $30,000 $24,000 $18,000 $12,000 $6,000 $533,333 $533,333 $533,333 $533,333 $533,333 $44,629,486 $27,078,258 $33,034,024 $39,016,308 $43,465,774 $15,620,320 $9,477,390 $11,561,909 $13,655,708 $15,213,021 $29,009,166 $17,600,868 $21,472,116 $25,360,600 $28,252,753 th a 0% Chance of the Skin Graft Getting FDA Approval 2013 2014 2015 2016 2017 $40,710,000 $44,781,000 $48,363,480 $51,265,289 $53,315,900 $20,355,000 $22,390,500 $24,181,740 $25,632,644 $26,657,950 $20,897,750 $22,220,825 $23,385,131 $24,228,219 $24,894,668 $1,017,750 $1,119,525 $1,209,087 $1,281,632 $1,332,898 $563,333 $557,333 $551,333 $545,333 $539,333 ($2,123,833) ($1,507,183) ($963,811) ($422,540) ($108,948) $0 $0 $0 $0 $0 ($2,123,833) ($1,507,183) ($963,811) ($422,540) ($108,948) $563,333 $557,333 $551,333 $545,333 $539,333 ($106,200) ($81,420) ($71,650) ($58,036) ($41,012) ($1,666,700) ($1,031,270) ($484,128) $64,757 $389,373 ($524,981) ($271,894) ($106,839) $12,484 $65,577
  • 28. US 100% Skin Graft $150,710,000 $182,281,000 $189,300,980 $195,726,226 $201,388,361 $114,465,000 $139,265,500 $143,978,615 $148,424,441 $152,519,542 $20,897,750 $22,220,825 $23,385,131 $24,228,219 $24,894,668 $7,343,397 $5,539,602 $6,330,054 $7,087,762 $7,655,531 $563,333 $557,333 $551,333 $545,333 $539,333 $7,440,520 $14,697,740 $15,055,846 $15,440,471 $15,779,288 $2,604,182 $5,144,209 $5,269,546 $5,404,165 $5,522,751 $4,836,338 $9,553,531 $9,786,300 $10,036,306 $10,256,537 $563,333 $557,333 $551,333 $545,333 $539,333 ($656,200) ($631,420) ($140,400) ($128,505) ($113,243) $4,743,471 $9,479,444 $10,197,234 $10,453,134 $10,682,628 $1,494,110 $2,499,253 $2,250,354 $2,015,224 $1,799,133 International Revenues $69,682 $104,522 $139,363 $174,204 $175,946 $81,295 $162,590 $243,885 $325,180 $406,476 $492,416 $6,155 $12,310 $18,466 $24,621 $643,393 $273,268 $395,559 $517,850 $607,042 $273,305 $409,957 $546,610 $683,262 $690,095 $318,856 $637,712 $956,567 $1,275,423 $1,594,279 $1,413,898 $17,674 $35,347 $53,021 $70,695 $2,006,059 $1,065,343 $1,538,525 $2,011,707 $2,355,069 $547,078 $820,617 $1,094,157 $1,367,696 $1,381,373 $638,258 $1,276,516 $1,914,774 $2,553,032 $3,191,290 $5,995,978 $74,950 $149,899 $224,849 $299,799 $7,181,314 $2,172,083 $3,158,830 $4,145,577 $4,872,461 $85,187 $127,780 $170,373 $212,966 $215,096 $99,384 $198,769 $298,153 $397,537 $496,922 $215,806 $2,698 $5,395 $8,093 $10,790 $400,377 $329,246 $473,921 $618,597 $722,808 $2,155,299 $3,232,948 $4,310,597 $5,388,247 $5,442,129 $2,514,515 $5,029,030 $7,543,545 $10,058,061 $12,572,576 $22,288,009 $278,600 $557,200 $835,800 $1,114,400 $26,957,823 $8,540,578 $12,411,343 $16,282,108 $19,129,105 &A Expenses as a result of Licensing Agreements (per Country) 2013 2014 2015 2016 2017 $10,000 $10,000 $10,000 $10,000 $10,000 $10,000 $10,000 $10,000 $10,000 $10,000 $20,000 $20,000 $20,000 $20,000 $20,000 ue of South Korea Licensing Agreement 2013 2014 2015 2016 2017
  • 29. $643,393 $273,268 $395,559 $517,850 $607,042 $20,000 $20,000 $20,000 $20,000 $20,000 $218,187 $88,644 $131,446 $174,247 $205,465 $405,205 $164,624 $244,113 $323,602 $381,577 $117,901 $7,403 ($2,446) ($2,446) ($1,784) $523,106 $172,027 $241,667 $321,157 $379,794 $164,769 $45,355 $53,332 $61,915 $63,964 Value of China Licensing Agreement 2013 2014 2015 2016 2017 $2,006,059 $1,065,343 $1,538,525 $2,011,707 $2,355,069 $20,000 $20,000 $20,000 $20,000 $20,000 $695,121 $365,870 $531,484 $697,097 $817,274 $1,290,938 $679,473 $987,041 $1,294,610 $1,517,795 $472,781 $18,814 ($9,464) ($9,464) ($6,867) $1,763,719 $698,287 $977,578 $1,285,146 $1,510,928 $555,540 $184,103 $215,735 $247,759 $254,465 Value of Japan Licensing Agreement 2013 2014 2015 2016 2017 $7,181,314 $2,172,083 $3,158,830 $4,145,577 $4,872,461 $20,000 $20,000 $20,000 $20,000 $20,000 $2,506,460 $753,229 $1,098,590 $1,443,952 $1,698,361 $4,654,854 $1,398,854 $2,040,239 $2,681,625 $3,154,100 $883,057 $100,185 ($19,735) ($19,735) ($14,538) $5,537,911 $1,499,039 $2,020,505 $2,661,890 $3,139,562 $1,744,344 $395,221 $445,891 $513,177 $528,755 Value of India Licensing Agreement 2013 2014 2015 2016 2017 $400,377 $329,246 $473,921 $618,597 $722,808 $20,000 $20,000 $20,000 $20,000 $20,000 $133,132 $108,236 $158,872 $209,509 $245,983 $247,245 $201,010 $295,049 $389,088 $456,825 $151,859 $1,423 ($2,894) ($2,894) ($2,084) $399,104 $202,433 $292,155 $386,194 $454,741 $125,711 $53,371 $64,474 $74,453 $76,586 alue of Europe Licensing Agreement 2013 2014 2015 2016 2017 $26,957,823 $8,540,578 $12,411,343 $16,282,108 $19,129,105 $20,000 $20,000 $20,000 $20,000 $20,000 $9,428,238 $2,982,202 $4,336,970 $5,691,738 $6,688,187 $17,509,585 $5,538,376 $8,054,373 $10,570,370 $12,420,918 $3,505,621 $368,345 ($77,415) ($77,415) ($56,940) $21,015,206 $5,906,721 $7,976,958 $10,492,955 $12,363,979 $6,619,419 $1,557,305 $1,760,377 $2,022,901 $2,082,300 $28,944,166 $17,535,868 $21,407,116 $25,295,600 $28,187,753 $10,703,893 $4,734,609 $4,790,162 $4,935,428 $4,805,203
  • 30. $0 $0 $0 $0 $0 $7,343,397 $15,585,320 $9,442,390 $11,526,909 $13,620,708 $15,178,021 $4,475,020 ($135,251) ($252,353) ($240,458) ($195,456) $33,982,519 $17,957,950 $21,706,096 $25,600,476 $28,531,631 $10,703,893 $4,734,609 $4,790,162 $4,935,428 $4,805,203 $0 $0 $0 $0 $0 $10,703,893 $4,734,609 $4,790,162 $4,935,428 $4,805,203
  • 31. Sweden Switzerland UK 9.2% 11.4% 8.2% $512,900,000,000 $492,600,000,000 $2,787,000,000,000 $47,186,800,000 $56,156,400,000 $228,534,000,000 $64,990,818 $77,344,731 $314,762,001 $151,645,242 $180,471,040 $734,444,669 $17,699,166 $15,391,602 $91,385,901 Spain Sweden Switzerland UK $138,006,000,000 $47,186,800,000 $56,156,400,000 $228,534,000,000 $190,076,946 $64,990,818 $77,344,731 $314,762,001 $443,512,873 $151,645,242 $180,471,040 $734,444,669 $45,238,313 $17,699,166 $15,391,602 $91,385,901 Grants AFIRM Dept. of Defense 3 1 2 3 $500,000 $- $- $- $1,000,000 $5,000,000 $5,000,000 $5,000,000 $7,500,000 $- $5,000,000 $5,000,000 $5,000,000 $- $- $5,000,000 $5,000,000 $- $- $5,000,000 $- $- $- $- $- $- $- $- $- $- $- $- $- $- $- $- $- $- $- $-
  • 32. 2018 $54,915,377 $10,544,934 $14,421,207 $0 $0 $533,333 $29,415,902 $10,295,566 $19,120,336 2018 $235,017,874 $156,465,820 $25,414,498 $7,855,205 $0 $533,333 $44,749,018 $15,662,156 $29,086,861 2018 $54,915,377 ***From 2010 Onward Assumes Lab Expenses and Employee Expenses for HUD are Done upon FDA FAILURE $27,457,689 $25,414,498 ***Dropped R&D To 5% if HUD NOT APPROVE $1,372,884 $533,333 $136,973 $47,941 $89,033 $533,333 ($31,990) $590,376 $86,861 Assumes Terminal Value is Zero, Update when you get SG&A numbers for this scenario and have a realistic 2018 FCFF
  • 33. $206,689,650 $156,465,820 What is Difference Between SG&A for him if HUD Does NOT GET APPROVE??????? $25,414,498 $7,855,205 $533,333 $16,420,793 $5,747,278 $10,673,516 $533,333 ($106,026) $11,100,823 $1,633,235 $177,705 $410,540 $30,776 $619,022 $696,996 $1,610,222 $88,369 $2,395,587 $1,395,186 $3,223,203 $374,749 $4,993,138 $217,247 $501,891 $13,488 $732,626 $5,496,550 $12,698,301 $1,393,001 $19,587,853 2018 $10,000 $10,000 $20,000 2018
  • 34. $619,022 $20,000 $209,658 $389,364 ($240) $389,124 $57,251 2018 $2,395,587 $20,000 $831,455 $1,544,131 ($810) $1,543,321 $227,065 2018 $4,993,138 $20,000 $1,740,598 $3,232,540 ($2,414) $3,230,126 $475,240 2018 $732,626 $20,000 $249,419 $463,207 ($196) $463,010 $68,122 2018 $19,587,853 $20,000 $6,848,748 $12,719,104 ($9,175) $12,709,929 $1,869,978 $29,021,861 $4,330,890
  • 36. Other Potentially Useful Forecasting Statistics S. Korea China Japan India Denmark 0-14 Population 8,166,097 265,167,835 17,149,265 362,874,979 997,664 15-64 Population 35,093,893 964,906,976 81,721,301 741,248,288 3,616,764 65 + Population 5,248,982 108,538,157 28,208,113 61,955,950 886,082 Population Growth 0.266% 0.655% -0.191% 1.548% 0.280% Private Expenditure on Health as % of Total Expenditures on Health (2005) 47.0%² 61.2% 17.8% 81.0% 15.9% Public Expenditure ### ### ### ### ### Private Expenditure ### ### ### ### $5,347,742,400
  • 37. one upon FDA FAILURE o and have a realistic 2018 FCFF
  • 39.
  • 40.
  • 41. Finland France Germany Italy Netherlands Spain Sweden Switzerland 861,202 11,968,714 11,238,882 7,870,226 2,902,872 5,864,419 740,518 1,188,171 3,506,287 41,892,404 54,384,520 38,511,780 11,324,401 27,306,506 5,930,396 5,176,918 882,786 10,559,015 16,706,356 11,744,206 1,525,726 7,354,077 1,703,464 1,239,378 0.098% 0.549% -0.053% -0.047% 0.412% 0.072% 0.158% 0.276% 22.2% 20.1% 23.1% 23.4% 35.1% 28.6% 18.3% 40.3% ### ### ### ### ### ### ### ### $4,681,980,000 ### ### ### ### ### ### ###
  • 42.
  • 43.
  • 44.
  • 45.
  • 46. UK 10,219,887 41,020,711 9,872,607 0.279% 12.9% $199,053,114,000 $29,480,886,000
  • 47.
  • 48.
  • 49.
  • 50.
  • 51. Income Statement 2009 2010 2011 2012 2013 2014 2015 2016 2017 2018 Net Sales $500,000 $58,500,000 $222,722,002 $411,649,946 $187,898,966 $194,661,518 $207,279,158 $219,302,064 $229,074,847 $235,017,874 % Growth NA 11600.0% 280.7% 84.8% -54.4% 3.6% 6.5% 5.8% 4.5% 2.6% Cost of Goods Sold $530,000 $36,955,000 $63,240,000 $88,845,000 $114,465,000 $139,265,500 $143,978,615 $148,424,441 $152,519,542 $156,465,820 Gross Profit ($30,000) $21,545,000 $159,482,002 $322,804,946 $73,433,966 $55,396,018 $63,300,543 $70,877,623 $76,555,306 $78,552,054 Gross Profit Margin -6.0% 36.8% 71.6% 78.4% 39.1% 28.5% 30.5% 32.3% 33.4% 33.4% SG&A $1,318,500 $10,123,000 $12,148,000 $15,276,000 $20,997,750 $22,320,825 $23,485,131 $24,328,219 $24,994,668 $25,514,498 SG&A (% of Sales) 263.7% 17.3% 5.5% 3.7% 11.2% 11.5% 11.3% 11.1% 10.9% 10.9% R&D $0 $0 $0 $32,280,495 $7,343,397 $5,539,602 $6,330,054 $7,087,762 $7,655,531 $7,855,205 R&D (% of Sales) 0.0% 0.0% 0.0% 7.8% 3.9% 2.8% 3.1% 3.2% 3.3% 3.3% EBITDA ($1,348,500) $11,422,000 $147,334,002 $275,248,452 $45,092,819 $27,535,591 $33,485,358 $39,461,642 $43,905,107 $45,182,351 EBITDA Margin -269.7% 19.5% 66.2% 66.9% 24.0% 14.1% 16.2% 18.0% 19.2% 19.2% Depreciation $6,000 $12,000 $18,000 $24,000 $30,000 $24,000 $18,000 $12,000 $6,000 $0 Amortization $266,667 $533,333 $533,333 $533,333 $533,333 $533,333 $533,333 $533,333 $533,333 $533,333 Pretax Income ($1,621,167) $10,876,667 $146,782,669 $274,691,119 $44,529,486 $26,978,258 $32,934,024 $38,916,308 $43,365,774 $44,649,018 Pretax Margin -324.2% 18.6% 65.9% 66.7% 23.7% 13.9% 15.9% 17.7% 18.9% 19.0% Income Taxes $0 $3,806,833 $51,373,934 $96,141,891 $15,585,320 $9,442,390 $11,526,909 $13,620,708 $15,178,021 $15,627,156 Effective Tax Rate 35.0% 35.0% 35.0% 35.0% 35.0% 35.0% 35.0% 35.0% 35.0% 35.0% Net Income to Common ($1,621,167) $7,069,833 $95,408,735 $178,549,227 $28,944,166 $17,535,868 $21,407,116 $25,295,600 $28,187,753 $29,021,861 Net Income Margin -324.2% 12.1% 42.8% 43.4% 15.4% 9.0% 10.3% 11.5% 12.3% 12.3%
  • 52. Cash F Cash Flow from Operating Activities: Net Income Plus: Depreciation Amortization Funds Flow from Operations (Increase) / Decrease in Accounts Receivable (Increase) / Decrease in Other Current Assets (Increase) / Decrease in Current Operating Assets Increase / (Decrease) in Accounts Payable Increase / (Decrease) in Other Current Liabilities Increase / (Decrease) in Current Operating Liabilities (Increase) Decrease in Operating Working Capital (Increase) / Decrease in Other Long-Term Assets Increase / (Decrease) in Other Long-Term Liabilities Cash Flow from Operations Cash Flow from Investing Activities: Less: Capital Expenditures Cash Flow from Investing OPERATING CASH FLOW AFTER INVESTING ACTIVITIES Cash Flow from Financing Activities: Cash Flow from Anticipated Debt and Equity Issuance Anticipated Issuance of New Common Equity Issuance Total Anticipated Debt and Equity Issuance Total Change in Cash Beginning Cash Balance Total Change in Cash Ending Cash Balance