SlideShare una empresa de Scribd logo
1 de 21
Descargar para leer sin conexión
CISCO Systems Inc.
Income Statement
(in $ millions, except per share/ADS data)
Oct-04 Jan-04 Apr-04 Jul-04
Q1 2004 A Q2 2004 A Q3 2004 A Q4 2004 A FY 2004 A
Income Statement
Net Sales
Product 4263 4550 4730 5007 18550
Service 838 848 890 919 3495
Total Net Sales 5101 5398 5620 5926 22045
product Costs 1316 1425 1452 1573 5766
Service Cost 279 275 301 298 1153
Total Cost of Sales 1595 1700 1753 1871 6919
Gross Margin 3506 3698 3867 4055 15126
Operating Expenses:
Research and Development 755 770 867 785 3177
Sales and Marketing 1087 1110 1153 1150 4500
General and Administrative 212 210 231 199 852
Amortization of Purchased Intangible Assets 62 60 60 60 242
In-Process Research and Development 0 1 2 0 3
Payroll Tax on Stock Option Exercises 0 0 0 4 4
Stock Based Compensation Related to Acquisition
and Investment 0 0 0 56 56
Total Operating Expenses 2116 2151 2313 2254 8834
Operating Income{Loss} 1390 1547 1554 1801 6292
Interest Income, Net 137 124 127 124 512
Other Income{Loss}, Net 1 136 40 11 188
Interest and Other Income, Net 138 260 167 135 700
Income Before Provision of Income Taxes 1528 1807 1721 1936 6992
provision for Income Taxes 442 516 510 556 2024
Net Income(Loss) Before Cumulative Effect of
Accounting Changes 1086 1291 1211 1380 4968
Cumulative Effect of Accounting Changes, Net of Tax 0 567 567
Net income 1086 724 1211 1380 4401
Reported - EPS Basic 0.16 0.11 0.18 0.20 0.64
Reported - EPS Diluted 0.15 0.10 0.17 0.20 0.62
Share Count Reported - Basic 6932 6874 6816 6736 6840
Share Count Reported - Diluted 7110 7110 7074 6935 7057
Oct-04 Jan-05 Apr-05 Jul-05 Oct-05 Jan-06 Apr-06 Jul-06
Q1 2005 A Q2 2005 A Q3 2005 A Q4 2005 A Fy 2005 A Q1 2006 A Q2 2006 A Q3 2006 A Q4 2006 A
5033 5106 5189 5525 20853 5491 5537 6155 6734
938 956 998 1056 3948 1059 1091 1167 1250
5971 6062 6187 6581 24801 6550 6628 7322 7984
1646 1669 1697 1746 6758 1751 1774 2193 2396
310 340 355 367 1372 389 388 403 443
1956 2009 2052 2113 8130 2140 2162 2596 2839
4015 4053 4135 4468 16671 4410 4466 4726 5145
805 811 823 883 3322 996 966 1041 1064
1120 1142 1190 1269 4721 1453 1431 1547 1600
230 228 244 257 959 278 282 298 311
60 57 54 56 227 59 56 99 179
12 2 6 6 26 2 0 88 1
2227 2240 2317 2471 9255 2788 2735 3073 3155
1788 1813 1818 1997 7416 1622 1731 1653 1990
130 127 142 153 552 154 168 142 143
40 17 8 3 68 -17 17 17 13
170 144 150 156 620 137 185 159 156
1958 1957 1968 2153 8036 1759 1916 1812 2146
562 557 563 613 2295 498 541 412 602
1396 1400 1405 1540 5741 1261 1375 1400 1544
0.21 0.21 0.22 0.24 0.89$ $0.20 $0.22 $0.23 $0.25
0.21 0.21 0.21 0.24 0.87$ $0.20 $0.22 $0.22 $0.25
6635 6521 6435 6366 6487 6245 6146 6160 6081
6773 6652 6541 6480 6612 6340 6248 6289 6187
Oct-06 Jan-07 Apr-07 Jul-07 Oct-07 Jan-08 Apr-08
Fy 2006 A Q1 2007 A Q2 2007 A Q3 2007 A Q4 2007 A FY 2007 A Q1 2008 A Q2 2008 A Q3 2008 A
23917 6940 7099 7481 7942 29462 8015 8245 8199
4567 1244 1340 1385 1491 5460 1539 1586 1592
28484 8184 8439 8866 9433 34922 9554 9831 9791
8114 2499 2544 2685 2820 10548 2823 2882 2865
1623 452 507 534 545 2038 558 609 621
9737 2951 3051 3219 3365 12586 3381 3491 3486
18747 5233 5388 5647 6068 22336 6173 6340 6305
4067 1083 1094 1144 1178 4499 1192 1216 1439
6031 1686 1726 1830 1973 7215 2003 2084 2129
1169 364 340 378 431 1513 490 520 479
393 105 96 97 109 407 117 116 117
91 4 2 1 74 81 3 0 0
11751 3242 3258 3450 3765 13715 3805 3936 4164
6996 1991 2130 2197 2303 8621 2368 2404 2141
607 157 172 189 197 715 223 212 201
30 28 33 33 31 125 31 22 -33
637 185 205 222 228 840 254 234 168
7633 2176 2335 2419 2531 9461 2622 2638 2309
2053 568 414 545 601 2128 417 578 536
5580 1608 1921 1874 1930 7333 2205 2060 1773
0.91$ $0.27 $0.32 $0.31 $0.32 $1.21 $0.36 $0.34 $0.30
0.89$ $0.26 $0.31 $0.30 $0.31 $1.17 $0.35 $0.33 $0.29
6158 6061 6057 6034 6062 6055 6087 6010 5942
6272 6199 6291 6244 6275 6265 6330 6202 6069
Jul-08
Q4 2008 A FY 2008 A
8640 33099
1724 6441
10364 39540
3061 11631
637 2425
3698 14056
6666 25484
1306 5153
2164 8380
518 2007
149 499
0 3
4137 16042
2529 9442
188 824
-31 -11
157 813
2686 10255
672 2203
2014 8052
$0.34 $1.35
$0.33 $1.31
5898 5986
6034 6163
CISCO Systems Inc.
Balance Sheet
(in $ millions, except per share/ADS data)
Oct-03 Jan-04 Apr-04 Jul-04
Q1 2004 A Q2 2004 A Q3 2004 A Q4 2004 A FY 2004 A
Balance Sheet
Assets
Current Assets
Cash and Cash Equivalents 4158 4225 3949 3722 3722
Investments 4837 5155 4912 4947 4947
Net Cash, Cash Equivalients and ST Investments 8995 9380 8861 8669 8669
Accounts Receivable - Net 1388 2040 1540 1825 1825
Inventories 875 933 1121 1207 1207
Deferred Tax Assets 2062 1947 1905 1827 1827
Lease Receivable,Net 140 57 65 0 0
Prepaid Expenses and Other Current Assets 567 604 581 815 815
Total Current Assets 14027 14961 14073 14343 14343
Property and Equipment,Net 3571 3441 3351 3290 3290
Goodwill 4043 4103 4198 4198 4198
Purchased Intangible Assets, Net 490 441 387 325 325
Other Assets 2947 2915 2810 2840 2840
Investments 10693 10454 10085 10598 10598
Lease Receivable,Net 79 275 293 0 0
Total Assets 35850 36590 35197 35594 35594
Liabilities and ShareHolders' Equity
Current Liabilities:
Current Porttion of Long-Term Debt 0 0 0 0 0
Accounts Payable 602 645 604 657 657
Income Taxes Payable 687 715 848 963 963
Accrued Compensation 1184 1400 1432 1466 1466
Deferred Revenue 3001 3202 3420 3527 3527
other Current Liabilities 2155 2040 1899 2090 2090
Restructuring Liabilities 86 78 71 0 0
Total Current Liabilities 7715 8080 8274 8703 8703
Long Term Debt Less Current Maturities 0 0 0 0 0
Income Taxes Payable 0 0 0 0 0
Deferred Revenue 706 863 937 975 975
other Long Term Liabilities 0 0 0 0 0
Minority Interest 10 11 5 90 90
Shareholders' Equity:
Common Stock and Additional Paid-in Capital 21094 22302 22277 22450 22450
Retained Earnings/(Accumulated Deficit) 5955 4902 3489 3164 3164
Accumulated Other Comprehensive Income 370 432 215 212 212
Total Shareholders' Equity 27419 27636 25981 25826 25826
Total Liabilities and Shareholders' Equity 35850 36590 35197 35594 35594
Checksum 0 0 0 0 0
Oct-04 Jan-05 Apr-05 Jul-05 Oct-05 Jan-06 Apr-06 Jul-06
Q1 2005 A Q2 2005 A Q3 2005 A Q3 2005 A FY 2005 A Q1 2006 A Q2 2006 A Q3 2006 A Q4 2006 A
3309 2473 2641 4742 4742 1704 5151 4237 3297
3489 3291 2397 11313 11313 11786 9838 13946 14517
6798 5764 5038 16055 16055 13490 14989 18183 17814
1792 2278 2241 2216 2216 2342 2537 2980 3303
1210 1255 1280 1297 1297 1318 1345 1313 1371
1798 1881 1537 1475 1475 1410 1476 1484 1604
878 792 867 967 967 1193 1264 1527 1584
12476 11970 10963 22010 22010 19753 21611 25487 25676
3279 3302 3298 3320 3320 3335 3316 3479 3440
4535 4674 5063 5295 5295 5412 5422 9186 9227
399 396 459 549 549 548 510 2356 2161
2695 2722 3076 2709 2709 2707 2793 2574 2811
10929 10761 11111 0 0 0 0 0 0
0 0 0 0 0 0 0 0 0
34313 33825 33970 33883 33883 31755 33652 43082 43315
0 0 0 0 0 0 0 0 0
680 673 706 735 735 721 684 837 880
1161 1397 1418 1511 1511 1462 1437 1346 1744
1187 1219 1258 1317 1317 1193 1220 1431 1516
3291 3657 3800 3854 3854 3716 3937 4300 4408
2307 2126 2005 2094 2094 2144 2243 2516 2765
0 0 0 0 0 0 0 0 0
8626 9072 9187 9511 9511 9236 9521 10430 11313
0 0 0 0 0 0 0 6346 6332
0 0 0 0 0 0 0 0 0
970 990 1016 1188 1188 1078 1163 1188 1241
0 0 0 0 0 0 0 495 511
128 12 11 10 10 4 4 8 6
22151 22145 22450 22394 22394 22261 22907 24132 24257
2079 1245 1002 506 506 (1046) (268) 121 (617)
359 361 304 274 274 222 325 362 272
24589 23751 23756 23174 23174 21437 22964 24615 23912
34313 33825 33970 33883 33883 31755 33652 43082 43315
0 0 0 0 0 0 0 0 0
Oct-06 Jan-07 Apr-07 Jul-07 Oct-07 Jan-08 Apr-08
FY 2006 A Q1 2007 A Q2 2007 A Q3 2007 A Q4 2007 A FY 2007 A Q1 2008 A Q2 2008 A Q3 2008 A
3297 4313 2434 5457 3728 3728 4413 5202 6154
14517 15207 18247 16879 18538 18538 20266 17491 18279
17814 19520 20681 22336 22266 22266 24679 22693 24433
3303 3091 2908 3238 3989 3989 3418 4165 4183
1371 1477 1642 1289 1322 1322 1315 1267 1279
1604 1582 1673 1755 1953 1953 1916 2048 2078
1584 1581 1612 1922 2044 2044 2127 2269 2172
25676 27251 28516 30540 31574 31574 33455 32442 34145
3440 3444 3539 3695 3893 3893 3956 3973 4045
9227 9298 9318 9493 12121 12121 12158 12390 12419
2161 2065 1960 1909 2540 2540 2379 2338 2181
2811 2850 2921 3198 3212 3212 3754 4157 4333
0
0
43315 44908 46254 48835 53340 53340 55702 55300 57123
0 0 0 0 0 0 0 0 500
880 869 931 864 786 786 820 763 808
1744 1605 1330 1525 1740 1740 439 96 83
1516 1487 1589 1791 2019 2019 1920 1981 2320
4408 4546 4718 4854 5391 5391 5381 5786 6103
2765 2774 2923 2938 3422 3422 3660 3567 3545
0
11313 11281 11491 11972 13358 13358 12220 12193 13359
6332 6455 6416 6478 6408 6408 6582 6851 6415
0 0 0 0 0 0 682 791 1015
1241 1219 1343 1485 1646 1646 1726 2197 2487
511 410 414 373 438 438 489 375 646
6 14 8 9 10 10 131 81 63
24257 25419 27245 28411 30687 30687 32510 32773 32931
(617) (233) (1083) (457) 231 231 121 (1073) (843)
272 343 420 564 562 562 1241 1112 1050
23912 25529 26582 28518 31480 31480 33872 32812 33138
43315 44908 46254 48835 53340 53340 55702 55300 57123
0 0 0 0 0 0 0 0 0
9
Jul-08
Q4 2008 A FY 2008 A
5191 5191
21044 21044
26235 26235
3821 3821
1235 1235
2075 2075
2333 2333
35699 35699
4151 4151
12392 12392
2089 2089
4403 4403
58734 58734
500 500
869 869
107 107
2428 2428
6197 6197
3757 3757
13858 13858
6393 6393
749 749
2663 2663
669 669
49 49
0
33505 33505
120 120
728 728
34353 34353
58734 58734
0 0
CISCO Systems Inc.
Cash Flow Statement
(in $ millions, except per share/ADS data)
Oct-06 Jan-07
Q1 2007 A Q2 2007 A
YTD/QTD Cash Flow 3M 6M
Net Income 1608 3529
Adjustments
Depreciation and Amortization 348 690
Employee Share-Based Compensation 225 472
Stock Based Compensation Related to Acquisition 10 19
Provistion for Doubtful Accounts 6 0
Deferred Income Taxes 60 -66
Excess Tax Benefits from Share-Based Compensation -151 -428
In-Process Research and Development 4 6
Net Gains and Impairment Charges on Investments -48 -99
Change in Operating Asssets and Liabilities, Net of Effects of Acquisition:
Accounts Receivable 206 395
lease Receivables,net -22 -66
Inventories -106 -271
Prepaid Expenses and Other Current Assets -16 -39
Accounts Payable -11 51
Income Taxes Payable 48 104
Accrued Compensation -29 73
Deferred Revenue 116 412
Other Accrued Liabilities 23 147
Net Cash Provided by Operating Activities 2271 4929
Cash Flow from Investing Activities
Purchases of Investments -4771 -11184
Proceeds from Sales and Maturities of Investmens 4268 7762
Acquisition of Property and Equipment -214 -548
Acquisition of Businesses, Net of Cash and Cash Equivalents -121 -166
Change in Investment in Privately Held Companies -48 -76
Other -41 -27
Net Cash Used in Investing Activities -927 -4239
Cash Flows from Financing Activities
Issuance of Common Stock 1019 2779
Repruchase of Common Stock -1500 -4781
Proceeds from the Termination of Interest Rate Swaps 0 0
Excess Tax Benefits from Share-Based Compensation 151 428
Other 2 21
Net Cash Used in Financing Activities -328 -1553
Net Increase in Cash and Cash Equivalents 1016 -863
Cash and Cash Equivalents, Beginning of Fiscal year 3297 3297
Cash and Cash Equivalents, End of Fiscal year 4313 2434
Checksum 0 0
Apr-07 Jul-07 Oct-07 Jan-08 Apr-08 Jul-08
Q3 2007 A Q4 2007 A Q1 2008 A Q2 2008 A Q3 208 A Q4 2008 A
9M 12M 3M 6M 9M 12M
5403 7333 2205 4265 6038 8052
1039 1413 421 878 1314 1744
709 931 226 499 767 1025
27 34 24 45 67 87
6 6 18 29 34 34
-302 -622 -491 -632 -876 -772
-648 -918 -252 -338 -375 -413
7 81 3 3 3 3
-154 -210 -54 -104 -109 -103
60 -597 554 -196 -219 171
82 -156 -127 -260 54 -488
-131 61 7 66 -320 104
-17 -452 81 38 12 -361
535 -107 32 -33 405 62
275 1104 394 220 301 178
690 479 -99 -38 1553 351
-355 1293 70 946 -357 1812
140 431 77 144 268 603
7366 10104 3089 5532 8560 12089
-15342 -20532 -4360 -7846 -14093 -22399
13438 17368 3526 9453 14761 19990
-912 -1251 -296 -591 -908 -1268
-387 -3684 -45 -385 -385 -398
-81 -92 -20 -55 -63 -101
-87 -151 -65 -111 6 -17
-3371 -8342 -1260 465 -682 -4193
3719 5306 1539 2165 2501 3117
-6281 -7681 -2993 -7120 -8982 -10441
0 0 0 0 432 432
648 918 252 338 375 413
79 126 58 94 222 46
-1835 -1331 -1144 -4523 -5452 -6433
2160 431 685 1474 2426 1463
3297 3297 3728 3728 3728 3728
5457 3728 4413 5202 6154 5191
0 0 0 0 0 0

Más contenido relacionado

La actualidad más candente

Equity report 26 feb 2018
Equity  report 26 feb 2018Equity  report 26 feb 2018
Equity report 26 feb 2018heena khaan
 
Financial accounting comparison of various companies
Financial accounting comparison of various companiesFinancial accounting comparison of various companies
Financial accounting comparison of various companiesShashwat Shankar
 
Pakistan Tax Directory Data Analysis
Pakistan Tax Directory Data AnalysisPakistan Tax Directory Data Analysis
Pakistan Tax Directory Data AnalysisAshar Ahmed
 
28.05.2012, Staggering costs of inefficient regulation in Mongolia, Olin McGill
28.05.2012, Staggering costs of inefficient regulation in Mongolia, Olin McGill 28.05.2012, Staggering costs of inefficient regulation in Mongolia, Olin McGill
28.05.2012, Staggering costs of inefficient regulation in Mongolia, Olin McGill The Business Council of Mongolia
 
Agnee helical-bevel-gear-box-capacity-details
Agnee helical-bevel-gear-box-capacity-detailsAgnee helical-bevel-gear-box-capacity-details
Agnee helical-bevel-gear-box-capacity-detailsPrasanta Tripathy
 
Hcad calculation guidelines 2016
Hcad calculation guidelines 2016Hcad calculation guidelines 2016
Hcad calculation guidelines 2016cutmytaxes
 
Local panel presentation #4 strathroy caradoc skilled trades program
Local panel presentation #4 strathroy caradoc skilled trades programLocal panel presentation #4 strathroy caradoc skilled trades program
Local panel presentation #4 strathroy caradoc skilled trades programREDB_East
 
77389 Home Sales Report June 2015
77389 Home Sales Report June 201577389 Home Sales Report June 2015
77389 Home Sales Report June 2015Ken Brand
 

La actualidad más candente (14)

Equity report 26 feb 2018
Equity  report 26 feb 2018Equity  report 26 feb 2018
Equity report 26 feb 2018
 
Equity Research Report 27 August 2018 Ways2Capital
Equity Research Report  27 August 2018 Ways2CapitalEquity Research Report  27 August 2018 Ways2Capital
Equity Research Report 27 August 2018 Ways2Capital
 
Financial accounting comparison of various companies
Financial accounting comparison of various companiesFinancial accounting comparison of various companies
Financial accounting comparison of various companies
 
April 2018 Real Estate Update
April 2018 Real Estate UpdateApril 2018 Real Estate Update
April 2018 Real Estate Update
 
Pakistan Tax Directory Data Analysis
Pakistan Tax Directory Data AnalysisPakistan Tax Directory Data Analysis
Pakistan Tax Directory Data Analysis
 
28.05.2012, Staggering costs of inefficient regulation in Mongolia, Olin McGill
28.05.2012, Staggering costs of inefficient regulation in Mongolia, Olin McGill 28.05.2012, Staggering costs of inefficient regulation in Mongolia, Olin McGill
28.05.2012, Staggering costs of inefficient regulation in Mongolia, Olin McGill
 
Agnee helical-bevel-gear-box-capacity-details
Agnee helical-bevel-gear-box-capacity-detailsAgnee helical-bevel-gear-box-capacity-details
Agnee helical-bevel-gear-box-capacity-details
 
p&l 2015 pasqua
p&l 2015 pasquap&l 2015 pasqua
p&l 2015 pasqua
 
Equity research report 05 march 2018 ways2 capital
Equity research report 05 march 2018 ways2 capitalEquity research report 05 march 2018 ways2 capital
Equity research report 05 march 2018 ways2 capital
 
Equity Research Report 09 April 2018 Ways2Capital
Equity Research Report 09 April  2018 Ways2CapitalEquity Research Report 09 April  2018 Ways2Capital
Equity Research Report 09 April 2018 Ways2Capital
 
Calculo de esal
Calculo de esalCalculo de esal
Calculo de esal
 
Hcad calculation guidelines 2016
Hcad calculation guidelines 2016Hcad calculation guidelines 2016
Hcad calculation guidelines 2016
 
Local panel presentation #4 strathroy caradoc skilled trades program
Local panel presentation #4 strathroy caradoc skilled trades programLocal panel presentation #4 strathroy caradoc skilled trades program
Local panel presentation #4 strathroy caradoc skilled trades program
 
77389 Home Sales Report June 2015
77389 Home Sales Report June 201577389 Home Sales Report June 2015
77389 Home Sales Report June 2015
 

Destacado

Monthly Market Update for Sarasota and Manatee Counties December 2014
Monthly Market Update for Sarasota and Manatee Counties December 2014Monthly Market Update for Sarasota and Manatee Counties December 2014
Monthly Market Update for Sarasota and Manatee Counties December 2014Bryan Guentner
 
Management Supplementary Lecture 1 by Minura Jinadasa
Management Supplementary Lecture 1 by Minura JinadasaManagement Supplementary Lecture 1 by Minura Jinadasa
Management Supplementary Lecture 1 by Minura JinadasaMinura Jinadasa
 
Monthly market update for Sarasota and Manatee County January 2015
Monthly market update for Sarasota and Manatee County January 2015Monthly market update for Sarasota and Manatee County January 2015
Monthly market update for Sarasota and Manatee County January 2015Bryan Guentner
 
Sarasota Florida Relocation Information
Sarasota Florida Relocation InformationSarasota Florida Relocation Information
Sarasota Florida Relocation InformationBryan Guentner
 
Management Supplementary Lecture 2 by Minura Jinadasa)
Management Supplementary Lecture 2 by Minura Jinadasa)Management Supplementary Lecture 2 by Minura Jinadasa)
Management Supplementary Lecture 2 by Minura Jinadasa)Minura Jinadasa
 
Extra Terestrial Life (Modified by Minura)
Extra Terestrial Life (Modified by Minura)Extra Terestrial Life (Modified by Minura)
Extra Terestrial Life (Modified by Minura)Minura Jinadasa
 
Biz techsolinc
Biz techsolincBiz techsolinc
Biz techsolincShankar Al
 
Biz Tech Sol Inc
Biz Tech Sol IncBiz Tech Sol Inc
Biz Tech Sol IncShankar Al
 
Quarterly Market Update Sarasota Stats 2010
Quarterly Market Update Sarasota Stats 2010Quarterly Market Update Sarasota Stats 2010
Quarterly Market Update Sarasota Stats 2010Bryan Guentner
 
Monthly market update for Sarasota November 2010 October stats
Monthly market update for Sarasota November 2010 October statsMonthly market update for Sarasota November 2010 October stats
Monthly market update for Sarasota November 2010 October statsBryan Guentner
 
Management Group Assignment
Management Group AssignmentManagement Group Assignment
Management Group AssignmentMinura Jinadasa
 
UCSC ISACA Student Goup - Recruitment Nov 2015 - Introductory Presentation
UCSC ISACA Student Goup - Recruitment Nov 2015 - Introductory PresentationUCSC ISACA Student Goup - Recruitment Nov 2015 - Introductory Presentation
UCSC ISACA Student Goup - Recruitment Nov 2015 - Introductory PresentationMinura Jinadasa
 
Sri Lanka & The Royal College of Sri Lanka
Sri Lanka & The Royal College of Sri LankaSri Lanka & The Royal College of Sri Lanka
Sri Lanka & The Royal College of Sri LankaMinura Jinadasa
 
IS 1008 Enhancement 1-English
IS 1008 Enhancement 1-EnglishIS 1008 Enhancement 1-English
IS 1008 Enhancement 1-EnglishMinura Jinadasa
 
Cleaner Production Assessment-(Improved by Minura)
Cleaner Production Assessment-(Improved by Minura)Cleaner Production Assessment-(Improved by Minura)
Cleaner Production Assessment-(Improved by Minura)Minura Jinadasa
 
Monthly Market Update for Sarasota and Manatee Counties September 2010
Monthly Market Update for Sarasota and Manatee Counties September 2010Monthly Market Update for Sarasota and Manatee Counties September 2010
Monthly Market Update for Sarasota and Manatee Counties September 2010Bryan Guentner
 

Destacado (19)

Monthly Market Update for Sarasota and Manatee Counties December 2014
Monthly Market Update for Sarasota and Manatee Counties December 2014Monthly Market Update for Sarasota and Manatee Counties December 2014
Monthly Market Update for Sarasota and Manatee Counties December 2014
 
Management Supplementary Lecture 1 by Minura Jinadasa
Management Supplementary Lecture 1 by Minura JinadasaManagement Supplementary Lecture 1 by Minura Jinadasa
Management Supplementary Lecture 1 by Minura Jinadasa
 
Monthly market update for Sarasota and Manatee County January 2015
Monthly market update for Sarasota and Manatee County January 2015Monthly market update for Sarasota and Manatee County January 2015
Monthly market update for Sarasota and Manatee County January 2015
 
Khadarlis for Sierra Leone
Khadarlis for Sierra LeoneKhadarlis for Sierra Leone
Khadarlis for Sierra Leone
 
Sarasota Florida Relocation Information
Sarasota Florida Relocation InformationSarasota Florida Relocation Information
Sarasota Florida Relocation Information
 
Management Supplementary Lecture 2 by Minura Jinadasa)
Management Supplementary Lecture 2 by Minura Jinadasa)Management Supplementary Lecture 2 by Minura Jinadasa)
Management Supplementary Lecture 2 by Minura Jinadasa)
 
Extra Terestrial Life (Modified by Minura)
Extra Terestrial Life (Modified by Minura)Extra Terestrial Life (Modified by Minura)
Extra Terestrial Life (Modified by Minura)
 
Biz techsolinc
Biz techsolincBiz techsolinc
Biz techsolinc
 
Biz Tech Sol Inc
Biz Tech Sol IncBiz Tech Sol Inc
Biz Tech Sol Inc
 
Quarterly Market Update Sarasota Stats 2010
Quarterly Market Update Sarasota Stats 2010Quarterly Market Update Sarasota Stats 2010
Quarterly Market Update Sarasota Stats 2010
 
Monthly market update for Sarasota November 2010 October stats
Monthly market update for Sarasota November 2010 October statsMonthly market update for Sarasota November 2010 October stats
Monthly market update for Sarasota November 2010 October stats
 
Management Group Assignment
Management Group AssignmentManagement Group Assignment
Management Group Assignment
 
UCSC ISACA Student Goup - Recruitment Nov 2015 - Introductory Presentation
UCSC ISACA Student Goup - Recruitment Nov 2015 - Introductory PresentationUCSC ISACA Student Goup - Recruitment Nov 2015 - Introductory Presentation
UCSC ISACA Student Goup - Recruitment Nov 2015 - Introductory Presentation
 
Enhancing Vision
Enhancing VisionEnhancing Vision
Enhancing Vision
 
Sri Lanka & The Royal College of Sri Lanka
Sri Lanka & The Royal College of Sri LankaSri Lanka & The Royal College of Sri Lanka
Sri Lanka & The Royal College of Sri Lanka
 
Khadarlis
Khadarlis Khadarlis
Khadarlis
 
IS 1008 Enhancement 1-English
IS 1008 Enhancement 1-EnglishIS 1008 Enhancement 1-English
IS 1008 Enhancement 1-English
 
Cleaner Production Assessment-(Improved by Minura)
Cleaner Production Assessment-(Improved by Minura)Cleaner Production Assessment-(Improved by Minura)
Cleaner Production Assessment-(Improved by Minura)
 
Monthly Market Update for Sarasota and Manatee Counties September 2010
Monthly Market Update for Sarasota and Manatee Counties September 2010Monthly Market Update for Sarasota and Manatee Counties September 2010
Monthly Market Update for Sarasota and Manatee Counties September 2010
 

Similar a Cisco Systems Excel Workbook

Valuation of Indian hospitality industry
Valuation of Indian hospitality industryValuation of Indian hospitality industry
Valuation of Indian hospitality industryShivani Chaluvadi
 
Matemática financeira 6 tabelas financeiras de alto nível - by prof. shibat...
Matemática financeira   6 tabelas financeiras de alto nível - by prof. shibat...Matemática financeira   6 tabelas financeiras de alto nível - by prof. shibat...
Matemática financeira 6 tabelas financeiras de alto nível - by prof. shibat...prof. Renan Viana
 
Financial management VN
Financial management VNFinancial management VN
Financial management VNTài Đinh
 
July 2017 Real Estate Update, A Market Report for The Woodland, TX
July 2017 Real Estate Update, A Market Report for The Woodland, TXJuly 2017 Real Estate Update, A Market Report for The Woodland, TX
July 2017 Real Estate Update, A Market Report for The Woodland, TXReferred Realty Group
 
October 2015 Real Estate Market Report, The Woodlands, TX
October 2015 Real Estate Market Report, The Woodlands, TXOctober 2015 Real Estate Market Report, The Woodlands, TX
October 2015 Real Estate Market Report, The Woodlands, TXReferred Realty Group
 
September 2015 Real Estate Market Report, The Woodlands, TX
September 2015 Real Estate Market Report, The Woodlands, TXSeptember 2015 Real Estate Market Report, The Woodlands, TX
September 2015 Real Estate Market Report, The Woodlands, TXReferred Realty Group
 
Sample Calculations for solar rooftop project in India
Sample Calculations for solar rooftop project in IndiaSample Calculations for solar rooftop project in India
Sample Calculations for solar rooftop project in Indiadisruptiveenergy
 
ROTEX Controls ECV Rack and Pinion Industrial Valve Pneumatic Actuator
ROTEX Controls ECV Rack and Pinion Industrial Valve Pneumatic ActuatorROTEX Controls ECV Rack and Pinion Industrial Valve Pneumatic Actuator
ROTEX Controls ECV Rack and Pinion Industrial Valve Pneumatic ActuatorROTEX Controls USA
 
New Frontiers in the Political Economy of Minerals & Hydrocarbons: Section III
New Frontiers in the Political Economy of Minerals & Hydrocarbons: Section IIINew Frontiers in the Political Economy of Minerals & Hydrocarbons: Section III
New Frontiers in the Political Economy of Minerals & Hydrocarbons: Section IIIGraciela Chichilnisky
 
Tej vardhan sail_valuation
Tej vardhan sail_valuationTej vardhan sail_valuation
Tej vardhan sail_valuationTej vardhan
 
July 2015 Market Reports for The Woodlands
July 2015 Market Reports for The WoodlandsJuly 2015 Market Reports for The Woodlands
July 2015 Market Reports for The WoodlandsReferred Realty Group
 
July 2015 Real Estate Market Report, The Woodlands, TX
July 2015 Real Estate Market Report, The Woodlands, TXJuly 2015 Real Estate Market Report, The Woodlands, TX
July 2015 Real Estate Market Report, The Woodlands, TXmsullymarkel
 
Turkish Airlines
Turkish AirlinesTurkish Airlines
Turkish AirlinesErman Demir
 
August 2017 Real Estate Update, The Woodlands, TX
August 2017 Real Estate Update, The Woodlands, TXAugust 2017 Real Estate Update, The Woodlands, TX
August 2017 Real Estate Update, The Woodlands, TXReferred Realty Group
 

Similar a Cisco Systems Excel Workbook (20)

Valuation of Indian hospitality industry
Valuation of Indian hospitality industryValuation of Indian hospitality industry
Valuation of Indian hospitality industry
 
Statistics about potato production in Turkey 1.pdf
Statistics about potato production in Turkey 1.pdfStatistics about potato production in Turkey 1.pdf
Statistics about potato production in Turkey 1.pdf
 
Pneumatic Rack and Pinion Valve Actuators
Pneumatic Rack and Pinion Valve ActuatorsPneumatic Rack and Pinion Valve Actuators
Pneumatic Rack and Pinion Valve Actuators
 
Matemática financeira 6 tabelas financeiras de alto nível - by prof. shibat...
Matemática financeira   6 tabelas financeiras de alto nível - by prof. shibat...Matemática financeira   6 tabelas financeiras de alto nível - by prof. shibat...
Matemática financeira 6 tabelas financeiras de alto nível - by prof. shibat...
 
Financial management VN
Financial management VNFinancial management VN
Financial management VN
 
Equity report by ways2 capital 11 aug 2014
Equity report by ways2 capital 11 aug 2014Equity report by ways2 capital 11 aug 2014
Equity report by ways2 capital 11 aug 2014
 
SOHO Package Analysis
SOHO Package AnalysisSOHO Package Analysis
SOHO Package Analysis
 
July 2017 Real Estate Update, A Market Report for The Woodland, TX
July 2017 Real Estate Update, A Market Report for The Woodland, TXJuly 2017 Real Estate Update, A Market Report for The Woodland, TX
July 2017 Real Estate Update, A Market Report for The Woodland, TX
 
NSUT Round 5 Cutoff.pdf
NSUT Round 5 Cutoff.pdfNSUT Round 5 Cutoff.pdf
NSUT Round 5 Cutoff.pdf
 
120981064 new-doll
120981064 new-doll120981064 new-doll
120981064 new-doll
 
October 2015 Real Estate Market Report, The Woodlands, TX
October 2015 Real Estate Market Report, The Woodlands, TXOctober 2015 Real Estate Market Report, The Woodlands, TX
October 2015 Real Estate Market Report, The Woodlands, TX
 
September 2015 Real Estate Market Report, The Woodlands, TX
September 2015 Real Estate Market Report, The Woodlands, TXSeptember 2015 Real Estate Market Report, The Woodlands, TX
September 2015 Real Estate Market Report, The Woodlands, TX
 
Sample Calculations for solar rooftop project in India
Sample Calculations for solar rooftop project in IndiaSample Calculations for solar rooftop project in India
Sample Calculations for solar rooftop project in India
 
ROTEX Controls ECV Rack and Pinion Industrial Valve Pneumatic Actuator
ROTEX Controls ECV Rack and Pinion Industrial Valve Pneumatic ActuatorROTEX Controls ECV Rack and Pinion Industrial Valve Pneumatic Actuator
ROTEX Controls ECV Rack and Pinion Industrial Valve Pneumatic Actuator
 
New Frontiers in the Political Economy of Minerals & Hydrocarbons: Section III
New Frontiers in the Political Economy of Minerals & Hydrocarbons: Section IIINew Frontiers in the Political Economy of Minerals & Hydrocarbons: Section III
New Frontiers in the Political Economy of Minerals & Hydrocarbons: Section III
 
Tej vardhan sail_valuation
Tej vardhan sail_valuationTej vardhan sail_valuation
Tej vardhan sail_valuation
 
July 2015 Market Reports for The Woodlands
July 2015 Market Reports for The WoodlandsJuly 2015 Market Reports for The Woodlands
July 2015 Market Reports for The Woodlands
 
July 2015 Real Estate Market Report, The Woodlands, TX
July 2015 Real Estate Market Report, The Woodlands, TXJuly 2015 Real Estate Market Report, The Woodlands, TX
July 2015 Real Estate Market Report, The Woodlands, TX
 
Turkish Airlines
Turkish AirlinesTurkish Airlines
Turkish Airlines
 
August 2017 Real Estate Update, The Woodlands, TX
August 2017 Real Estate Update, The Woodlands, TXAugust 2017 Real Estate Update, The Woodlands, TX
August 2017 Real Estate Update, The Woodlands, TX
 

Último

Artificial intelligence in cctv survelliance.pptx
Artificial intelligence in cctv survelliance.pptxArtificial intelligence in cctv survelliance.pptx
Artificial intelligence in cctv survelliance.pptxhariprasad279825
 
SAP Build Work Zone - Overview L2-L3.pptx
SAP Build Work Zone - Overview L2-L3.pptxSAP Build Work Zone - Overview L2-L3.pptx
SAP Build Work Zone - Overview L2-L3.pptxNavinnSomaal
 
Take control of your SAP testing with UiPath Test Suite
Take control of your SAP testing with UiPath Test SuiteTake control of your SAP testing with UiPath Test Suite
Take control of your SAP testing with UiPath Test SuiteDianaGray10
 
DevEX - reference for building teams, processes, and platforms
DevEX - reference for building teams, processes, and platformsDevEX - reference for building teams, processes, and platforms
DevEX - reference for building teams, processes, and platformsSergiu Bodiu
 
Connect Wave/ connectwave Pitch Deck Presentation
Connect Wave/ connectwave Pitch Deck PresentationConnect Wave/ connectwave Pitch Deck Presentation
Connect Wave/ connectwave Pitch Deck PresentationSlibray Presentation
 
What's New in Teams Calling, Meetings and Devices March 2024
What's New in Teams Calling, Meetings and Devices March 2024What's New in Teams Calling, Meetings and Devices March 2024
What's New in Teams Calling, Meetings and Devices March 2024Stephanie Beckett
 
Developer Data Modeling Mistakes: From Postgres to NoSQL
Developer Data Modeling Mistakes: From Postgres to NoSQLDeveloper Data Modeling Mistakes: From Postgres to NoSQL
Developer Data Modeling Mistakes: From Postgres to NoSQLScyllaDB
 
H2O.ai CEO/Founder: Sri Ambati Keynote at Wells Fargo Day
H2O.ai CEO/Founder: Sri Ambati Keynote at Wells Fargo DayH2O.ai CEO/Founder: Sri Ambati Keynote at Wells Fargo Day
H2O.ai CEO/Founder: Sri Ambati Keynote at Wells Fargo DaySri Ambati
 
Are Multi-Cloud and Serverless Good or Bad?
Are Multi-Cloud and Serverless Good or Bad?Are Multi-Cloud and Serverless Good or Bad?
Are Multi-Cloud and Serverless Good or Bad?Mattias Andersson
 
Hyperautomation and AI/ML: A Strategy for Digital Transformation Success.pdf
Hyperautomation and AI/ML: A Strategy for Digital Transformation Success.pdfHyperautomation and AI/ML: A Strategy for Digital Transformation Success.pdf
Hyperautomation and AI/ML: A Strategy for Digital Transformation Success.pdfPrecisely
 
Streamlining Python Development: A Guide to a Modern Project Setup
Streamlining Python Development: A Guide to a Modern Project SetupStreamlining Python Development: A Guide to a Modern Project Setup
Streamlining Python Development: A Guide to a Modern Project SetupFlorian Wilhelm
 
From Family Reminiscence to Scholarly Archive .
From Family Reminiscence to Scholarly Archive .From Family Reminiscence to Scholarly Archive .
From Family Reminiscence to Scholarly Archive .Alan Dix
 
Merck Moving Beyond Passwords: FIDO Paris Seminar.pptx
Merck Moving Beyond Passwords: FIDO Paris Seminar.pptxMerck Moving Beyond Passwords: FIDO Paris Seminar.pptx
Merck Moving Beyond Passwords: FIDO Paris Seminar.pptxLoriGlavin3
 
New from BookNet Canada for 2024: BNC CataList - Tech Forum 2024
New from BookNet Canada for 2024: BNC CataList - Tech Forum 2024New from BookNet Canada for 2024: BNC CataList - Tech Forum 2024
New from BookNet Canada for 2024: BNC CataList - Tech Forum 2024BookNet Canada
 
The Ultimate Guide to Choosing WordPress Pros and Cons
The Ultimate Guide to Choosing WordPress Pros and ConsThe Ultimate Guide to Choosing WordPress Pros and Cons
The Ultimate Guide to Choosing WordPress Pros and ConsPixlogix Infotech
 
How to write a Business Continuity Plan
How to write a Business Continuity PlanHow to write a Business Continuity Plan
How to write a Business Continuity PlanDatabarracks
 
Tampa BSides - Chef's Tour of Microsoft Security Adoption Framework (SAF)
Tampa BSides - Chef's Tour of Microsoft Security Adoption Framework (SAF)Tampa BSides - Chef's Tour of Microsoft Security Adoption Framework (SAF)
Tampa BSides - Chef's Tour of Microsoft Security Adoption Framework (SAF)Mark Simos
 
Scanning the Internet for External Cloud Exposures via SSL Certs
Scanning the Internet for External Cloud Exposures via SSL CertsScanning the Internet for External Cloud Exposures via SSL Certs
Scanning the Internet for External Cloud Exposures via SSL CertsRizwan Syed
 
Nell’iperspazio con Rocket: il Framework Web di Rust!
Nell’iperspazio con Rocket: il Framework Web di Rust!Nell’iperspazio con Rocket: il Framework Web di Rust!
Nell’iperspazio con Rocket: il Framework Web di Rust!Commit University
 
Human Factors of XR: Using Human Factors to Design XR Systems
Human Factors of XR: Using Human Factors to Design XR SystemsHuman Factors of XR: Using Human Factors to Design XR Systems
Human Factors of XR: Using Human Factors to Design XR SystemsMark Billinghurst
 

Último (20)

Artificial intelligence in cctv survelliance.pptx
Artificial intelligence in cctv survelliance.pptxArtificial intelligence in cctv survelliance.pptx
Artificial intelligence in cctv survelliance.pptx
 
SAP Build Work Zone - Overview L2-L3.pptx
SAP Build Work Zone - Overview L2-L3.pptxSAP Build Work Zone - Overview L2-L3.pptx
SAP Build Work Zone - Overview L2-L3.pptx
 
Take control of your SAP testing with UiPath Test Suite
Take control of your SAP testing with UiPath Test SuiteTake control of your SAP testing with UiPath Test Suite
Take control of your SAP testing with UiPath Test Suite
 
DevEX - reference for building teams, processes, and platforms
DevEX - reference for building teams, processes, and platformsDevEX - reference for building teams, processes, and platforms
DevEX - reference for building teams, processes, and platforms
 
Connect Wave/ connectwave Pitch Deck Presentation
Connect Wave/ connectwave Pitch Deck PresentationConnect Wave/ connectwave Pitch Deck Presentation
Connect Wave/ connectwave Pitch Deck Presentation
 
What's New in Teams Calling, Meetings and Devices March 2024
What's New in Teams Calling, Meetings and Devices March 2024What's New in Teams Calling, Meetings and Devices March 2024
What's New in Teams Calling, Meetings and Devices March 2024
 
Developer Data Modeling Mistakes: From Postgres to NoSQL
Developer Data Modeling Mistakes: From Postgres to NoSQLDeveloper Data Modeling Mistakes: From Postgres to NoSQL
Developer Data Modeling Mistakes: From Postgres to NoSQL
 
H2O.ai CEO/Founder: Sri Ambati Keynote at Wells Fargo Day
H2O.ai CEO/Founder: Sri Ambati Keynote at Wells Fargo DayH2O.ai CEO/Founder: Sri Ambati Keynote at Wells Fargo Day
H2O.ai CEO/Founder: Sri Ambati Keynote at Wells Fargo Day
 
Are Multi-Cloud and Serverless Good or Bad?
Are Multi-Cloud and Serverless Good or Bad?Are Multi-Cloud and Serverless Good or Bad?
Are Multi-Cloud and Serverless Good or Bad?
 
Hyperautomation and AI/ML: A Strategy for Digital Transformation Success.pdf
Hyperautomation and AI/ML: A Strategy for Digital Transformation Success.pdfHyperautomation and AI/ML: A Strategy for Digital Transformation Success.pdf
Hyperautomation and AI/ML: A Strategy for Digital Transformation Success.pdf
 
Streamlining Python Development: A Guide to a Modern Project Setup
Streamlining Python Development: A Guide to a Modern Project SetupStreamlining Python Development: A Guide to a Modern Project Setup
Streamlining Python Development: A Guide to a Modern Project Setup
 
From Family Reminiscence to Scholarly Archive .
From Family Reminiscence to Scholarly Archive .From Family Reminiscence to Scholarly Archive .
From Family Reminiscence to Scholarly Archive .
 
Merck Moving Beyond Passwords: FIDO Paris Seminar.pptx
Merck Moving Beyond Passwords: FIDO Paris Seminar.pptxMerck Moving Beyond Passwords: FIDO Paris Seminar.pptx
Merck Moving Beyond Passwords: FIDO Paris Seminar.pptx
 
New from BookNet Canada for 2024: BNC CataList - Tech Forum 2024
New from BookNet Canada for 2024: BNC CataList - Tech Forum 2024New from BookNet Canada for 2024: BNC CataList - Tech Forum 2024
New from BookNet Canada for 2024: BNC CataList - Tech Forum 2024
 
The Ultimate Guide to Choosing WordPress Pros and Cons
The Ultimate Guide to Choosing WordPress Pros and ConsThe Ultimate Guide to Choosing WordPress Pros and Cons
The Ultimate Guide to Choosing WordPress Pros and Cons
 
How to write a Business Continuity Plan
How to write a Business Continuity PlanHow to write a Business Continuity Plan
How to write a Business Continuity Plan
 
Tampa BSides - Chef's Tour of Microsoft Security Adoption Framework (SAF)
Tampa BSides - Chef's Tour of Microsoft Security Adoption Framework (SAF)Tampa BSides - Chef's Tour of Microsoft Security Adoption Framework (SAF)
Tampa BSides - Chef's Tour of Microsoft Security Adoption Framework (SAF)
 
Scanning the Internet for External Cloud Exposures via SSL Certs
Scanning the Internet for External Cloud Exposures via SSL CertsScanning the Internet for External Cloud Exposures via SSL Certs
Scanning the Internet for External Cloud Exposures via SSL Certs
 
Nell’iperspazio con Rocket: il Framework Web di Rust!
Nell’iperspazio con Rocket: il Framework Web di Rust!Nell’iperspazio con Rocket: il Framework Web di Rust!
Nell’iperspazio con Rocket: il Framework Web di Rust!
 
Human Factors of XR: Using Human Factors to Design XR Systems
Human Factors of XR: Using Human Factors to Design XR SystemsHuman Factors of XR: Using Human Factors to Design XR Systems
Human Factors of XR: Using Human Factors to Design XR Systems
 

Cisco Systems Excel Workbook

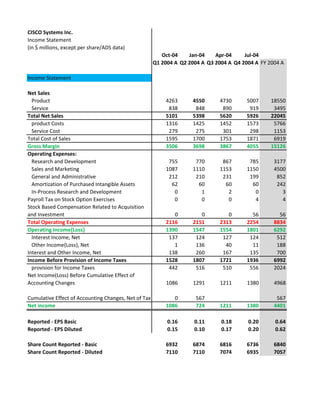
  • 1. CISCO Systems Inc. Income Statement (in $ millions, except per share/ADS data) Oct-04 Jan-04 Apr-04 Jul-04 Q1 2004 A Q2 2004 A Q3 2004 A Q4 2004 A FY 2004 A Income Statement Net Sales Product 4263 4550 4730 5007 18550 Service 838 848 890 919 3495 Total Net Sales 5101 5398 5620 5926 22045 product Costs 1316 1425 1452 1573 5766 Service Cost 279 275 301 298 1153 Total Cost of Sales 1595 1700 1753 1871 6919 Gross Margin 3506 3698 3867 4055 15126 Operating Expenses: Research and Development 755 770 867 785 3177 Sales and Marketing 1087 1110 1153 1150 4500 General and Administrative 212 210 231 199 852 Amortization of Purchased Intangible Assets 62 60 60 60 242 In-Process Research and Development 0 1 2 0 3 Payroll Tax on Stock Option Exercises 0 0 0 4 4 Stock Based Compensation Related to Acquisition and Investment 0 0 0 56 56 Total Operating Expenses 2116 2151 2313 2254 8834 Operating Income{Loss} 1390 1547 1554 1801 6292 Interest Income, Net 137 124 127 124 512 Other Income{Loss}, Net 1 136 40 11 188 Interest and Other Income, Net 138 260 167 135 700 Income Before Provision of Income Taxes 1528 1807 1721 1936 6992 provision for Income Taxes 442 516 510 556 2024 Net Income(Loss) Before Cumulative Effect of Accounting Changes 1086 1291 1211 1380 4968 Cumulative Effect of Accounting Changes, Net of Tax 0 567 567 Net income 1086 724 1211 1380 4401 Reported - EPS Basic 0.16 0.11 0.18 0.20 0.64 Reported - EPS Diluted 0.15 0.10 0.17 0.20 0.62 Share Count Reported - Basic 6932 6874 6816 6736 6840 Share Count Reported - Diluted 7110 7110 7074 6935 7057
  • 2. Oct-04 Jan-05 Apr-05 Jul-05 Oct-05 Jan-06 Apr-06 Jul-06 Q1 2005 A Q2 2005 A Q3 2005 A Q4 2005 A Fy 2005 A Q1 2006 A Q2 2006 A Q3 2006 A Q4 2006 A 5033 5106 5189 5525 20853 5491 5537 6155 6734 938 956 998 1056 3948 1059 1091 1167 1250 5971 6062 6187 6581 24801 6550 6628 7322 7984 1646 1669 1697 1746 6758 1751 1774 2193 2396 310 340 355 367 1372 389 388 403 443 1956 2009 2052 2113 8130 2140 2162 2596 2839 4015 4053 4135 4468 16671 4410 4466 4726 5145 805 811 823 883 3322 996 966 1041 1064 1120 1142 1190 1269 4721 1453 1431 1547 1600 230 228 244 257 959 278 282 298 311 60 57 54 56 227 59 56 99 179 12 2 6 6 26 2 0 88 1 2227 2240 2317 2471 9255 2788 2735 3073 3155 1788 1813 1818 1997 7416 1622 1731 1653 1990 130 127 142 153 552 154 168 142 143 40 17 8 3 68 -17 17 17 13 170 144 150 156 620 137 185 159 156 1958 1957 1968 2153 8036 1759 1916 1812 2146 562 557 563 613 2295 498 541 412 602 1396 1400 1405 1540 5741 1261 1375 1400 1544 0.21 0.21 0.22 0.24 0.89$ $0.20 $0.22 $0.23 $0.25 0.21 0.21 0.21 0.24 0.87$ $0.20 $0.22 $0.22 $0.25 6635 6521 6435 6366 6487 6245 6146 6160 6081 6773 6652 6541 6480 6612 6340 6248 6289 6187
  • 3. Oct-06 Jan-07 Apr-07 Jul-07 Oct-07 Jan-08 Apr-08 Fy 2006 A Q1 2007 A Q2 2007 A Q3 2007 A Q4 2007 A FY 2007 A Q1 2008 A Q2 2008 A Q3 2008 A 23917 6940 7099 7481 7942 29462 8015 8245 8199 4567 1244 1340 1385 1491 5460 1539 1586 1592 28484 8184 8439 8866 9433 34922 9554 9831 9791 8114 2499 2544 2685 2820 10548 2823 2882 2865 1623 452 507 534 545 2038 558 609 621 9737 2951 3051 3219 3365 12586 3381 3491 3486 18747 5233 5388 5647 6068 22336 6173 6340 6305 4067 1083 1094 1144 1178 4499 1192 1216 1439 6031 1686 1726 1830 1973 7215 2003 2084 2129 1169 364 340 378 431 1513 490 520 479 393 105 96 97 109 407 117 116 117 91 4 2 1 74 81 3 0 0 11751 3242 3258 3450 3765 13715 3805 3936 4164 6996 1991 2130 2197 2303 8621 2368 2404 2141 607 157 172 189 197 715 223 212 201 30 28 33 33 31 125 31 22 -33 637 185 205 222 228 840 254 234 168 7633 2176 2335 2419 2531 9461 2622 2638 2309 2053 568 414 545 601 2128 417 578 536 5580 1608 1921 1874 1930 7333 2205 2060 1773 0.91$ $0.27 $0.32 $0.31 $0.32 $1.21 $0.36 $0.34 $0.30 0.89$ $0.26 $0.31 $0.30 $0.31 $1.17 $0.35 $0.33 $0.29 6158 6061 6057 6034 6062 6055 6087 6010 5942 6272 6199 6291 6244 6275 6265 6330 6202 6069
  • 4. Jul-08 Q4 2008 A FY 2008 A 8640 33099 1724 6441 10364 39540 3061 11631 637 2425 3698 14056 6666 25484 1306 5153 2164 8380 518 2007 149 499 0 3 4137 16042 2529 9442 188 824 -31 -11 157 813 2686 10255 672 2203 2014 8052 $0.34 $1.35 $0.33 $1.31 5898 5986 6034 6163
  • 5. CISCO Systems Inc. Balance Sheet (in $ millions, except per share/ADS data) Oct-03 Jan-04 Apr-04 Jul-04 Q1 2004 A Q2 2004 A Q3 2004 A Q4 2004 A FY 2004 A Balance Sheet Assets Current Assets Cash and Cash Equivalents 4158 4225 3949 3722 3722 Investments 4837 5155 4912 4947 4947 Net Cash, Cash Equivalients and ST Investments 8995 9380 8861 8669 8669 Accounts Receivable - Net 1388 2040 1540 1825 1825 Inventories 875 933 1121 1207 1207 Deferred Tax Assets 2062 1947 1905 1827 1827 Lease Receivable,Net 140 57 65 0 0 Prepaid Expenses and Other Current Assets 567 604 581 815 815 Total Current Assets 14027 14961 14073 14343 14343 Property and Equipment,Net 3571 3441 3351 3290 3290 Goodwill 4043 4103 4198 4198 4198 Purchased Intangible Assets, Net 490 441 387 325 325 Other Assets 2947 2915 2810 2840 2840 Investments 10693 10454 10085 10598 10598 Lease Receivable,Net 79 275 293 0 0 Total Assets 35850 36590 35197 35594 35594 Liabilities and ShareHolders' Equity Current Liabilities: Current Porttion of Long-Term Debt 0 0 0 0 0 Accounts Payable 602 645 604 657 657 Income Taxes Payable 687 715 848 963 963 Accrued Compensation 1184 1400 1432 1466 1466 Deferred Revenue 3001 3202 3420 3527 3527 other Current Liabilities 2155 2040 1899 2090 2090 Restructuring Liabilities 86 78 71 0 0 Total Current Liabilities 7715 8080 8274 8703 8703 Long Term Debt Less Current Maturities 0 0 0 0 0 Income Taxes Payable 0 0 0 0 0 Deferred Revenue 706 863 937 975 975 other Long Term Liabilities 0 0 0 0 0 Minority Interest 10 11 5 90 90 Shareholders' Equity: Common Stock and Additional Paid-in Capital 21094 22302 22277 22450 22450 Retained Earnings/(Accumulated Deficit) 5955 4902 3489 3164 3164 Accumulated Other Comprehensive Income 370 432 215 212 212 Total Shareholders' Equity 27419 27636 25981 25826 25826
  • 6. Total Liabilities and Shareholders' Equity 35850 36590 35197 35594 35594 Checksum 0 0 0 0 0
  • 7. Oct-04 Jan-05 Apr-05 Jul-05 Oct-05 Jan-06 Apr-06 Jul-06 Q1 2005 A Q2 2005 A Q3 2005 A Q3 2005 A FY 2005 A Q1 2006 A Q2 2006 A Q3 2006 A Q4 2006 A 3309 2473 2641 4742 4742 1704 5151 4237 3297 3489 3291 2397 11313 11313 11786 9838 13946 14517 6798 5764 5038 16055 16055 13490 14989 18183 17814 1792 2278 2241 2216 2216 2342 2537 2980 3303 1210 1255 1280 1297 1297 1318 1345 1313 1371 1798 1881 1537 1475 1475 1410 1476 1484 1604 878 792 867 967 967 1193 1264 1527 1584 12476 11970 10963 22010 22010 19753 21611 25487 25676 3279 3302 3298 3320 3320 3335 3316 3479 3440 4535 4674 5063 5295 5295 5412 5422 9186 9227 399 396 459 549 549 548 510 2356 2161 2695 2722 3076 2709 2709 2707 2793 2574 2811 10929 10761 11111 0 0 0 0 0 0 0 0 0 0 0 0 0 0 0 34313 33825 33970 33883 33883 31755 33652 43082 43315 0 0 0 0 0 0 0 0 0 680 673 706 735 735 721 684 837 880 1161 1397 1418 1511 1511 1462 1437 1346 1744 1187 1219 1258 1317 1317 1193 1220 1431 1516 3291 3657 3800 3854 3854 3716 3937 4300 4408 2307 2126 2005 2094 2094 2144 2243 2516 2765 0 0 0 0 0 0 0 0 0 8626 9072 9187 9511 9511 9236 9521 10430 11313 0 0 0 0 0 0 0 6346 6332 0 0 0 0 0 0 0 0 0 970 990 1016 1188 1188 1078 1163 1188 1241 0 0 0 0 0 0 0 495 511 128 12 11 10 10 4 4 8 6 22151 22145 22450 22394 22394 22261 22907 24132 24257 2079 1245 1002 506 506 (1046) (268) 121 (617) 359 361 304 274 274 222 325 362 272 24589 23751 23756 23174 23174 21437 22964 24615 23912
  • 8. 34313 33825 33970 33883 33883 31755 33652 43082 43315 0 0 0 0 0 0 0 0 0
  • 9. Oct-06 Jan-07 Apr-07 Jul-07 Oct-07 Jan-08 Apr-08 FY 2006 A Q1 2007 A Q2 2007 A Q3 2007 A Q4 2007 A FY 2007 A Q1 2008 A Q2 2008 A Q3 2008 A 3297 4313 2434 5457 3728 3728 4413 5202 6154 14517 15207 18247 16879 18538 18538 20266 17491 18279 17814 19520 20681 22336 22266 22266 24679 22693 24433 3303 3091 2908 3238 3989 3989 3418 4165 4183 1371 1477 1642 1289 1322 1322 1315 1267 1279 1604 1582 1673 1755 1953 1953 1916 2048 2078 1584 1581 1612 1922 2044 2044 2127 2269 2172 25676 27251 28516 30540 31574 31574 33455 32442 34145 3440 3444 3539 3695 3893 3893 3956 3973 4045 9227 9298 9318 9493 12121 12121 12158 12390 12419 2161 2065 1960 1909 2540 2540 2379 2338 2181 2811 2850 2921 3198 3212 3212 3754 4157 4333 0 0 43315 44908 46254 48835 53340 53340 55702 55300 57123 0 0 0 0 0 0 0 0 500 880 869 931 864 786 786 820 763 808 1744 1605 1330 1525 1740 1740 439 96 83 1516 1487 1589 1791 2019 2019 1920 1981 2320 4408 4546 4718 4854 5391 5391 5381 5786 6103 2765 2774 2923 2938 3422 3422 3660 3567 3545 0 11313 11281 11491 11972 13358 13358 12220 12193 13359 6332 6455 6416 6478 6408 6408 6582 6851 6415 0 0 0 0 0 0 682 791 1015 1241 1219 1343 1485 1646 1646 1726 2197 2487 511 410 414 373 438 438 489 375 646 6 14 8 9 10 10 131 81 63 24257 25419 27245 28411 30687 30687 32510 32773 32931 (617) (233) (1083) (457) 231 231 121 (1073) (843) 272 343 420 564 562 562 1241 1112 1050 23912 25529 26582 28518 31480 31480 33872 32812 33138
  • 10. 43315 44908 46254 48835 53340 53340 55702 55300 57123 0 0 0 0 0 0 0 0 0 9
  • 11. Jul-08 Q4 2008 A FY 2008 A 5191 5191 21044 21044 26235 26235 3821 3821 1235 1235 2075 2075 2333 2333 35699 35699 4151 4151 12392 12392 2089 2089 4403 4403 58734 58734 500 500 869 869 107 107 2428 2428 6197 6197 3757 3757 13858 13858 6393 6393 749 749 2663 2663 669 669 49 49 0 33505 33505 120 120 728 728 34353 34353
  • 13.
  • 14.
  • 15.
  • 16.
  • 17.
  • 18. CISCO Systems Inc. Cash Flow Statement (in $ millions, except per share/ADS data) Oct-06 Jan-07 Q1 2007 A Q2 2007 A YTD/QTD Cash Flow 3M 6M Net Income 1608 3529 Adjustments Depreciation and Amortization 348 690 Employee Share-Based Compensation 225 472 Stock Based Compensation Related to Acquisition 10 19 Provistion for Doubtful Accounts 6 0 Deferred Income Taxes 60 -66 Excess Tax Benefits from Share-Based Compensation -151 -428 In-Process Research and Development 4 6 Net Gains and Impairment Charges on Investments -48 -99 Change in Operating Asssets and Liabilities, Net of Effects of Acquisition: Accounts Receivable 206 395 lease Receivables,net -22 -66 Inventories -106 -271 Prepaid Expenses and Other Current Assets -16 -39 Accounts Payable -11 51 Income Taxes Payable 48 104 Accrued Compensation -29 73 Deferred Revenue 116 412 Other Accrued Liabilities 23 147 Net Cash Provided by Operating Activities 2271 4929 Cash Flow from Investing Activities Purchases of Investments -4771 -11184 Proceeds from Sales and Maturities of Investmens 4268 7762 Acquisition of Property and Equipment -214 -548 Acquisition of Businesses, Net of Cash and Cash Equivalents -121 -166 Change in Investment in Privately Held Companies -48 -76 Other -41 -27 Net Cash Used in Investing Activities -927 -4239 Cash Flows from Financing Activities Issuance of Common Stock 1019 2779 Repruchase of Common Stock -1500 -4781 Proceeds from the Termination of Interest Rate Swaps 0 0
  • 19. Excess Tax Benefits from Share-Based Compensation 151 428 Other 2 21 Net Cash Used in Financing Activities -328 -1553 Net Increase in Cash and Cash Equivalents 1016 -863 Cash and Cash Equivalents, Beginning of Fiscal year 3297 3297 Cash and Cash Equivalents, End of Fiscal year 4313 2434 Checksum 0 0
  • 20. Apr-07 Jul-07 Oct-07 Jan-08 Apr-08 Jul-08 Q3 2007 A Q4 2007 A Q1 2008 A Q2 2008 A Q3 208 A Q4 2008 A 9M 12M 3M 6M 9M 12M 5403 7333 2205 4265 6038 8052 1039 1413 421 878 1314 1744 709 931 226 499 767 1025 27 34 24 45 67 87 6 6 18 29 34 34 -302 -622 -491 -632 -876 -772 -648 -918 -252 -338 -375 -413 7 81 3 3 3 3 -154 -210 -54 -104 -109 -103 60 -597 554 -196 -219 171 82 -156 -127 -260 54 -488 -131 61 7 66 -320 104 -17 -452 81 38 12 -361 535 -107 32 -33 405 62 275 1104 394 220 301 178 690 479 -99 -38 1553 351 -355 1293 70 946 -357 1812 140 431 77 144 268 603 7366 10104 3089 5532 8560 12089 -15342 -20532 -4360 -7846 -14093 -22399 13438 17368 3526 9453 14761 19990 -912 -1251 -296 -591 -908 -1268 -387 -3684 -45 -385 -385 -398 -81 -92 -20 -55 -63 -101 -87 -151 -65 -111 6 -17 -3371 -8342 -1260 465 -682 -4193 3719 5306 1539 2165 2501 3117 -6281 -7681 -2993 -7120 -8982 -10441 0 0 0 0 432 432
  • 21. 648 918 252 338 375 413 79 126 58 94 222 46 -1835 -1331 -1144 -4523 -5452 -6433 2160 431 685 1474 2426 1463 3297 3297 3728 3728 3728 3728 5457 3728 4413 5202 6154 5191 0 0 0 0 0 0