
Recomendados
Recomendados
Más contenido relacionado
Similar a Workplace Wellness - State of Wellness 2012 US National Survey Results - Raw Data
Similar a Workplace Wellness - State of Wellness 2012 US National Survey Results - Raw Data (20)
Workplace Wellness - State of Wellness 2012 US National Survey Results - Raw Data
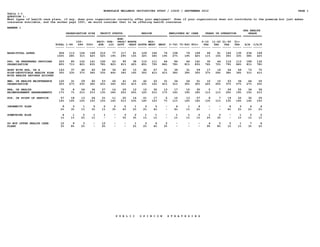
- 1. WORKPLACE WELLNESS INITIATIVES STUDY / 12430 / SEPTEMBER 2012 PAGE 1 Table 1-1 QUESTION 1: What types of health care plans, if any, does your organization currently offer your employees? Even if your organization does not contribute to the premium but just makes insurance available, and the worker pays 100%, we would consider that to be offering health insurance. BANNER 1 ORG HEALTH ORGANIZATION SIZE PROFIT STATUS REGION EMPLOYEES W/ CARE YEARS IN OPERATION GRADE ================= ================= ======================= ================== ======================= =========== NON- 100- PRIV- PUB- PROF/ NORTH MID- 0-10 11-20 21-50 51+ TOTAL 1-99 499 500+ ATE LIC GOVT -EAST SOUTH WEST WEST 0-74% 75-84% 85%+ YRS YRS YRS YRS A/B C/D/F ----- ----- ----- ----- ----- ----- ----- ----- ----- ----- ----- ----- ------ ----- ----- ----- ----- ----- ----- ----- BASE=TOTAL ASKED 406 113 124 169 212 77 117 61 129 140 76 108 79 169 46 61 144 135 234 169 100% 28% 31% 42% 52% 19% 29% 15% 32% 34% 19% 27% 19% 42% 11% 15% 35% 33% 58% 42% PPO, OR PREFERRED PROVIDER 323 80 102 141 165 63 95 38 110 111 64 84 64 141 35 44 114 113 189 132 ORGANIZATION 80% 71% 82% 83% 78% 82% 81% 62% 85% 79% 84% 78% 81% 83% 76% 72% 79% 84% 81% 78% HDHP WITH HSA, OR A 143 37 46 60 69 34 40 10 45 57 31 39 31 59 17 16 54 49 73 70 HIGH-DEDUCTIBLE HEALTH PLAN 35% 33% 37% 36% 33% 44% 34% 16% 35% 41% 41% 36% 39% 35% 37% 26% 38% 36% 31% 41% WITH HEALTH SAVINGS ACCOUNT HMO, OR HEALTH MAINTENANCE 120 31 29 60 53 26 41 25 42 22 31 34 24 51 10 15 53 36 64 55 ORGANIZATION 30% 27% 23% 36% 25% 34% 35% 41% 33% 16% 41% 31% 30% 30% 22% 25% 37% 27% 27% 33% HRA, OR HEALTH 70 8 26 36 27 14 29 12 15 30 13 17 15 30 5 7 29 25 34 36 REIMBURSEMENT ARRANGEMENTS 17% 7% 21% 21% 13% 18% 25% 20% 12% 21% 17% 16% 19% 18% 11% 11% 20% 19% 15% 21% POS, OR POINT OF SERVICE 57 18 13 26 21 11 25 14 21 17 5 12 13 27 6 7 19 22 32 25 14% 16% 10% 15% 10% 14% 21% 23% 16% 12% 7% 11% 16% 16% 13% 11% 13% 16% 14% 15% INDEMNITY PLAN 9 3 1 5 2 2 5 1 3 5 - 4 1 4 - - 6 3 4 4 2% 3% 1% 3% 1% 3% 4% 2% 2% 4% - 4% 1% 2% - - 4% 2% 2% 2% SOMETHING ELSE 4 1 2 1 1 - 3 2 1 1 - 1 1 2 1 2 - 1 2 2 1% 1% 2% 1% - - 3% 3% 1% 1% - 1% 1% 1% 2% 3% - 1% 1% 1% DO NOT OFFER HEALTH CARE 12 9 3 - 12 - - 1 3 6 2 - - - 4 5 2 1 7 4 PLANS 3% 8% 2% - 6% - - 2% 2% 4% 3% - - - 9% 8% 1% 1% 3% 2% P U B L I C O P I N I O N S T R A T E G I E S
- 2. WORKPLACE WELLNESS INITIATIVES STUDY / 12430 / SEPTEMBER 2012 PAGE 2 Table 1-2 QUESTION 1: What types of health care plans, if any, does your organization currently offer your employees? Even if your organization does not contribute to the premium but just makes insurance available, and the worker pays 100%, we would consider that to be offering health insurance. BANNER 2 WELLNESS ROLE OF IMPORTANT ISSUES (%10) HEALTH CONCERNS (COMBINED) - BENEFICIAL STATE/LOCAL GOVT ROLE OF FED GOVT ======================== =============================== ================= ================= ================= DECR LACK HIGH NOT INSU- PROD- WORK- OBES- STRESS OF CHRON BLOOD VERY/ MORE LESS NO MORE LESS NO RANCE UCTI- ABSEN- ERS ITY/ /MEN- FIT- DIS- PRE- AT ACT- ACT- CHAN- ACT- ACT- CHAN- TOTAL COSTS VITY TEEISM COMP WEIGHT TAL NESS EASE SSURE VERY SMWT ALL IVE IVE GE IVE IVE GE ----- ----- ----- ------ ----- ------ ------ ----- ----- ----- ----- ----- ----- ----- ----- ----- ----- ----- ----- BASE=TOTAL ASKED 406 197 140 120 110 211 207 205 133 136 154 199 51 184 60 148 152 79 157 100% 49% 34% 30% 27% 52% 51% 50% 33% 33% 38% 49% 13% 45% 15% 36% 37% 19% 39% PPO, OR PREFERRED PROVIDER 323 161 114 100 96 164 171 165 106 111 130 154 38 141 44 125 118 59 129 ORGANIZATION 80% 82% 81% 83% 87% 78% 83% 80% 80% 82% 84% 77% 75% 77% 73% 84% 78% 75% 82% HDHP WITH HSA, OR A 143 77 50 43 35 71 75 82 48 50 59 65 17 67 21 49 54 29 52 HIGH-DEDUCTIBLE HEALTH PLAN 35% 39% 36% 36% 32% 34% 36% 40% 36% 37% 38% 33% 33% 36% 35% 33% 36% 37% 33% WITH HEALTH SAVINGS ACCOUNT HMO, OR HEALTH MAINTENANCE 120 59 44 33 29 62 68 59 45 35 49 51 20 54 15 47 47 18 50 ORGANIZATION 30% 30% 31% 28% 26% 29% 33% 29% 34% 26% 32% 26% 39% 29% 25% 32% 31% 23% 32% HRA, OR HEALTH 70 33 22 22 17 41 39 40 23 25 32 34 4 33 10 25 28 15 24 REIMBURSEMENT ARRANGEMENTS 17% 17% 16% 18% 15% 19% 19% 20% 17% 18% 21% 17% 8% 18% 17% 17% 18% 19% 15% POS, OR POINT OF SERVICE 57 27 28 22 13 31 32 25 18 19 23 29 4 24 12 20 24 14 16 14% 14% 20% 18% 12% 15% 15% 12% 14% 14% 15% 15% 8% 13% 20% 14% 16% 18% 10% INDEMNITY PLAN 9 7 5 4 3 6 6 4 5 2 5 3 1 4 - 5 3 - 6 2% 4% 4% 3% 3% 3% 3% 2% 4% 1% 3% 2% 2% 2% - 3% 2% - 4% SOMETHING ELSE 4 3 1 - - 3 1 1 2 3 1 3 - 2 1 1 1 1 2 1% 2% 1% - - 1% - - 2% 2% 1% 2% - 1% 2% 1% 1% 1% 1% DO NOT OFFER HEALTH CARE 12 3 4 3 1 7 2 5 6 2 2 6 4 4 1 6 2 1 9 PLANS 3% 2% 3% 3% 1% 3% 1% 2% 5% 1% 1% 3% 8% 2% 2% 4% 1% 1% 6% P U B L I C O P I N I O N S T R A T E G I E S
- 3. WORKPLACE WELLNESS INITIATIVES STUDY / 12430 / SEPTEMBER 2012 PAGE 3 Table 1-3 QUESTION 1: What types of health care plans, if any, does your organization currently offer your employees? Even if your organization does not contribute to the premium but just makes insurance available, and the worker pays 100%, we would consider that to be offering health insurance. BANNER 3 ------------------- AMONG THOSE WITH WELLNESS INITIATIVE --------------------- HAVE WELLNESS % OF YEARS FINANCIAL EMPLOYEE ACCESS INITATIVE OPERATING BUDGET IN OPERATION INCENTIVE ROI TO INITIATIVE =========== ================= ================= =========== =========== ================== 6% OR 1-2 3-4 5+ TOTAL YES NO 0-1% 2-5% MORE YRS YRS YRS YES NO YES NO 0-74% 75-84% 85%+ ----- ----- ----- ----- ----- ----- ----- ----- ----- ----- ----- ----- ----- ----- ------ ----- BASE=TOTAL ASKED 406 224 182 78 64 26 73 43 90 111 110 90 124 19 13 172 100% 55% 45% 35% 29% 12% 33% 19% 40% 50% 49% 40% 55% 8% 6% 77% PPO, OR PREFERRED PROVIDER 323 185 138 63 51 20 54 32 82 94 89 72 105 13 11 142 ORGANIZATION 80% 83% 76% 81% 80% 77% 74% 74% 91% 85% 81% 80% 85% 68% 85% 83% HDHP WITH HSA, OR A 143 89 54 29 27 11 29 22 30 53 34 33 53 8 7 65 HIGH-DEDUCTIBLE HEALTH PLAN 35% 40% 30% 37% 42% 42% 40% 51% 33% 48% 31% 37% 43% 42% 54% 38% WITH HEALTH SAVINGS ACCOUNT HMO, OR HEALTH MAINTENANCE 120 67 53 19 16 11 22 17 20 24 43 32 31 6 3 52 ORGANIZATION 30% 30% 29% 24% 25% 42% 30% 40% 22% 22% 39% 36% 25% 32% 23% 30% HRA, OR HEALTH 70 53 17 18 16 10 13 13 23 34 19 23 29 4 1 42 REIMBURSEMENT ARRANGEMENTS 17% 24% 9% 23% 25% 38% 18% 30% 26% 31% 17% 26% 23% 21% 8% 24% POS, OR POINT OF SERVICE 57 36 21 11 8 9 14 6 14 15 21 18 16 5 1 28 14% 16% 12% 14% 13% 35% 19% 14% 16% 14% 19% 20% 13% 26% 8% 16% INDEMNITY PLAN 9 5 4 3 1 1 3 - 2 2 3 1 4 1 - 4 2% 2% 2% 4% 2% 4% 4% - 2% 2% 3% 1% 3% 5% - 2% SOMETHING ELSE 4 1 3 1 - - - 1 - 1 - - 1 - - 1 1% - 2% 1% - - - 2% - 1% - - 1% - - 1% DO NOT OFFER HEALTH CARE 12 3 9 1 1 1 1 - 2 - 2 - 2 1 - 2 PLANS 3% 1% 5% 1% 2% 4% 1% - 2% - 2% - 2% 5% - 1% P U B L I C O P I N I O N S T R A T E G I E S
- 4. WORKPLACE WELLNESS INITIATIVES STUDY / 12430 / SEPTEMBER 2012 PAGE 4 Table 2-1 QUESTION 2: Approximately what percentage of your organization's operating budget would you say is spent on health insurance coverage for your employees? This excludes employee programs focused on health and wellness that are separate from health insurance coverage. BANNER 1 ORG HEALTH ORGANIZATION SIZE PROFIT STATUS REGION EMPLOYEES W/ CARE YEARS IN OPERATION GRADE ================= ================= ======================= ================== ======================= =========== NON- 100- PRIV- PUB- PROF/ NORTH MID- 0-10 11-20 21-50 51+ TOTAL 1-99 499 500+ ATE LIC GOVT -EAST SOUTH WEST WEST 0-74% 75-84% 85%+ YRS YRS YRS YRS A/B C/D/F ----- ----- ----- ----- ----- ----- ----- ----- ----- ----- ----- ----- ------ ----- ----- ----- ----- ----- ----- ----- BASE=TOTAL ASKED 267 75 86 106 138 46 83 41 83 96 47 82 53 119 22 41 102 94 155 111 100% 28% 32% 40% 52% 17% 31% 15% 31% 36% 18% 31% 20% 45% 8% 15% 38% 35% 58% 42% 0-24% 203 64 66 73 109 29 65 38 61 73 31 68 44 85 17 32 81 68 125 77 76% 85% 77% 69% 79% 63% 78% 93% 73% 76% 66% 83% 83% 71% 77% 78% 79% 72% 81% 69% 25-49% 51 10 16 25 20 13 18 3 18 16 14 10 7 29 4 7 17 21 29 22 19% 13% 19% 24% 14% 28% 22% 7% 22% 17% 30% 12% 13% 24% 18% 17% 17% 22% 19% 20% 50-74% 10 - 3 7 7 3 - - 3 5 2 3 1 5 1 2 3 4 1 9 4% - 3% 7% 5% 7% - - 4% 5% 4% 4% 2% 4% 5% 5% 3% 4% 1% 8% 75%+ 3 1 1 1 2 1 - - 1 2 - 1 1 - - - 1 1 - 3 1% 1% 1% 1% 1% 2% - - 1% 2% - 1% 2% - - - 1% 1% - 3% MEAN 15.4 10.7 15.4 18.8 15.3 19.7 13.3 10.9 15.7 16.3 17.0 14.0 14.2 15.9 15.5 14.7 14.4 16.2 12.6 19.5 P U B L I C O P I N I O N S T R A T E G I E S
- 5. WORKPLACE WELLNESS INITIATIVES STUDY / 12430 / SEPTEMBER 2012 PAGE 5 Table 2-2 QUESTION 2: Approximately what percentage of your organization's operating budget would you say is spent on health insurance coverage for your employees? This excludes employee programs focused on health and wellness that are separate from health insurance coverage. BANNER 2 WELLNESS ROLE OF IMPORTANT ISSUES (%10) HEALTH CONCERNS (COMBINED) - BENEFICIAL STATE/LOCAL GOVT ROLE OF FED GOVT ======================== =============================== ================= ================= ================= DECR LACK HIGH NOT INSU- PROD- WORK- OBES- STRESS OF CHRON BLOOD VERY/ MORE LESS NO MORE LESS NO RANCE UCTI- ABSEN- ERS ITY/ /MEN- FIT- DIS- PRE- AT ACT- ACT- CHAN- ACT- ACT- CHAN- TOTAL COSTS VITY TEEISM COMP WEIGHT TAL NESS EASE SSURE VERY SMWT ALL IVE IVE GE IVE IVE GE ----- ----- ----- ------ ----- ------ ------ ----- ----- ----- ----- ----- ----- ----- ----- ----- ----- ----- ----- BASE=TOTAL ASKED 267 123 102 86 75 140 134 138 89 91 103 133 30 132 37 92 106 49 101 100% 46% 38% 32% 28% 52% 50% 52% 33% 34% 39% 50% 11% 49% 14% 34% 40% 18% 38% 0-24% 203 88 72 63 48 104 105 106 69 70 69 111 22 94 29 78 75 43 82 76% 72% 71% 73% 64% 74% 78% 77% 78% 77% 67% 83% 73% 71% 78% 85% 71% 88% 81% 25-49% 51 25 23 16 17 32 21 24 18 17 30 15 6 30 7 11 25 6 16 19% 20% 23% 19% 23% 23% 16% 17% 20% 19% 29% 11% 20% 23% 19% 12% 24% 12% 16% 50-74% 10 7 5 5 7 3 7 7 - 3 4 5 1 8 - 2 5 - 3 4% 6% 5% 6% 9% 2% 5% 5% - 3% 4% 4% 3% 6% - 2% 5% - 3% 75%+ 3 3 2 2 3 1 1 1 2 1 - 2 1 - 1 1 1 - - 1% 2% 2% 2% 4% 1% 1% 1% 2% 1% - 2% 3% - 3% 1% 1% - - MEAN 15.4 17.8 17.1 17.4 21.1 15.2 15.2 15.6 14.5 15.2 17.5 13.7 15.9 16.9 14.4 12.8 17.6 10.3 13.2 P U B L I C O P I N I O N S T R A T E G I E S
- 6. WORKPLACE WELLNESS INITIATIVES STUDY / 12430 / SEPTEMBER 2012 PAGE 6 Table 2-3 QUESTION 2: Approximately what percentage of your organization's operating budget would you say is spent on health insurance coverage for your employees? This excludes employee programs focused on health and wellness that are separate from health insurance coverage. BANNER 3 ------------------- AMONG THOSE WITH WELLNESS INITIATIVE --------------------- HAVE WELLNESS % OF YEARS FINANCIAL EMPLOYEE ACCESS INITATIVE OPERATING BUDGET IN OPERATION INCENTIVE ROI TO INITIATIVE =========== ================= ================= =========== =========== ================== 6% OR 1-2 3-4 5+ TOTAL YES NO 0-1% 2-5% MORE YRS YRS YRS YES NO YES NO 0-74% 75-84% 85%+ ----- ----- ----- ----- ----- ----- ----- ----- ----- ----- ----- ----- ----- ----- ------ ----- BASE=TOTAL ASKED 267 154 113 66 57 22 49 31 71 83 71 66 85 13 8 126 100% 58% 42% 43% 37% 14% 32% 20% 46% 54% 46% 43% 55% 8% 5% 82% 0-24% 203 111 92 61 42 3 37 22 51 62 49 45 64 10 7 92 76% 72% 81% 92% 74% 14% 76% 71% 72% 75% 69% 68% 75% 77% 88% 73% 25-49% 51 35 16 5 14 14 10 6 18 18 17 18 16 2 1 29 19% 23% 14% 8% 25% 64% 20% 19% 25% 22% 24% 27% 19% 15% 13% 23% 50-74% 10 6 4 - 1 4 2 1 2 3 3 2 4 1 - 4 4% 4% 4% - 2% 18% 4% 3% 3% 4% 4% 3% 5% 8% - 3% 75%+ 3 2 1 - - 1 - 2 - - 2 1 1 - - 1 1% 1% 1% - - 5% - 6% - - 3% 2% 1% - - 1% MEAN 15.4 16.5 14.0 8.2 16.3 38.2 15.8 20.6 14.8 15.3 18.0 18.5 14.9 19.3 12.0 15.6 P U B L I C O P I N I O N S T R A T E G I E S
- 7. WORKPLACE WELLNESS INITIATIVES STUDY / 12430 / SEPTEMBER 2012 PAGE 7 Table 3-1 QUESTION 3: What grade would you give your organization's employees in terms of being healthy? BANNER 1 ORG HEALTH ORGANIZATION SIZE PROFIT STATUS REGION EMPLOYEES W/ CARE YEARS IN OPERATION GRADE ================= ================= ======================= ================== ======================= =========== NON- 100- PRIV- PUB- PROF/ NORTH MID- 0-10 11-20 21-50 51+ TOTAL 1-99 499 500+ ATE LIC GOVT -EAST SOUTH WEST WEST 0-74% 75-84% 85%+ YRS YRS YRS YRS A/B C/D/F ----- ----- ----- ----- ----- ----- ----- ----- ----- ----- ----- ----- ------ ----- ----- ----- ----- ----- ----- ----- BASE=TOTAL ASKED 403 113 122 168 210 76 117 61 127 139 76 108 78 168 46 61 142 134 234 169 100% 28% 30% 42% 52% 19% 29% 15% 32% 34% 19% 27% 19% 42% 11% 15% 35% 33% 58% 42% **D/S (A/B - C/D/F) 65 53 16 -4 42 18 5 21 13 11 20 10 8 36 16 11 22 10 234 -169 16% 47% 13% -2% 20% 24% 4% 34% 10% 8% 26% 9% 10% 21% 35% 18% 15% 7% 100% -100% A/B 234 83 69 82 126 47 61 41 70 75 48 59 43 102 31 36 82 72 234 - --- 58% 73% 57% 49% 60% 62% 52% 67% 55% 54% 63% 55% 55% 61% 67% 59% 58% 54% 100% - C/D/F 169 30 53 86 84 29 56 20 57 64 28 49 35 66 15 25 60 62 - 169 ----- 42% 27% 43% 51% 40% 38% 48% 33% 45% 46% 37% 45% 45% 39% 33% 41% 42% 46% - 100% A 16 7 2 7 11 2 3 2 5 3 6 3 4 4 4 2 4 5 16 - 4% 6% 2% 4% 5% 3% 3% 3% 4% 2% 8% 3% 5% 2% 9% 3% 3% 4% 7% - B 218 76 67 75 115 45 58 39 65 72 42 56 39 98 27 34 78 67 218 - 54% 67% 55% 45% 55% 59% 50% 64% 51% 52% 55% 52% 50% 58% 59% 56% 55% 50% 93% - C 153 26 48 79 75 26 52 16 54 56 27 45 31 60 14 24 53 55 - 153 38% 23% 39% 47% 36% 34% 44% 26% 43% 40% 36% 42% 40% 36% 30% 39% 37% 41% - 91% D 15 3 5 7 9 3 3 4 3 7 1 3 4 6 1 1 7 6 - 15 4% 3% 4% 4% 4% 4% 3% 7% 2% 5% 1% 3% 5% 4% 2% 2% 5% 4% - 9% F 1 1 - - - - 1 - - 1 - 1 - - - - - 1 - 1 - 1% - - - - 1% - - 1% - 1% - - - - - 1% - 1% P U B L I C O P I N I O N S T R A T E G I E S
- 8. WORKPLACE WELLNESS INITIATIVES STUDY / 12430 / SEPTEMBER 2012 PAGE 8 Table 3-2 QUESTION 3: What grade would you give your organization's employees in terms of being healthy? BANNER 2 WELLNESS ROLE OF IMPORTANT ISSUES (%10) HEALTH CONCERNS (COMBINED) - BENEFICIAL STATE/LOCAL GOVT ROLE OF FED GOVT ======================== =============================== ================= ================= ================= DECR LACK HIGH NOT INSU- PROD- WORK- OBES- STRESS OF CHRON BLOOD VERY/ MORE LESS NO MORE LESS NO RANCE UCTI- ABSEN- ERS ITY/ /MEN- FIT- DIS- PRE- AT ACT- ACT- CHAN- ACT- ACT- CHAN- TOTAL COSTS VITY TEEISM COMP WEIGHT TAL NESS EASE SSURE VERY SMWT ALL IVE IVE GE IVE IVE GE ----- ----- ----- ------ ----- ------ ------ ----- ----- ----- ----- ----- ----- ----- ----- ----- ----- ----- ----- BASE=TOTAL ASKED 403 195 139 120 109 209 206 205 132 135 152 198 51 183 60 147 151 79 155 100% 48% 34% 30% 27% 52% 51% 51% 33% 33% 38% 49% 13% 45% 15% 36% 37% 20% 38% **D/S (A/B - C/D/F) 65 9 25 14 17 -7 58 27 20 15 26 30 11 7 14 43 9 19 35 16% 5% 18% 12% 16% -3% 28% 13% 15% 11% 17% 15% 22% 4% 23% 29% 6% 24% 23% A/B 234 102 82 67 63 101 132 116 76 75 89 114 31 95 37 95 80 49 95 --- 58% 52% 59% 56% 58% 48% 64% 57% 58% 56% 59% 58% 61% 52% 62% 65% 53% 62% 61% C/D/F 169 93 57 53 46 108 74 89 56 60 63 84 20 88 23 52 71 30 60 ----- 42% 48% 41% 44% 42% 52% 36% 43% 42% 44% 41% 42% 39% 48% 38% 35% 47% 38% 39% A 16 2 3 4 3 2 10 6 7 5 8 4 4 8 4 3 8 4 3 4% 1% 2% 3% 3% 1% 5% 3% 5% 4% 5% 2% 8% 4% 7% 2% 5% 5% 2% B 218 100 79 63 60 99 122 110 69 70 81 110 27 87 33 92 72 45 92 54% 51% 57% 53% 55% 47% 59% 54% 52% 52% 53% 56% 53% 48% 55% 63% 48% 57% 59% C 153 83 51 47 42 99 68 81 50 52 57 76 18 80 21 47 66 26 54 38% 43% 37% 39% 39% 47% 33% 40% 38% 39% 38% 38% 35% 44% 35% 32% 44% 33% 35% D 15 10 6 6 4 8 6 8 5 8 6 7 2 7 2 5 4 4 6 4% 5% 4% 5% 4% 4% 3% 4% 4% 6% 4% 4% 4% 4% 3% 3% 3% 5% 4% F 1 - - - - 1 - - 1 - - 1 - 1 - - 1 - - - - - - - - - - 1% - - 1% - 1% - - 1% - - P U B L I C O P I N I O N S T R A T E G I E S
- 9. WORKPLACE WELLNESS INITIATIVES STUDY / 12430 / SEPTEMBER 2012 PAGE 9 Table 3-3 QUESTION 3: What grade would you give your organization's employees in terms of being healthy? BANNER 3 ------------------- AMONG THOSE WITH WELLNESS INITIATIVE --------------------- HAVE WELLNESS % OF YEARS FINANCIAL EMPLOYEE ACCESS INITATIVE OPERATING BUDGET IN OPERATION INCENTIVE ROI TO INITIATIVE =========== ================= ================= =========== =========== ================== 6% OR 1-2 3-4 5+ TOTAL YES NO 0-1% 2-5% MORE YRS YRS YRS YES NO YES NO 0-74% 75-84% 85%+ ----- ----- ----- ----- ----- ----- ----- ----- ----- ----- ----- ----- ----- ----- ------ ----- BASE=TOTAL ASKED 403 222 181 77 64 25 72 43 89 111 109 89 124 19 13 170 100% 55% 45% 35% 29% 11% 32% 19% 40% 50% 49% 40% 56% 9% 6% 77% **D/S (A/B - C/D/F) 65 30 35 21 6 -5 -8 -9 41 3 27 13 16 -1 -5 30 16% 14% 19% 27% 9% -20% -11% -21% 46% 3% 25% 15% 13% -5% -38% 18% A/B 234 126 108 49 35 10 32 17 65 57 68 51 70 9 4 100 --- 58% 57% 60% 64% 55% 40% 44% 40% 73% 51% 62% 57% 56% 47% 31% 59% C/D/F 169 96 73 28 29 15 40 26 24 54 41 38 54 10 9 70 ----- 42% 43% 40% 36% 45% 60% 56% 60% 27% 49% 38% 43% 44% 53% 69% 41% A 16 10 6 2 3 1 4 1 2 3 7 5 5 1 - 6 4% 5% 3% 3% 5% 4% 6% 2% 2% 3% 6% 6% 4% 5% - 4% B 218 116 102 47 32 9 28 16 63 54 61 46 65 8 4 94 54% 52% 56% 61% 50% 36% 39% 37% 71% 49% 56% 52% 52% 42% 31% 55% C 153 91 62 26 27 14 37 24 24 49 41 37 50 9 9 66 38% 41% 34% 34% 42% 56% 51% 56% 27% 44% 38% 42% 40% 47% 69% 39% D 15 5 10 2 2 1 3 2 - 5 - 1 4 1 - 4 4% 2% 6% 3% 3% 4% 4% 5% - 5% - 1% 3% 5% - 2% F 1 - 1 - - - - - - - - - - - - - - - 1% - - - - - - - - - - - - - P U B L I C O P I N I O N S T R A T E G I E S
- 10. WORKPLACE WELLNESS INITIATIVES STUDY / 12430 / SEPTEMBER 2012 PAGE 10 Table 4-1 Summary of Priorities: % 10 BANNER 1 ORG HEALTH ORGANIZATION SIZE PROFIT STATUS REGION EMPLOYEES W/ CARE YEARS IN OPERATION GRADE ================= ================= ======================= ================== ======================= =========== NON- 100- PRIV- PUB- PROF/ NORTH MID- 0-10 11-20 21-50 51+ TOTAL 1-99 499 500+ ATE LIC GOVT -EAST SOUTH WEST WEST 0-74% 75-84% 85%+ YRS YRS YRS YRS A/B C/D/F ----- ----- ----- ----- ----- ----- ----- ----- ----- ----- ----- ----- ------ ----- ----- ----- ----- ----- ----- ----- BASE=TOTAL ASKED 406 113 124 169 212 77 117 61 129 140 76 108 79 169 46 61 144 135 234 169 100% 28% 31% 42% 52% 19% 29% 15% 32% 34% 19% 27% 19% 42% 11% 15% 35% 33% 58% 42% HEALTH INSURANCE COSTS 197 54 63 80 104 34 59 26 61 69 41 60 34 80 19 22 73 72 102 93 49% 48% 51% 47% 50% 44% 50% 43% 47% 50% 54% 56% 43% 47% 42% 36% 51% 53% 44% 55% (1) (1) (1) (1) (1) (1) (1) (1) (1) (1) (1) (1) (1) (1) (1) (1) (1) (1) (1) (1) DECREASED PRODUCTIVITY 140 41 42 57 76 27 37 19 42 47 32 33 24 65 14 18 55 46 82 57 35% 37% 34% 34% 36% 35% 32% 32% 33% 34% 42% 31% 31% 38% 32% 30% 38% 34% 35% 34% (2) (2) (2) (2) (2) (2) (3) (2) (2) (2) (2) (2) (2) (2) (2) (2) (2) (3) (2) (2) ABSENTEEISM 120 36 33 51 61 17 42 16 34 46 24 30 22 53 13 13 39 48 67 53 30% 32% 27% 31% 29% 22% 36% 26% 27% 34% 32% 28% 28% 31% 29% 22% 27% 36% 29% 31% (3) (3) (4) (3) (4) (3) (2) (3) (3) (3) (4) (4) (3) (3) (3) (4) (3) (2) (3) (3) WORKERS COMPENSATION OR 110 21 38 51 63 14 33 13 31 39 27 31 22 43 10 15 37 41 63 46 DISABILITY CLAIMS 27% 19% 31% 30% 30% 18% 28% 22% 24% 28% 36% 29% 28% 25% 22% 25% 26% 30% 27% 27% (4) (4) (3) (4) (3) (4) (4) (4) (4) (4) (3) (3) (4) (4) (4) (3) (4) (4) (4) (4) P U B L I C O P I N I O N S T R A T E G I E S
- 11. WORKPLACE WELLNESS INITIATIVES STUDY / 12430 / SEPTEMBER 2012 PAGE 11 Table 4-2 Summary of Priorities: % 10 BANNER 2 WELLNESS ROLE OF IMPORTANT ISSUES (%10) HEALTH CONCERNS (COMBINED) - BENEFICIAL STATE/LOCAL GOVT ROLE OF FED GOVT ======================== =============================== ================= ================= ================= DECR LACK HIGH NOT INSU- PROD- WORK- OBES- STRESS OF CHRON BLOOD VERY/ MORE LESS NO MORE LESS NO RANCE UCTI- ABSEN- ERS ITY/ /MEN- FIT- DIS- PRE- AT ACT- ACT- CHAN- ACT- ACT- CHAN- TOTAL COSTS VITY TEEISM COMP WEIGHT TAL NESS EASE SSURE VERY SMWT ALL IVE IVE GE IVE IVE GE ----- ----- ----- ------ ----- ------ ------ ----- ----- ----- ----- ----- ----- ----- ----- ----- ----- ----- ----- BASE=TOTAL ASKED 406 197 140 120 110 211 207 205 133 136 154 199 51 184 60 148 152 79 157 100% 49% 34% 30% 27% 52% 51% 50% 33% 33% 38% 49% 13% 45% 15% 36% 37% 19% 39% HEALTH INSURANCE COSTS 197 197 104 85 89 105 108 103 67 57 93 88 15 92 27 68 75 38 72 49% 100% 75% 71% 81% 50% 52% 50% 50% 42% 61% 44% 29% 50% 45% 46% 49% 48% 46% (1) (1) (2) (3) (2) (1) (1) (1) (1) (1) (1) (1) (1) (1) (1) (1) (1) (1) (1) DECREASED PRODUCTIVITY 140 104 140 98 80 65 72 69 49 44 70 61 9 70 16 47 56 20 53 35% 53% 100% 82% 73% 31% 35% 34% 37% 33% 46% 31% 18% 38% 27% 32% 37% 26% 34% (2) (2) (1) (2) (3) (2) (2) (2) (2) (2) (2) (2) *(3) (2) (2) (2) (2) (2) (2) ABSENTEEISM 120 85 98 120 76 62 56 62 45 33 59 50 10 64 12 37 51 19 41 30% 43% 71% 100% 70% 30% 27% 31% 34% 24% 39% 25% 20% 35% 20% 25% 34% 24% 26% (3) (4) (3) (1) (4) (3) (4) (3) (3) (3) (3) (3) (2) (3) (4) (3) (3) (3) (3) WORKERS COMPENSATION OR 110 89 80 76 110 57 60 62 38 25 54 47 9 58 13 34 49 15 39 DISABILITY CLAIMS 27% 45% 58% 64% 100% 27% 29% 30% 29% 19% 36% 24% 18% 32% 22% 23% 32% 19% 25% (4) (3) (4) (4) (1) (4) (3) (4) (4) (4) (4) (4) *(3) (4) (3) (4) (4) (4) (4) P U B L I C O P I N I O N S T R A T E G I E S
- 12. WORKPLACE WELLNESS INITIATIVES STUDY / 12430 / SEPTEMBER 2012 PAGE 12 Table 4-3 Summary of Priorities: % 10 BANNER 3 ------------------- AMONG THOSE WITH WELLNESS INITIATIVE --------------------- HAVE WELLNESS % OF YEARS FINANCIAL EMPLOYEE ACCESS INITATIVE OPERATING BUDGET IN OPERATION INCENTIVE ROI TO INITIATIVE =========== ================= ================= =========== =========== ================== 6% OR 1-2 3-4 5+ TOTAL YES NO 0-1% 2-5% MORE YRS YRS YRS YES NO YES NO 0-74% 75-84% 85%+ ----- ----- ----- ----- ----- ----- ----- ----- ----- ----- ----- ----- ----- ----- ------ ----- BASE=TOTAL ASKED 406 224 182 78 64 26 73 43 90 111 110 90 124 19 13 172 100% 55% 45% 35% 29% 12% 33% 19% 40% 50% 49% 40% 55% 8% 6% 77% HEALTH INSURANCE COSTS 197 112 85 34 33 14 42 23 39 60 52 47 59 15 5 80 49% 50% 47% 44% 52% 54% 58% 53% 43% 54% 47% 52% 48% 79% 38% 47% (1) (1) (1) (1) (1) (1) (1) (1) (1) (1) (1) (1) (1) (1) (1) (1) DECREASED PRODUCTIVITY 140 80 60 28 22 12 30 15 30 42 37 38 38 8 1 65 35% 36% 33% 36% 34% 48% 42% 35% 34% 38% 34% 43% 31% 44% 8% 38% (2) (2) (2) (2) (3) (3) (2) *(2) (3) (2) (2) (2) (2) (2) (4) (2) ABSENTEEISM 120 70 50 20 23 13 22 14 30 37 32 36 31 7 2 55 30% 32% 28% 26% 36% 52% 31% 33% 34% 34% 29% 40% 25% 37% 15% 33% (3) (3) (3) (4) (2) (2) (3) (4) (2) (3) (3) (3) (3) (3) *(2) (3) WORKERS COMPENSATION OR 110 67 43 23 20 8 21 15 27 36 31 33 29 4 2 53 DISABILITY CLAIMS 27% 30% 24% 30% 31% 32% 29% 35% 31% 33% 28% 37% 24% 21% 15% 31% (4) (4) (4) (3) (4) (4) (4) *(2) (4) (4) (4) (4) (4) (4) *(2) (4) P U B L I C O P I N I O N S T R A T E G I E S
- 13. WORKPLACE WELLNESS INITIATIVES STUDY / 12430 / SEPTEMBER 2012 PAGE 13 Table 5-1 Summary of Priorities: % 8-10 BANNER 1 ORG HEALTH ORGANIZATION SIZE PROFIT STATUS REGION EMPLOYEES W/ CARE YEARS IN OPERATION GRADE ================= ================= ======================= ================== ======================= =========== NON- 100- PRIV- PUB- PROF/ NORTH MID- 0-10 11-20 21-50 51+ TOTAL 1-99 499 500+ ATE LIC GOVT -EAST SOUTH WEST WEST 0-74% 75-84% 85%+ YRS YRS YRS YRS A/B C/D/F ----- ----- ----- ----- ----- ----- ----- ----- ----- ----- ----- ----- ------ ----- ----- ----- ----- ----- ----- ----- BASE=TOTAL ASKED 406 113 124 169 212 77 117 61 129 140 76 108 79 169 46 61 144 135 234 169 100% 28% 31% 42% 52% 19% 29% 15% 32% 34% 19% 27% 19% 42% 11% 15% 35% 33% 58% 42% HEALTH INSURANCE COSTS 340 93 102 145 172 66 102 50 106 122 62 92 64 147 35 48 119 119 194 144 84% 83% 83% 86% 82% 86% 87% 82% 82% 88% 82% 85% 81% 87% 78% 79% 83% 88% 83% 86% (1) (1) (1) (1) (1) (1) (1) (1) (1) (1) (1) (1) (1) (1) (1) (1) (1) (1) (1) (1) DECREASED PRODUCTIVITY 292 83 84 125 158 57 77 44 94 94 60 80 51 127 32 45 107 93 173 117 73% 74% 69% 74% 76% 74% 66% 73% 73% 68% 79% 75% 65% 75% 73% 74% 75% 69% 75% 69% (2) (2) (2) (3) (2) (2) (3) (2) (2) (3) (2) (3) (2) (2) (2) (2) (2) (3) (2) (3) ABSENTEEISM 278 75 78 125 140 55 83 44 84 97 53 81 49 115 29 38 101 94 159 119 69% 68% 63% 75% 68% 71% 71% 72% 66% 71% 71% 76% 63% 68% 64% 66% 71% 70% 69% 70% (3) (3) (3) (2) (3) (3) (2) (3) (3) (2) (3) (2) (3) (3) (3) (3) (3) (2) (3) (2) WORKERS COMPENSATION OR 233 54 68 111 117 45 71 38 65 80 50 66 42 98 22 33 81 82 131 101 DISABILITY CLAIMS 58% 49% 56% 66% 56% 58% 61% 63% 51% 58% 66% 62% 53% 58% 49% 54% 57% 61% 56% 60% (4) (4) (4) (4) (4) (4) (4) (4) (4) (4) (4) (4) (4) (4) (4) (4) (4) (4) (4) (4) P U B L I C O P I N I O N S T R A T E G I E S
- 14. WORKPLACE WELLNESS INITIATIVES STUDY / 12430 / SEPTEMBER 2012 PAGE 14 Table 5-2 Summary of Priorities: % 8-10 BANNER 2 WELLNESS ROLE OF IMPORTANT ISSUES (%10) HEALTH CONCERNS (COMBINED) - BENEFICIAL STATE/LOCAL GOVT ROLE OF FED GOVT ======================== =============================== ================= ================= ================= DECR LACK HIGH NOT INSU- PROD- WORK- OBES- STRESS OF CHRON BLOOD VERY/ MORE LESS NO MORE LESS NO RANCE UCTI- ABSEN- ERS ITY/ /MEN- FIT- DIS- PRE- AT ACT- ACT- CHAN- ACT- ACT- CHAN- TOTAL COSTS VITY TEEISM COMP WEIGHT TAL NESS EASE SSURE VERY SMWT ALL IVE IVE GE IVE IVE GE ----- ----- ----- ------ ----- ------ ------ ----- ----- ----- ----- ----- ----- ----- ----- ----- ----- ----- ----- BASE=TOTAL ASKED 406 197 140 120 110 211 207 205 133 136 154 199 51 184 60 148 152 79 157 100% 49% 34% 30% 27% 52% 51% 50% 33% 33% 38% 49% 13% 45% 15% 36% 37% 19% 39% HEALTH INSURANCE COSTS 340 197 128 106 104 180 175 169 113 120 134 170 35 149 51 128 124 69 132 84% 100% 92% 89% 95% 85% 85% 82% 85% 88% 88% 86% 69% 81% 85% 87% 82% 87% 85% (1) (1) (3) (3) (2) (1) (1) (1) (1) (1) (1) (1) (1) (1) (1) (1) (1) (1) (1) DECREASED PRODUCTIVITY 292 156 140 114 99 149 146 147 94 99 118 139 34 134 45 102 115 53 108 73% 80% 100% 96% 90% 71% 71% 72% 71% 73% 78% 70% 67% 73% 76% 69% 76% 68% 70% (2) (2) (1) (2) (3) (2) (2) (2) (2) (2) (2) (2) (2) (2) (2) (2) (2) (2) (2) ABSENTEEISM 278 155 134 120 95 140 142 139 86 91 115 134 28 128 41 99 109 48 106 69% 79% 96% 100% 88% 67% 69% 69% 65% 67% 76% 68% 56% 70% 69% 68% 73% 62% 68% (3) (3) (2) (1) (4) (3) (3) (3) (3) (3) (3) (3) (3) (3) (3) (3) (3) (3) (3) WORKERS COMPENSATION OR 233 138 112 102 110 127 111 118 77 74 97 114 22 113 35 76 90 42 87 DISABILITY CLAIMS 58% 70% 81% 86% 100% 60% 54% 58% 58% 55% 64% 58% 43% 61% 58% 52% 60% 53% 56% (4) (4) (4) (4) (1) (4) (4) (4) (4) (4) (4) (4) (4) (4) (4) (4) (4) (4) (4) P U B L I C O P I N I O N S T R A T E G I E S
- 15. WORKPLACE WELLNESS INITIATIVES STUDY / 12430 / SEPTEMBER 2012 PAGE 15 Table 5-3 Summary of Priorities: % 8-10 BANNER 3 ------------------- AMONG THOSE WITH WELLNESS INITIATIVE --------------------- HAVE WELLNESS % OF YEARS FINANCIAL EMPLOYEE ACCESS INITATIVE OPERATING BUDGET IN OPERATION INCENTIVE ROI TO INITIATIVE =========== ================= ================= =========== =========== ================== 6% OR 1-2 3-4 5+ TOTAL YES NO 0-1% 2-5% MORE YRS YRS YRS YES NO YES NO 0-74% 75-84% 85%+ ----- ----- ----- ----- ----- ----- ----- ----- ----- ----- ----- ----- ----- ----- ------ ----- BASE=TOTAL ASKED 406 224 182 78 64 26 73 43 90 111 110 90 124 19 13 172 100% 55% 45% 35% 29% 12% 33% 19% 40% 50% 49% 40% 55% 8% 6% 77% HEALTH INSURANCE COSTS 340 188 152 63 53 23 61 37 75 97 90 78 102 17 9 144 84% 84% 84% 81% 83% 88% 85% 86% 83% 87% 82% 87% 82% 89% 69% 84% (1) (1) (1) (1) *(1) (1) (1) (1) (1) (1) (1) (1) (1) (1) (1) (1) DECREASED PRODUCTIVITY 292 164 128 54 53 20 55 31 66 85 77 74 82 14 7 130 73% 74% 71% 69% 83% 80% 76% 72% 74% 77% 70% 83% 66% 78% 54% 76% (2) (2) (2) (2) *(1) *(3) (2) *(2) (2) *(2) (2) (2) (2) (2) *(2) (2) ABSENTEEISM 278 156 122 46 51 21 51 31 61 85 70 71 78 14 7 122 69% 71% 68% 61% 80% 84% 71% 72% 69% 77% 64% 80% 63% 74% 54% 72% (3) (3) (3) (3) (3) (2) (3) *(2) (3) *(2) (3) (3) (3) (3) *(2) (3) WORKERS COMPENSATION OR 233 136 97 42 44 20 43 27 58 74 61 61 68 11 6 107 DISABILITY CLAIMS 58% 62% 54% 55% 69% 80% 60% 63% 66% 67% 55% 68% 55% 58% 46% 63% (4) (4) (4) (4) (4) *(3) (4) (4) (4) (4) (4) (4) (4) (4) (4) (4) P U B L I C O P I N I O N S T R A T E G I E S
- 16. WORKPLACE WELLNESS INITIATIVES STUDY / 12430 / SEPTEMBER 2012 PAGE 16 Table 6-1 Summary of Priorities: % Mean BANNER 1 ORG HEALTH ORGANIZATION SIZE PROFIT STATUS REGION EMPLOYEES W/ CARE YEARS IN OPERATION GRADE ================= ================= ======================= ================== ======================= =========== NON- 100- PRIV- PUB- PROF/ NORTH MID- 0-10 11-20 21-50 51+ TOTAL 1-99 499 500+ ATE LIC GOVT -EAST SOUTH WEST WEST 0-74% 75-84% 85%+ YRS YRS YRS YRS A/B C/D/F ----- ----- ----- ----- ----- ----- ----- ----- ----- ----- ----- ----- ------ ----- ----- ----- ----- ----- ----- ----- BASE=TOTAL ASKED 406 113 124 169 212 77 117 61 129 140 76 108 79 169 46 61 144 135 234 169 100% 28% 31% 42% 52% 19% 29% 15% 32% 34% 19% 27% 19% 42% 11% 15% 35% 33% 58% 42% HEALTH INSURANCE COSTS 8.8 8.7 8.8 8.9 8.8 8.8 8.9 8.8 8.7 8.9 8.8 9.0 8.7 8.9 8.3 8.4 8.8 9.0 8.7 9.0 (1) (1) (1) (1) (1) (1) (1) (1) (1) (1) (1) (1) (1) (1) (1) (1) (1) (1) (1) (1) DECREASED PRODUCTIVITY 8.2 8.2 8.2 8.3 8.3 8.3 8.0 8.4 8.2 8.1 8.5 8.3 8.0 8.3 8.1 8.1 8.3 8.2 8.3 8.1 (2) (2) (2) (3) (2) (2) (3) (2) (2) (2) (2) (2) (2) (2) (2) (2) (2) (2) (2) *(2) ABSENTEEISM 8.0 7.7 7.9 8.3 7.9 8.1 8.1 8.2 7.8 8.1 8.0 8.1 7.8 7.9 7.7 7.7 8.0 8.2 7.9 8.1 (3) (3) (3) (2) (3) (3) (2) (3) (3) (3) (3) (3) (3) (3) (3) (3) (3) (3) (3) *(2) WORKERS COMPENSATION OR 7.4 6.6 7.4 7.9 7.3 7.6 7.5 8.1 7.0 7.3 7.8 7.7 7.2 7.3 6.6 6.8 7.5 7.7 7.4 7.5 DISABILITY CLAIMS (4) (4) (4) (4) (4) (4) (4) (4) (4) (4) (4) (4) (4) (4) (4) (4) (4) (4) (4) (4) P U B L I C O P I N I O N S T R A T E G I E S
- 17. WORKPLACE WELLNESS INITIATIVES STUDY / 12430 / SEPTEMBER 2012 PAGE 17 Table 6-2 Summary of Priorities: % Mean BANNER 2 WELLNESS ROLE OF IMPORTANT ISSUES (%10) HEALTH CONCERNS (COMBINED) - BENEFICIAL STATE/LOCAL GOVT ROLE OF FED GOVT ======================== =============================== ================= ================= ================= DECR LACK HIGH NOT INSU- PROD- WORK- OBES- STRESS OF CHRON BLOOD VERY/ MORE LESS NO MORE LESS NO RANCE UCTI- ABSEN- ERS ITY/ /MEN- FIT- DIS- PRE- AT ACT- ACT- CHAN- ACT- ACT- CHAN- TOTAL COSTS VITY TEEISM COMP WEIGHT TAL NESS EASE SSURE VERY SMWT ALL IVE IVE GE IVE IVE GE ----- ----- ----- ------ ----- ------ ------ ----- ----- ----- ----- ----- ----- ----- ----- ----- ----- ----- ----- BASE=TOTAL ASKED 406 197 140 120 110 211 207 205 133 136 154 199 51 184 60 148 152 79 157 100% 49% 34% 30% 27% 52% 51% 50% 33% 33% 38% 49% 13% 45% 15% 36% 37% 19% 39% HEALTH INSURANCE COSTS 8.8 10.0 9.5 9.3 9.6 8.8 8.9 8.8 8.9 8.9 9.1 8.8 8.0 8.8 8.9 8.8 8.8 8.9 8.7 (1) (1) (2) (3) (2) (1) (1) (1) (1) (1) (1) (1) (1) (1) (1) (1) (1) (1) (1) DECREASED PRODUCTIVITY 8.2 8.7 10.0 9.7 9.2 8.2 8.2 8.1 8.1 8.3 8.6 8.1 7.6 8.3 8.2 8.1 8.4 7.9 8.2 (2) (2) (1) (2) (4) (2) (2) (2) (2) (2) (2) (2) (2) (2) (2) (2) (2) (2) (2) ABSENTEEISM 8.0 8.5 9.4 10.0 9.2 8.0 7.9 7.9 8.0 7.8 8.3 8.0 7.2 8.1 7.7 7.8 8.2 7.6 7.9 (3) (3) (3) (1) (3) (3) (3) (3) (3) (3) (3) (3) (3) (3) (3) (3) (3) (3) (3) WORKERS COMPENSATION OR 7.4 8.2 8.7 9.0 10.0 7.5 7.3 7.4 7.4 7.2 7.8 7.4 6.4 7.5 7.5 7.2 7.5 7.1 7.3 DISABILITY CLAIMS (4) (4) (4) (4) (1) (4) (4) (4) (4) (4) (4) (4) (4) (4) (4) (4) (4) (4) (4) P U B L I C O P I N I O N S T R A T E G I E S
- 18. WORKPLACE WELLNESS INITIATIVES STUDY / 12430 / SEPTEMBER 2012 PAGE 18 Table 6-3 Summary of Priorities: % Mean BANNER 3 ------------------- AMONG THOSE WITH WELLNESS INITIATIVE --------------------- HAVE WELLNESS % OF YEARS FINANCIAL EMPLOYEE ACCESS INITATIVE OPERATING BUDGET IN OPERATION INCENTIVE ROI TO INITIATIVE =========== ================= ================= =========== =========== ================== 6% OR 1-2 3-4 5+ TOTAL YES NO 0-1% 2-5% MORE YRS YRS YRS YES NO YES NO 0-74% 75-84% 85%+ ----- ----- ----- ----- ----- ----- ----- ----- ----- ----- ----- ----- ----- ----- ------ ----- BASE=TOTAL ASKED 406 224 182 78 64 26 73 43 90 111 110 90 124 19 13 172 100% 55% 45% 35% 29% 12% 33% 19% 40% 50% 49% 40% 55% 8% 6% 77% HEALTH INSURANCE COSTS 8.8 8.9 8.7 8.8 8.9 8.7 9.0 9.1 8.7 9.1 8.8 9.0 8.8 9.5 8.4 8.8 (1) (1) (1) (1) (1) (1) (1) (1) (1) (1) (1) (1) (1) (1) (1) (1) DECREASED PRODUCTIVITY 8.2 8.3 8.1 8.2 8.6 8.5 8.5 8.1 8.4 8.3 8.3 8.6 8.1 8.7 7.1 8.5 (2) (2) (2) (2) (2) (3) (2) (3) (2) (2) (2) (2) (2) (2) (4) (2) ABSENTEEISM 8.0 8.1 7.8 7.7 8.6 8.7 8.1 8.2 8.1 8.2 8.0 8.5 7.8 8.5 7.5 8.2 (3) (3) (3) (3) (3) (2) (3) (2) (3) (3) (3) (3) (3) (3) *(2) (3) WORKERS COMPENSATION OR 7.4 7.8 7.0 7.5 8.0 8.3 7.7 7.8 7.9 8.0 7.5 8.1 7.5 7.7 7.5 7.7 DISABILITY CLAIMS (4) (4) (4) (4) (4) (4) (4) (4) (4) (4) (4) (4) (4) (4) *(2) (4) P U B L I C O P I N I O N S T R A T E G I E S
- 19. WORKPLACE WELLNESS INITIATIVES STUDY / 12430 / SEPTEMBER 2012 PAGE 19 Table 7-1 QUESTION 4: Below are some issues that may be impacted by employee health behaviors and conditions. Please rate the importance of these issues in terms of overall organization priorities. 1 is Not Important At All To Your Organization, 10 is Extremely Important To Your Organization. Health insurance costs BANNER 1 ORG HEALTH ORGANIZATION SIZE PROFIT STATUS REGION EMPLOYEES W/ CARE YEARS IN OPERATION GRADE ================= ================= ======================= ================== ======================= =========== NON- 100- PRIV- PUB- PROF/ NORTH MID- 0-10 11-20 21-50 51+ TOTAL 1-99 499 500+ ATE LIC GOVT -EAST SOUTH WEST WEST 0-74% 75-84% 85%+ YRS YRS YRS YRS A/B C/D/F ----- ----- ----- ----- ----- ----- ----- ----- ----- ----- ----- ----- ------ ----- ----- ----- ----- ----- ----- ----- BASE=TOTAL ASKED 404 112 123 169 210 77 117 61 129 138 76 108 79 169 45 61 144 135 233 168 100% 28% 30% 42% 52% 19% 29% 15% 32% 34% 19% 27% 20% 42% 11% 15% 36% 33% 58% 42% 10 197 54 63 80 104 34 59 26 61 69 41 60 34 80 19 22 73 72 102 93 -- 49% 48% 51% 47% 50% 44% 50% 43% 47% 50% 54% 56% 43% 47% 42% 36% 51% 53% 44% 55% 8-10 340 93 102 145 172 66 102 50 106 122 62 92 64 147 35 48 119 119 194 144 ---- 84% 83% 83% 86% 82% 86% 87% 82% 82% 88% 82% 85% 81% 87% 78% 79% 83% 88% 83% 86% 5-7 55 15 18 22 32 10 13 11 19 13 12 15 14 21 6 11 23 15 36 19 --- 14% 13% 15% 13% 15% 13% 11% 18% 15% 9% 16% 14% 18% 12% 13% 18% 16% 11% 15% 11% 1-4 9 4 3 2 6 1 2 - 4 3 2 1 1 1 4 2 2 1 3 5 --- 2% 4% 2% 1% 3% 1% 2% - 3% 2% 3% 1% 1% 1% 9% 3% 1% 1% 1% 3% 9 74 19 21 34 38 18 18 16 23 27 8 19 19 28 6 13 27 23 44 30 18% 17% 17% 20% 18% 23% 15% 26% 18% 20% 11% 18% 24% 17% 13% 21% 19% 17% 19% 18% 8 69 20 18 31 30 14 25 8 22 26 13 13 11 39 10 13 19 24 48 21 17% 18% 15% 18% 14% 18% 21% 13% 17% 19% 17% 12% 14% 23% 22% 21% 13% 18% 21% 13% 7 30 6 12 12 18 4 8 7 9 6 8 8 6 13 4 5 11 10 15 15 7% 5% 10% 7% 9% 5% 7% 11% 7% 4% 11% 7% 8% 8% 9% 8% 8% 7% 6% 9% 6 14 6 1 7 8 5 1 2 4 5 3 3 5 5 1 3 8 2 13 1 3% 5% 1% 4% 4% 6% 1% 3% 3% 4% 4% 3% 6% 3% 2% 5% 6% 1% 6% 1% 5 11 3 5 3 6 1 4 2 6 2 1 4 3 3 1 3 4 3 8 3 3% 3% 4% 2% 3% 1% 3% 3% 5% 1% 1% 4% 4% 2% 2% 5% 3% 2% 3% 2% 4 2 2 - - 2 - - - - 2 - - - - 2 - - - 1 1 - 2% - - 1% - - - - 1% - - - - 4% - - - - 1% 3 3 - 2 1 1 - 2 - 1 - 2 1 1 - - 1 1 1 - 3 1% - 2% 1% - - 2% - 1% - 3% 1% 1% - - 2% 1% 1% - 2% 2 2 1 - 1 1 1 - - 1 1 - - - 1 2 - - - 2 - - 1% - 1% - 1% - - 1% 1% - - - 1% 4% - - - 1% - 1 2 1 1 - 2 - - - 2 - - - - - - 1 1 - - 1 - 1% 1% - 1% - - - 2% - - - - - - 2% 1% - - 1% MEAN 8.8 8.7 8.8 8.9 8.8 8.8 8.9 8.8 8.7 8.9 8.8 9.0 8.7 8.9 8.3 8.4 8.8 9.0 8.7 9.0 MEDIAN 9.0 9.0 10.0 9.0 9.0 9.0 10.0 9.0 9.0 9.5 10.0 10.0 9.0 9.0 9.0 9.0 10.0 10.0 9.0 10.0 P U B L I C O P I N I O N S T R A T E G I E S
- 20. WORKPLACE WELLNESS INITIATIVES STUDY / 12430 / SEPTEMBER 2012 PAGE 20 Table 7-2 QUESTION 4: Below are some issues that may be impacted by employee health behaviors and conditions. Please rate the importance of these issues in terms of overall organization priorities. 1 is Not Important At All To Your Organization, 10 is Extremely Important To Your Organization. Health insurance costs BANNER 2 WELLNESS ROLE OF IMPORTANT ISSUES (%10) HEALTH CONCERNS (COMBINED) - BENEFICIAL STATE/LOCAL GOVT ROLE OF FED GOVT ======================== =============================== ================= ================= ================= DECR LACK HIGH NOT INSU- PROD- WORK- OBES- STRESS OF CHRON BLOOD VERY/ MORE LESS NO MORE LESS NO RANCE UCTI- ABSEN- ERS ITY/ /MEN- FIT- DIS- PRE- AT ACT- ACT- CHAN- ACT- ACT- CHAN- TOTAL COSTS VITY TEEISM COMP WEIGHT TAL NESS EASE SSURE VERY SMWT ALL IVE IVE GE IVE IVE GE ----- ----- ----- ------ ----- ------ ------ ----- ----- ----- ----- ----- ----- ----- ----- ----- ----- ----- ----- BASE=TOTAL ASKED 404 197 139 119 110 211 206 205 133 136 153 198 51 184 60 147 152 79 156 100% 49% 34% 29% 27% 52% 51% 51% 33% 34% 38% 49% 13% 46% 15% 36% 38% 20% 39% 10 197 197 104 85 89 105 108 103 67 57 93 88 15 92 27 68 75 38 72 -- 49% 100% 75% 71% 81% 50% 52% 50% 50% 42% 61% 44% 29% 50% 45% 46% 49% 48% 46% 8-10 340 197 128 106 104 180 175 169 113 120 134 170 35 149 51 128 124 69 132 ---- 84% 100% 92% 89% 95% 85% 85% 82% 85% 88% 88% 86% 69% 81% 85% 87% 82% 87% 85% 5-7 55 - 8 10 5 23 29 30 18 15 16 24 14 30 9 16 26 10 17 --- 14% - 6% 8% 5% 11% 14% 15% 14% 11% 10% 12% 27% 16% 15% 11% 17% 13% 11% 1-4 9 - 3 3 1 8 2 6 2 1 3 4 2 5 - 3 2 - 7 --- 2% - 2% 3% 1% 4% 1% 3% 2% 1% 2% 2% 4% 3% - 2% 1% - 4% 9 74 - 18 14 9 39 30 35 27 32 19 48 7 30 13 30 27 16 29 18% - 13% 12% 8% 18% 15% 17% 20% 24% 12% 24% 14% 16% 22% 20% 18% 20% 19% 8 69 - 6 7 6 36 37 31 19 31 22 34 13 27 11 30 22 15 31 17% - 4% 6% 5% 17% 18% 15% 14% 23% 14% 17% 25% 15% 18% 20% 14% 19% 20% 7 30 - 8 7 3 15 16 13 11 8 10 12 8 17 5 8 15 5 10 7% - 6% 6% 3% 7% 8% 6% 8% 6% 7% 6% 16% 9% 8% 5% 10% 6% 6% 6 14 - - - 1 5 10 10 4 4 3 9 2 7 2 5 5 3 5 3% - - - 1% 2% 5% 5% 3% 3% 2% 5% 4% 4% 3% 3% 3% 4% 3% 5 11 - - 3 1 3 3 7 3 3 3 3 4 6 2 3 6 2 2 3% - - 3% 1% 1% 1% 3% 2% 2% 2% 2% 8% 3% 3% 2% 4% 3% 1% 4 2 - 1 1 - 1 - 1 - 1 - 1 1 1 - 1 - - 2 - - 1% 1% - - - - - 1% - 1% 2% 1% - 1% - - 1% 3 3 - 1 1 1 3 1 3 - - 1 2 - 3 - - 1 - 2 1% - 1% 1% 1% 1% - 1% - - 1% 1% - 2% - - 1% - 1% 2 2 - - - - 2 1 1 2 - 1 1 - 1 - 1 1 - 1 - - - - - 1% - - 2% - 1% 1% - 1% - 1% 1% - 1% 1 2 - 1 1 - 2 - 1 - - 1 - 1 - - 1 - - 2 - - 1% 1% - 1% - - - - 1% - 2% - - 1% - - 1% MEAN 8.8 10.0 9.5 9.3 9.6 8.8 8.9 8.8 8.9 8.9 9.1 8.8 8.0 8.8 8.9 8.8 8.8 8.9 8.7 MEDIAN 9.0 10.0 10.0 10.0 10.0 9.0 10.0 10.0 10.0 9.0 10.0 9.0 8.0 9.5 9.0 9.0 9.0 9.0 9.0 P U B L I C O P I N I O N S T R A T E G I E S
- 21. WORKPLACE WELLNESS INITIATIVES STUDY / 12430 / SEPTEMBER 2012 PAGE 21 Table 7-3 QUESTION 4: Below are some issues that may be impacted by employee health behaviors and conditions. Please rate the importance of these issues in terms of overall organization priorities. 1 is Not Important At All To Your Organization, 10 is Extremely Important To Your Organization. Health insurance costs BANNER 3 ------------------- AMONG THOSE WITH WELLNESS INITIATIVE --------------------- HAVE WELLNESS % OF YEARS FINANCIAL EMPLOYEE ACCESS INITATIVE OPERATING BUDGET IN OPERATION INCENTIVE ROI TO INITIATIVE =========== ================= ================= =========== =========== ================== 6% OR 1-2 3-4 5+ TOTAL YES NO 0-1% 2-5% MORE YRS YRS YRS YES NO YES NO 0-74% 75-84% 85%+ ----- ----- ----- ----- ----- ----- ----- ----- ----- ----- ----- ----- ----- ----- ------ ----- BASE=TOTAL ASKED 404 223 181 78 64 26 72 43 90 111 110 90 124 19 13 172 100% 55% 45% 35% 29% 12% 32% 19% 40% 50% 49% 40% 56% 9% 6% 77% 10 197 112 85 34 33 14 42 23 39 60 52 47 59 15 5 80 -- 49% 50% 47% 44% 52% 54% 58% 53% 43% 54% 47% 52% 48% 79% 38% 47% 8-10 340 188 152 63 53 23 61 37 75 97 90 78 102 17 9 144 ---- 84% 84% 84% 81% 83% 88% 85% 86% 83% 87% 82% 87% 82% 89% 69% 84% 5-7 55 33 22 14 11 2 10 6 14 14 19 12 21 2 4 26 --- 14% 15% 12% 18% 17% 8% 14% 14% 16% 13% 17% 13% 17% 11% 31% 15% 1-4 9 2 7 1 - 1 1 - 1 - 1 - 1 - - 2 --- 2% 1% 4% 1% - 4% 1% - 1% - 1% - 1% - - 1% 9 74 35 39 16 7 4 10 8 13 19 16 15 19 1 2 31 18% 16% 22% 21% 11% 15% 14% 19% 14% 17% 15% 17% 15% 5% 15% 18% 8 69 41 28 13 13 5 9 6 23 18 22 16 24 1 2 33 17% 18% 15% 17% 20% 19% 13% 14% 26% 16% 20% 18% 19% 5% 15% 19% 7 30 18 12 9 6 - 7 4 6 8 10 5 13 2 2 14 7% 8% 7% 12% 9% - 10% 9% 7% 7% 9% 6% 10% 11% 15% 8% 6 14 9 5 4 3 - 1 2 5 4 5 5 4 - 1 7 3% 4% 3% 5% 5% - 1% 5% 6% 4% 5% 6% 3% - 8% 4% 5 11 6 5 1 2 2 2 - 3 2 4 2 4 - 1 5 3% 3% 3% 1% 3% 8% 3% - 3% 2% 4% 2% 3% - 8% 3% 4 2 1 1 1 - - 1 - - - 1 - 1 - - 1 - - 1% 1% - - 1% - - - 1% - 1% - - 1% 3 3 - 3 - - - - - - - - - - - - - 1% - 2% - - - - - - - - - - - - - 2 2 - 2 - - - - - - - - - - - - - - - 1% - - - - - - - - - - - - - 1 2 1 1 - - 1 - - 1 - - - - - - 1 - - 1% - - 4% - - 1% - - - - - - 1% MEAN 8.8 8.9 8.7 8.8 8.9 8.7 9.0 9.1 8.7 9.1 8.8 9.0 8.8 9.5 8.4 8.8 MEDIAN 9.0 10.0 9.0 9.0 10.0 10.0 10.0 10.0 9.0 10.0 9.0 10.0 9.0 10.0 9.0 9.0 P U B L I C O P I N I O N S T R A T E G I E S
- 22. WORKPLACE WELLNESS INITIATIVES STUDY / 12430 / SEPTEMBER 2012 PAGE 22 Table 8-1 QUESTION 5: Below are some issues that may be impacted by employee health behaviors and conditions. Please rate the importance of these issues in terms of overall organization priorities. 1 is Not Important At All To Your Organization, 10 is Extremely Important To Your Organization. Absenteeism BANNER 1 ORG HEALTH ORGANIZATION SIZE PROFIT STATUS REGION EMPLOYEES W/ CARE YEARS IN OPERATION GRADE ================= ================= ======================= ================== ======================= =========== NON- 100- PRIV- PUB- PROF/ NORTH MID- 0-10 11-20 21-50 51+ TOTAL 1-99 499 500+ ATE LIC GOVT -EAST SOUTH WEST WEST 0-74% 75-84% 85%+ YRS YRS YRS YRS A/B C/D/F ----- ----- ----- ----- ----- ----- ----- ----- ----- ----- ----- ----- ------ ----- ----- ----- ----- ----- ----- ----- BASE=TOTAL ASKED 401 111 123 167 207 77 117 61 128 137 75 107 78 169 45 58 143 135 230 169 100% 28% 31% 42% 52% 19% 29% 15% 32% 34% 19% 27% 19% 42% 11% 14% 36% 34% 57% 42% 10 120 36 33 51 61 17 42 16 34 46 24 30 22 53 13 13 39 48 67 53 -- 30% 32% 27% 31% 29% 22% 36% 26% 27% 34% 32% 28% 28% 31% 29% 22% 27% 36% 29% 31% 8-10 278 75 78 125 140 55 83 44 84 97 53 81 49 115 29 38 101 94 159 119 ---- 69% 68% 63% 75% 68% 71% 71% 72% 66% 71% 71% 76% 63% 68% 64% 66% 71% 70% 69% 70% 5-7 92 21 36 35 48 18 26 14 32 31 15 18 23 40 10 14 31 33 50 40 --- 23% 19% 29% 21% 23% 23% 22% 23% 25% 23% 20% 17% 29% 24% 22% 24% 22% 24% 22% 24% 1-4 31 15 9 7 19 4 8 3 12 9 7 8 6 14 6 6 11 8 21 10 --- 8% 14% 7% 4% 9% 5% 7% 5% 9% 7% 9% 7% 8% 8% 13% 10% 8% 6% 9% 6% 9 83 20 24 39 46 21 16 16 26 26 15 27 13 32 7 11 38 23 51 32 21% 18% 20% 23% 22% 27% 14% 26% 20% 19% 20% 25% 17% 19% 16% 19% 27% 17% 22% 19% 8 75 19 21 35 33 17 25 12 24 25 14 24 14 30 9 14 24 23 41 34 19% 17% 17% 21% 16% 22% 21% 20% 19% 18% 19% 22% 18% 18% 20% 24% 17% 17% 18% 20% 7 44 6 18 20 21 11 12 8 18 10 8 8 11 17 7 6 10 18 24 19 11% 5% 15% 12% 10% 14% 10% 13% 14% 7% 11% 7% 14% 10% 16% 10% 7% 13% 10% 11% 6 25 8 11 6 14 4 7 5 7 12 1 6 7 11 3 7 7 7 14 11 6% 7% 9% 4% 7% 5% 6% 8% 5% 9% 1% 6% 9% 7% 7% 12% 5% 5% 6% 7% 5 23 7 7 9 13 3 7 1 7 9 6 4 5 12 - 1 14 8 12 10 6% 6% 6% 5% 6% 4% 6% 2% 5% 7% 8% 4% 6% 7% - 2% 10% 6% 5% 6% 4 8 3 3 2 4 2 2 1 1 3 3 3 - 4 1 1 4 2 4 4 2% 3% 2% 1% 2% 3% 2% 2% 1% 2% 4% 3% - 2% 2% 2% 3% 1% 2% 2% 3 8 4 2 2 5 1 2 1 3 3 1 3 3 1 2 1 2 3 4 4 2% 4% 2% 1% 2% 1% 2% 2% 2% 2% 1% 3% 4% 1% 4% 2% 1% 2% 2% 2% 2 10 5 4 1 7 - 3 1 6 1 2 2 3 5 1 3 4 2 9 1 2% 5% 3% 1% 3% - 3% 2% 5% 1% 3% 2% 4% 3% 2% 5% 3% 1% 4% 1% 1 5 3 - 2 3 1 1 - 2 2 1 - - 4 2 1 1 1 4 1 1% 3% - 1% 1% 1% 1% - 2% 1% 1% - - 2% 4% 2% 1% 1% 2% 1% MEAN 8.0 7.7 7.9 8.3 7.9 8.1 8.1 8.2 7.8 8.1 8.0 8.1 7.8 7.9 7.7 7.7 8.0 8.2 7.9 8.1 MEDIAN 9.0 9.0 8.0 9.0 9.0 8.0 8.0 9.0 8.0 9.0 9.0 9.0 8.0 9.0 8.0 8.0 9.0 9.0 9.0 9.0 P U B L I C O P I N I O N S T R A T E G I E S
- 23. WORKPLACE WELLNESS INITIATIVES STUDY / 12430 / SEPTEMBER 2012 PAGE 23 Table 8-2 QUESTION 5: Below are some issues that may be impacted by employee health behaviors and conditions. Please rate the importance of these issues in terms of overall organization priorities. 1 is Not Important At All To Your Organization, 10 is Extremely Important To Your Organization. Absenteeism BANNER 2 WELLNESS ROLE OF IMPORTANT ISSUES (%10) HEALTH CONCERNS (COMBINED) - BENEFICIAL STATE/LOCAL GOVT ROLE OF FED GOVT ======================== =============================== ================= ================= ================= DECR LACK HIGH NOT INSU- PROD- WORK- OBES- STRESS OF CHRON BLOOD VERY/ MORE LESS NO MORE LESS NO RANCE UCTI- ABSEN- ERS ITY/ /MEN- FIT- DIS- PRE- AT ACT- ACT- CHAN- ACT- ACT- CHAN- TOTAL COSTS VITY TEEISM COMP WEIGHT TAL NESS EASE SSURE VERY SMWT ALL IVE IVE GE IVE IVE GE ----- ----- ----- ------ ----- ------ ------ ----- ----- ----- ----- ----- ----- ----- ----- ----- ----- ----- ----- BASE=TOTAL ASKED 401 196 139 120 108 208 205 202 132 136 151 198 50 183 59 146 150 78 155 100% 49% 35% 30% 27% 52% 51% 50% 33% 34% 38% 49% 12% 46% 15% 36% 37% 19% 39% 10 120 85 98 120 76 62 56 62 45 33 59 50 10 64 12 37 51 19 41 -- 30% 43% 71% 100% 70% 30% 27% 31% 34% 24% 39% 25% 20% 35% 20% 25% 34% 24% 26% 8-10 278 155 134 120 95 140 142 139 86 91 115 134 28 128 41 99 109 48 106 ---- 69% 79% 96% 100% 88% 67% 69% 69% 65% 67% 76% 68% 56% 70% 69% 68% 73% 62% 68% 5-7 92 29 2 - 9 55 49 44 36 34 26 52 14 45 10 34 31 21 37 --- 23% 15% 1% - 8% 26% 24% 22% 27% 25% 17% 26% 28% 25% 17% 23% 21% 27% 24% 1-4 31 12 3 - 4 13 14 19 10 11 10 12 8 10 8 13 10 9 12 --- 8% 6% 2% - 4% 6% 7% 9% 8% 8% 7% 6% 16% 5% 14% 9% 7% 12% 8% 9 83 42 22 - 16 40 48 41 22 32 27 51 5 34 17 30 29 18 32 21% 21% 16% - 15% 19% 23% 20% 17% 24% 18% 26% 10% 19% 29% 21% 19% 23% 21% 8 75 28 14 - 3 38 38 36 19 26 29 33 13 30 12 32 29 11 33 19% 14% 10% - 3% 18% 19% 18% 14% 19% 19% 17% 26% 16% 20% 22% 19% 14% 21% 7 44 11 - - 4 28 18 21 22 15 9 25 10 20 7 14 15 10 17 11% 6% - - 4% 13% 9% 10% 17% 11% 6% 13% 20% 11% 12% 10% 10% 13% 11% 6 25 6 1 - 3 15 16 9 10 11 8 14 3 13 2 10 9 6 10 6% 3% 1% - 3% 7% 8% 4% 8% 8% 5% 7% 6% 7% 3% 7% 6% 8% 6% 5 23 12 1 - 2 12 15 14 4 8 9 13 1 12 1 10 7 5 10 6% 6% 1% - 2% 6% 7% 7% 3% 6% 6% 7% 2% 7% 2% 7% 5% 6% 6% 4 8 4 1 - 1 7 1 6 3 3 3 3 2 2 3 3 4 2 2 2% 2% 1% - 1% 3% - 3% 2% 2% 2% 2% 4% 1% 5% 2% 3% 3% 1% 3 8 3 1 - 2 4 3 5 - 2 1 4 2 3 2 3 1 3 4 2% 2% 1% - 2% 2% 1% 2% - 1% 1% 2% 4% 2% 3% 2% 1% 4% 3% 2 10 3 1 - - 1 6 7 3 5 4 5 1 4 1 5 5 1 4 2% 2% 1% - - - 3% 3% 2% 4% 3% 3% 2% 2% 2% 3% 3% 1% 3% 1 5 2 - - 1 1 4 1 4 1 2 - 3 1 2 2 - 3 2 1% 1% - - 1% - 2% - 3% 1% 1% - 6% 1% 3% 1% - 4% 1% MEAN 8.0 8.5 9.4 10.0 9.2 8.0 7.9 7.9 8.0 7.8 8.3 8.0 7.2 8.1 7.7 7.8 8.2 7.6 7.9 MEDIAN 9.0 9.0 10.0 10.0 10.0 8.0 9.0 9.0 9.0 8.0 9.0 9.0 8.0 9.0 8.0 8.0 9.0 8.0 8.0 P U B L I C O P I N I O N S T R A T E G I E S