Citymatter: UX / UI Design
•
1 recomendación•400 vistas

Citymatter is a media start-up designed to improve engagement and connections between citizens, their cities, and their local governments. To do this, it aggregates local data from open government portals, private databases, APIs, and media content. I developed this concept during my 2014-15 Knight Fellowship at Stanford University.

Recomendados
Más contenido relacionado
La actualidad más candente
La actualidad más candente (20)
Destacado
Destacado (16)
Similar a Citymatter: UX / UI Design
Similar a Citymatter: UX / UI Design (20)
Último
Último (20)
Citymatter: UX / UI Design
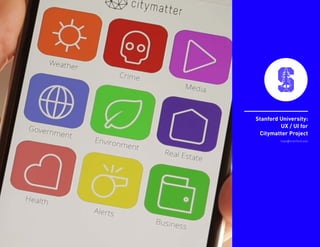
- 1. lope@stanford.edu Stanford University: UX / UI for Citymatter Project
- 2. Citymatter: UX / UI Design Background Info: Citymatter is a media start-up designed to improve engagement and connections between citizens, their cities, and their local governments. To do this, it aggregates local data from open government portals, private databases, APIs, and media content. I developed this concept during my 2014-15 Knight Fellowship at Stanford University. The project was human-centered in nature, and it started with a very simple question: what do people want to know about their cities? What information helps people feel connected with their surroundings? Over the spring quarter of my year at Stanford I tested my research by running UX, UI, and prototyping experiments – I called this series the “Citymatter Design Sprint”. Goals: My mission was to find what data was interesting and useful for citizens of San Francisco, how to showcase it (and how to wrangle the chaos of available data), and lastly, figure out why people should choose to return to a platform like Citymatter on a regular basis – in other words, figuring out how to keep people engaged with local issues using data as media. Challenge: How might we transform the information trapped in databases into an engaging experience that enriches local, civic life? *images from a meeting with citizens of the Bay Area, to learn about how they access and use local data.
- 3. Process: 1) During the user research phase I ran a series of interviews in person, over the phone, and over video-conference with citizens of the city of San Francisco. These interviews consisted of open-ended questions about the city, data, and their personal interests and daily routines to access underlying information gaps. I then held group conversations, panels, online polls (via SurveyMonkey), and ran experiments using quick, low-fidelity prototypes (i.e. about a million Post-Its). 2) I collected and classified participant input and cross- referenced answers with several “Quality of Life” indexes: the World Bank, Inter-American Development Bank, UN-Habitat, ISO, etc. Seven category clusters emerged: crime, government, real estate, environ- ment, health, business, and media. These categories were kept broad in order to house variety, analyzing and displaying information culled from many different sources and databases, both public and private, 3) I then analyzed UX / UI design models for two kinds of platforms to determine best practices: a) Local news aggregators such as Google News, Patch, and NextDoor. b) Open government solutions such as Socrata, Granicus, Accela, IBM Smarter Cities and SeeClickFix. 4) Finally, I designed and launched a simple informational website at citymatter.co. At the same time I began collecting data from local open government portals, private companies, digital media outlets and social platforms using open APIs, in preparation for prototype development.
- 4. Results: The “Citymatter Design Sprint” took place on the Spring of 2015, when we developed a functioning interactive prototype for San Francisco. The application displayed data from a limited number of categories, and included an additional weather tool. As a result of our user research, information for each section was organized into modules: 1) A "data central" that displayed a single metric, and was updated in real time. This data changed daily within the same category to provide a tridimensional perspective about the general topic. For example, the "real estate" category could show the number of houses sold, new office space available, or current projects being built in the city. 2) A local media feed, specific to the category. News items were aggregated from up to 50 news sources and 100+ social media accounts. They were then organized by relevance. Users could mark items as read in order to keep the local feed up-to-date, or could share individual stories using social media tools. 3) Trend and analysis by category. It was designed to be a real-time display where we would be able to add language and insights later on top of it (it was slated for the beta prototype). In other words, a tool to move from graphs and charts to human phrases such as "trends indicate an uptick in burglaries at the end of every summer – remember to lock your garage". This alpha prototype has been presented publicly at Google, IBM, Facebook, Stanford University and other organizations, spurring a debate on the future of local media and government data, and the role of human vs algorithmic solutions for local engagement. Role(s): UX / UI Creative Direction Project Management