Infographic - Charitable Giving In Australia
•
4 recomendaciones•1,077 vistas

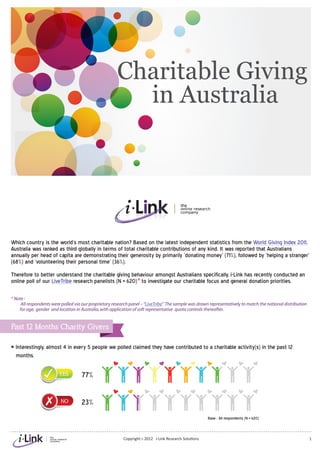
Which country is the world's most charitable nation? Based on the latest independent statistics from the World Giving Index 2011, Australia was ranked as third globally in terms of total charitable contributions of any kind. It was reported that Australians annually per head of capita are demonstrating their generosity by primarily 'donating money' (71%), followed by 'helping a stranger' (68%) and 'volunteering their personal time' (36%). Therefore to better understand the charitable giving behaviour amongst Australians specifically, i-Link has recently conducted an online poll of our LiveTribe research panelists (N = 620) to investigate our charitable focus and general donation priorities.

Recomendados
Recomendados
Más contenido relacionado
Último
Último (20)
Destacado
Destacado (20)
Infographic - Charitable Giving In Australia
- 1. Charitable Giving in Australia Which country is the world’s most charitable nation? Based on the latest independent statistics from the World Giving Index 2011, Australia was ranked as third globally in terms of total charitable contributions of any kind. It was reported that Australians annually per head of capita are demonstrating their generosity by primarily ‘donating money’ (71%), followed by ‘helping a stranger’ (68%) and ‘volunteering their personal time’ (36%). Therefore to better understand the charitable giving behaviour amongst Australians specifically, i-Link has recently conducted an online poll of our LiveTribe research panelists (N = 620)* to investigate our charitable focus and general donation priorities. * Note : All respondents were polled via our proprietary research panel – “LiveTribe” The sample was drawn representatively to match the national distribution . for age, gender and location in Australia, with application of soft representative quota controls thereafter. Past 12 Months Charity Givers > Interestingly, almost 4 in every 5 people we polled claimed they have contributed to a charitable activity(s) in the past 12 months. YES 77% NO 23% Base : All respondents (N = 620) Copyright c 2012 i-Link Research Solutions 1
- 2. Australian Charitable Giving > According to our LiveTribe poll, the majority of Australians (72%) showed their generosity via direct financial contributions. > However other ways of donating were: used items (50%), *donating reward points via online research activities (31%), purchasing of charitable merchandise (28%) and volunteering of ones personal time or support (19%). Financial Contributions (72%) > Monetary payments (cash, debit/credit card, cheque, online money transfers, etc.) – 71% 1 > Payroll giving – 3% Gift Contributions (57%) > Donate used items - clothing, books, furniture, household goods, etc – 50% 2 > Purchase merchandise from a charity shop or online catalogue – 28% 4 > With gifts in kind – 3% > Send a donation e-card – 3% Participating in Charitable Activities (39%) > Offer volunteer services to a charitable organisation – 19% 5 > Help in fundraising activities – 17% > Attend a charity event – 16% > Help to raise awareness for the charities or causes you wish to support through social media – 7% > Join as a member to receive latest news about the charity events and causes – 6% *Donate Reward Points Earned from Online Research Activities (31%) > By participating in online surveys – 30% 3 > By participating in online discussion groups – 3% Base : P12M Charity Givers (n = 478) * Note : This poll data was collected via our LiveTribe research only panel. Upon completing an online survey, LiveTribe offers all our members an option to donate their member rewards directly to one of our partner charity organisations. Thus, the proportion of people reported here that donate via online research activities will not be reflective of the general Australian public and is specific to those who are members of an online research only panel. How often do people support a charity? > Very frequently it appears, once a month or more through financial contribution (32%) and/or donating their member reward points via online research activities (35%). > Another way of showing their support is by contributing gifts, which was reported at 2 – 3 times a year (37%). Once a month or more Once every two months 4-5 times a year 2-3 times a year Once a year Less often Don’t Know/Prefer not to say 32% 9% 19% 24% 13% 2%1% (n=342) 15% 8% 21% 37% 14% 4% 2% (n=274) 28% 8% 19% 23% 14% 6% 2% (n=185) 35% 11% 14% 22% 9% 5% 5% (n=147) 0% 20% 40% 60% 80% 100% Copyright c 2012 i-Link Research Solutions 2
- 3. Charitable causes supported in the past 12 months Children Cancer Disaster relief/ Children Disaster relief/ Animal Environmental Disaster relief/ 48% 45% humanitarian aid 46% humanitarian aid Welfare Protection humanitarian aid 41% 38% 41% 37% 35% 31% 22% Animal welfare 14% 41% 45% Cancer 32% 35% 29% 48% Children 33% 46% 24% 23% Disability 23% 19% 14% 41% Drugs relief/Humanitarian aid 38% 27% 35% 2% Drugs/Alcohol 3% 5% 1% 12% Environmental Protection 11% 10% 37% 28% Health-related/Diseases 20% 21% 20% 4% HIV/AIDs 4% 4% 5% 15% Youth wellbeing/Welfare 19% 21% 6% 0% 10% 20% 30% 40% 50% 60% Financial contributions (n=342) Gift contributions (n=274) Participating in charitable activities (n=185) Donate reward points via online research activities (n=147) Copyright c 2012 i-Link Research Solutions 3
- 4. Future charitable giving > 9 in 10 Australians indicated they will continue to contribute to charities of their choice over the next 12 months. Base : All respondents (N = 620) Charitable causes willing to support in the next 12 months > Looking forward, Australians are planning to support causes that involve children (84%), cancer (84%), health-related / diseases (82%) and disaster relief / humanitarian aid (81%). > The majority of givers indicated they will also maintain their current focus and level of contributions over the next 12 months. Children 84% Cancer Health-Related/Diseases 84% 82% Disaster relief Disability 81% 78% Youth wellbing/ Animal welfare welfare 74% 71% Environmental Drugs/Alcohol protection 62% 67% HIV/AIDs 60% More About the same Less Not at all Don’t know Children 11% 66% 7% 7% 9% Cancer 11% 65% 7% 8% 8% Disaster relief 6% 63% 12% 8% 11% Health-related/Diseases 6% 67% 9% 9% 9% Disability 7% 60% 11% 11% 11% Youth wellbeing/Welfare 6% 55% 10% 16% 13% Animal welfare 7% 57% 10% 18% 8% Environmental Protection 6% 50% 12% 21% 12% Drugs/Alcohol 2% 45% 15% 26% 12% HIV/AIDs 3% 46% 11% 27% 13% 0% 20% 40% 60% 80% 100% Base : Planned Charity Givers (n = 559) Copyright c 2012 i-Link Research Solutions 4
- 5. Who is more generous? > Specifically when it comes to “general volunteering” or “the giving of used items”, it appears that females tend to score more highly than their male counterparts : 43% Donate used items – clothing, books, furniture, household goods, etc 56% 15% Offering of volunteer services (free time) 23% 4% Helping to raise awareness of charitable 9% causes via social media Males (n=222) Females (n=256) > The below illustration highlights the apparent differences amongst the sexes in terms of the various types of charitable donations we have been analysing so far : Animal Welfare Children Disability Youth wellbeing/ Youth wellbeing/ welfare welfare 22% 40% 29% 26% 27% 39% 50% 19% 14% 15% Copyright c 2012 i-Link Research Solutions 5
- 6. Charitable donations by life-stage – LiveTribe Members > Of those LiveTribe members who chose to donate their reward points arising from an online research activity, it appears the Gen Y’s are most likely to show their support in this way. > However in terms of volunteering of their personal time, it appears the older age groups (66-85yrs) were more active in this regard. 39% 28% Donate reward points 29% via online surveys 27% 17% 14% Participated Offer volunteer services 21% Once a month or more 28% Gen Y Gen X Baby Silent GenY : 18-29y.o. (n=87) Boomer Generation Age 18–29 Age 30–46 Age 47–65 Age 66–85 GenX : 30-46y.o. (n=155) Baby Boomer : 47-65y.o. (n=148) 15% 15% 29% 54% Silent Generation : 66-85y.o. (n=88) > Based on our observations, there were some variation in the type of charitable causes that each generational group seem to be more passionate about : Environmental Protection Gen Y Age 18–29 Disability Cancer Disaster relief/ Gen X Health-related/diseases humanitarian Children Age 30–46 aid Youth wellbeing/welfare Silent Generation Age 66–85 Baby Boomer Age 47–65 Copyright c 2012 i-Link Research Solutions 6
- 7. > Below illustrates how each generation differs in terms of the charitable causes they tend to support: Gen Y Gen X Baby Boomer Silent Generation Age 18–29 Age 30–46 Age 47–65 Age 66–85 40% 41% 47% 54% Cancer 29% 28% 31% 43% 48% 51% 49% 28% Children 36% 41% 32% 21% 29% 16% 33% 17% 34% 21% 23% 17% 25% 21% 29% 13% Disability 21% 13% 25% 18% 18% 11% 20% 4% 35% 43% 34% 52% 33% 37% 36% 51% Disaster relief/ humanitarian aid 15% 22% 32% 36% 18% 34% 40% 50% Environmental 18% Protection 14% 9% 8% Health-related/ diseases 18% 14% 20% 33% Youth wellbeing/ welfare 18% 19% 25% 18% The power of human kindness To cultivate a passion for charitable giving amongst Australians, it is important to understand their charitable behavior and values, understanding also how these are likely to change as they move between the different life stages. Along with other interesting everyday topics, i-Link will continue to track these changes and ensure our charitable reward options are in line with our members needs. Copyright c 2012 i-Link Research Solutions 7
- 8. About i-Link Research Solutions Founded in 2001, i-Link Research Solutions is a leader in online field and data collection services. An independent Australian owned and operated company, i-Link is accredited under ISO 20252 the international standard for social, opinion and market research and ISO 27001 standards for information security. i-Link’s services are second to none; providing our clients a full suite of online field services include project set up and management, survey scripting and deployment, recruitment, data collection and processing, analysis and reporting. Our extensive experience in conducting research online means we understand the nuances applicable to this medium. With dedicated teams in Sydney, Melbourne, Singapore and Kuala Lumpur we will assist you to deploy your project quickly and cost effectively. Our proprietary technology products and application used in data collection and management include an advanced survey system, overtime discussion groups, live interactive focus groups, panel management systems and online reporting, dashboards & web portals, and all are developed based on feedback from users and researchers like you. i-Link has access to over 1.2 million participants via our proprietary online consumer panel, LiveTribe, and through our worldwide network of partnerships. By utilising our system’s multilingual capabilities we can conduct research in most regions throughout the world. T: (61) 2 9262 7171 W: www.i-linkresearch.com E: sales@i-linkresearch.com About LiveTribe LiveTribe is an online community where members receive rewards, prizes and incentives for taking part in online research activities like surveys and discussion groups. LiveTribe is also a great place to interact with other like minded people who understand that their opinions count! LiveTribe is a perfect way for you to have your say so that companies understand what you think about their products and services. We've a whole host of activities for members: participate in surveys, live discussion groups, research blogs, forums and polls. Copyright c 2012 i-Link Research Solutions 8