The dark side of the Internet: Youth Internet victimization
•Descargar como PPTX, PDF•
1 recomendación•554 vistas


Recomendados
Recomendados
Más contenido relacionado
La actualidad más candente
La actualidad más candente (20)
Similar a The dark side of the Internet: Youth Internet victimization
Similar a The dark side of the Internet: Youth Internet victimization (20)
Más de Center for Innovative Public Health Research
Más de Center for Innovative Public Health Research (20)
Último
Último (20)
The dark side of the Internet: Youth Internet victimization
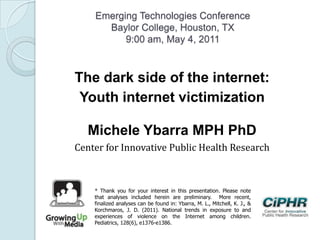
- 1. Emerging Technologies Conference Baylor College, Houston, TX 9:00 am, May 4, 2011 The dark side of the internet: Youth internet victimization Michele Ybarra MPH PhD Center for Innovative Public Health Research * Thank you for your interest in this presentation. Please note that analyses included herein are preliminary. More recent, finalized analyses can be found in: Ybarra, M. L., Mitchell, K. J., & Korchmaros, J. D. (2011). National trends in exposure to and experiences of violence on the Internet among children. Pediatrics, 128(6), e1376-e1386.
- 2. Roadmap Benefits of technology Risks of technology: ◦ Exposures Violent content X-rated material “Sexting” ◦ Experiences Bullying / harassment Unwanted sexual exposures Myths and truths about online risks
- 3. Benefits of technology Access to health information: About one in four adolescents have used the Internet to look for health information in the last year (Lenhart et al., 2001; Rideout et al., 2001; Ybarra & Suman, 2006). 41% of adolescents indicate having changed their behavior because of information they found online (Kaiser Family Foundation, 2002), and 14% have sought healthcare services as a result (Rideout, 2001). [Note: Recent data refute the claim that people are using the Internet to self-diagnose or self-medicate; the vast majority (70%) consult a health professional and 54% friends and families when
- 4. Benefits of technology Teaching healthy behaviors (as described by My Thai, Lownestein, Ching, Rejeski, 2009) Physical health: Dance Dance Revolution Healthy behaviors: Sesame Street‟s Color me Hungry (encourages eating vegetables) Disease Management: Re-Mission (teaches children with cancer about the disease)
- 5. Benefits of technology Social support for people with chronic disease: One in four (23%) of people with high blood pressure, diabetes, heart conditions, lung conditions, cancer etc have gone online to connect with others who also have the chronic disease (Fox, 2011)
- 6. Benefits of technology Cell phones seem to be playing a part in reducing the digital divide: Compared to 21% of white teens, 44% of Black and African American teens and 35% of Hispanic teens go online through their phones (Lenhart, Ling, Campbell, Purcell, 2010) With potential health implications: Black and African American adult cell phone owners are twice as likely as White adult cell phone owners to use mobile health applications (15% vs. 7% respectively; Fox, 2010)
- 7. Growing up with Media survey The data we will be discussing today largely come from the Growing up with Media survey: Longitudinal design: Fielded 2006, 2007, 2008 Data collected online National sample (United States) Households randomly identified from the 4 million- member Harris Poll OnLine (HPOL) Sample selection was stratified based on youth age and sex. Data were weighted to match the US population of adults with children between the ages of 10 and 15 years and adjust for the propensity of adult to be online and in the HPOL.
- 8. Funding and Collaborators The study was supported by Cooperative Agreement number U49/CE000206 from the Centers for Disease Control and Prevention (CDC). The contents of this presentation are solely the responsibility of the authors and do not necessarily represent the official views of the CDC. Collaborators who contributed to the planning and implementation of the study included: Dr. Dana Markow from Harris Interactive; Drs. Philip Leaf and Marie Diener-West from the Johns Hopkins Bloomberg School of Public Health; and Dr. Merle Hamburger from the CDC.
- 9. Eligibility criteria Youth: ◦ Between the ages of 10-15 years ◦ Use the Internet at least once in the last 6 months ◦ Live in the household at least 50% of the time ◦ English speaking Adult: ◦ Be a member of the Harris Poll Online (HPOL) opt-in panel ◦ Be a resident in the USA (HPOL has members internationally) ◦ Be the most (or equally) knowledgeable of the youth‟s media use in the home ◦ English speaking
- 10. Youth Demographic Characteristics 2006 (n=1,577) 2007 (n=1189) 2008 (n=1149) Female 50% 50% 51% Age (SE) 12.6 (0.05) 13.7 (0.05) 14.5 (0.05) Hispanic ethnicity 18% 17% 17% Race: White 70% 72% 72% Race: Black / African American 15% 13% 14% Race: Mixed race 7% 9% 9% Race: Other 8% 6% 6% Household less than $35,000 25% 24% 25% Internet use 1 hour+ per day 47% 49% 52%
- 12. Percent of youth exposed to violence online by website type 3% 4% 21% 19% 2% 3% 22% 16% 3% 4% 24% 15% 0% 5% 10% 15% 20% 25% 30% 35% 40% Hate sites Death sites War, 'terrorism' Cartoons sites Wave 1 Wave 2 Ybarra, Mitchell, Korchmaros (under review)
- 13. Odds of externalizing behavior given exposure to violence online 2.8 2.2 1.7 2.0 1.8 1.7 1.8 1.61.7 1.9 1.9 1.9 2.4 2.0 1.9 1.9 1.0 10.0 Hate sites Death sites War, death, 'terrorism'Cartoons engaging in violen Seriously violent behavior Delinquent behavior Offline aggression Technology-based aggression Data from Growing up with Media survey, Waves 1-3 (PI: Ybarra). Population – based odds (GEE) of reporting externalizing behavior given report of exposure to violence online. All odds ratios are statistically significant (p<0.001)
- 15. Exposure to sexual material online 42% of 12-17 year olds in one nationally representative survey report any exposure (wanted and unwanted) to x-rated material online (Wolak, Mitchell, & Finkelhor, 2007) 70% of 15-17 yr-old Internet users in another nationally representative survey reported accidentally viewing pornography online “very” or “somewhat” often (Rideout, 2001)
- 16. Percent of youth reporting unwanted exposure to x-rated material online 25% 34% 0% 5% 10% 15% 20% 25% 30% 35% 40% 2000 2005 Note that unwanted may not necessarily mean unintentional Wolak, Mitchell, Finkelhor, 2006
- 17. Challenges related to unwanted exposure 26% were very or extremely upset by the images 26% were very or extremely embarrassed 19% reported symptoms of extreme stress (e.g., avoidance of the computer, obsessive thinking about the event, feeling jumpy or irritable, loosing interest in things generally)
- 18. Percent of youth reporting wanted exposure to x-rated material online 8% 9% 11% 1% 1% 2% 0% 5% 10% 15% 20% 25% 30% 35% 40% Wave 1 Wave 2 Wave 3 Violent, x-rated websites Non-violent x-rated websites Data from the Growing up with Media survey; PI: Ybarra
- 19. Wanted exposure to nonviolent x- rated material online by age 0% 7% 7% 5% 1% 4% 8% 16% 13% 15% 0% 5% 10% 15% 20% 25% 30% 35% 40% 10 11 12 13 14 15 16 17 W1 non-violent W2 non-violent W3 non-violent Data from the Growing up with Media survey; PI: Ybarra
- 20. Wanted exposure to violent x-rated material online by age 1% 2% 0% 1%0% 1% 0% 0% 2% 2% 0% 5% 10% 15% 20% 25% 30% 35% 40% 10 11 12 13 14 15 16 17 W1 violent W2 violent W3 violent Data from the Growing up with Media survey; PI: Ybarra
- 21. Concurrent psychosocial problems related to wanted exposure In a longitudinal study of Dutch youth, exposure to sexually explicit Internet material stimulated sexual preoccupancy among adolescents 13-20- years old (Peter & Valkenburg, 2008). In a national study of 10-15 year olds (Ybarra, Mitchell, Hamburger, Diener- West, Leaf, 2010), intentional exposure to violent x-rated material online increased the odds of self-reported sexually aggressive behavior 8-fold. Exposure to non-violent x-rated material increased the odds of self- reported sexually aggressive behavior 2- fold.
- 22. Percent of youth reporting wanted exposure to x-rated material online 8% 10% 7% 9% 13% 16% 11% 10% 12% 1% 2% 3% 1% 0% 3% 2% 1% 2% 0% 5% 10% 15% 20% 25% 30% 35% 40% Violent Non-violent Data from the Growing up with Media survey; PI: Ybarra
- 24. Definition Definitions vary but questions generally refer to the creation and distribution of photos or videos with a sexual overtone using technology (e.g., a cell phone, email, social networking site, etc).
- 25. Involvement 20% of 13-19 year olds admit to sending / posting a nude / nearly nude picture of themselves through technology (e.g., IM, SNS; The National Campaign to Prevent Teen and Unplanned Pregnancy, 2008); 9% of 13-18 year olds admit to someone /posting via text message or email specifically, and 3% have forwarded one (Cox Communications, 2009) Between 17% (Cox Communications, 2009) and 31% (The National Campaign to Prevent Teen and Unplanned Pregnancy, 2008) have received a nude or semi-nude photo via technology
- 26. Involvement When text messaging is examined *specifically* 4% of 12-17 year olds admit to sending sexually suggestive nude or nearly nude photos or videos of themselves ◦ Boys and girls are equally likely to send a sexy picture ◦ 17 year olds are more likely than all younger ages to send a sexy picture 15% have received such a photo or image
- 27. Motivation From focus groups of teenagers, three reasons for „sexting‟ emerge (Lenhart et al., 2010): 1) Exchange between boyfriends / girlfriends 2) Exchange between boyfriends / girlfriends that are then shared with people outside of the relationship (e.g., break up; fight) 3) Exchange between people not yet in a relationship but where at least one hopes to initiate a relationship “These images are shared as a part of or instead of sexual activity, or as a way of starting or maintaining a relationship with a significant other. And they are also passed along to friends for their entertainment value, as a joke or for fun.” – Amanda Lenhart, Pew Internet & American Life Project
- 28. Consequences Psychosocial impact largely unknown Legal impact is being debated / determined through court cases in several states (see Pew study for a review)
- 30. Definition There is wide variability in the definition of harassment and bullying. Generally, it refers to an act of intentional aggression (e.g., “mean things”) towards someone else via technology (i.e., Internet, cell phone text messaging)
- 31. Context Girl, 12: “These people from school were calling me a prostitute and whore … and saying I was raped. [It happened] because I‟m an easy target. I didn‟t let it bother me until about a month ago and [then] I started getting physical with people.” Boy, 15: “I was playing a first person shooter game and unintentionally offended this person who became very serious and began to threaten me by saying if this was real life he would physically harm me. [It happened because he] was unable to accept this was just a game.” -Quotes from participants of the Youth Internet Safety Survey -2 (Finkelhor, Wolak, Mitchell, 2005)
- 32. Overlap between victimization and perpetration Not involved 62% Victim-only 18% Perpetrator- only 3% Perpetrator- victim 17% Internet harassment Average across Waves 1-3 of the Growing up with Media study (PI: Ybarra)
- 33. Involvement Depending on the measure used, most studies report between 20-40% of youth are targeted by bullying or harassment online and via text messaging (see Tokunaga, 2010 for a review).
- 34. Overlap between harassment and bullying Not involved 62% Cyberbully- only victim 1% Internet harassment- only victim 24% Cyberbully + Internet harassment victim 13% Average across Waves 2-3 of the Growing up with Media study (PI: Ybarra) (Cyberbully questions were added in Wave 2)
- 35. Cyberbully victimization by age across time Data from the Growing up with Media study, PI: Ybarra (Cyberbully questions were added in Wave 2) 0% 5% 10% 15% 20% 25% 30% 35% 40% 11 12 13 14 15 16 17 Wave 2 (34%) Wave 3 (39%)
- 36. Internet harassment victimization by age across time Data from the Growing up with Media study, PI: Ybarra 0% 10% 20% 30% 40% 50% 10 11 12 13 14 15 16 17 Wave 1 (33%) Wave 2 (34%) Wave 3 (39%)
- 37. Text messaging harassment victimization by age across time Data from the Growing up with Media study, PI: Ybarra (Text messaging-based harassment questions were added in Wave 2) 0% 5% 10% 15% 20% 25% 30% 35% 40% 11 12 13 14 15 16 17 Wave 2 (14%) Wave 3 (24%)
- 38. Distressing cyberbullying victimization Data from Wave 3 of the Growing up with Media study, PI: Ybarra Not victimized 86% Victim-not distressed 12% Victim - distressed 2% Cyberbullying
- 39. Distressing Internet harassment victimization (age constant:12-15 y.o.) 0% 5% 10% 15% 20% 25% 30% 35% 40% Rude / mean comments Rumors Threatening / aggressive comments 2006 2007 2008 Distress = very or extremely upset by the experience Data from the Growing up with Media study, PI: Ybarra
- 40. Distressing text messaging harassment victimization (age constant:12-15 y.o.) Data from Waves 2 and 3 of the Growing up with Media study, PI: Ybarra 86% 80% 10% 16% 4% 4% 0% 10% 20% 30% 40% 50% 60% 70% 80% 90% 100% Wave 2 Wave 3
- 41. Bullying victimization rates by environment 0% 5% 10% 15% 20% 25% 30% 35% 40% Every day / almost every day Once or twice a week Once or twice a month Less often School Internet Text messaging To and From school Somewhere else Data from the Growing up with Media study, PI: Ybarra
- 42. Distress related to bullying victimization rates by environment 0% 5% 10% 15% 20% 25% 30% 35% 40% Very/extremely upset by most memorable experience School Internet Text messaging To and From school Somewhere else Data from the Growing up with Media study, PI: Ybarra
- 43. Cyberbully perpetration by age across time Data from the Growing up with Media study, PI: Ybarra 0% 5% 10% 15% 20% 25% 30% 35% 40% 10 11 12 13 14 15 16 17 Wave 1 (21%) Wave 2 (19%) Wave 3 (23%)
- 44. Text messaging harassment perpetration by age across time Data from the Growing up with Media study, PI: Ybarra (Text messaging-based harassment questions were added in Wave 2) 0% 5% 10% 15% 20% 25% 30% 35% 40% 11 12 13 14 15 16 17 Wave 2 (10%) Wave 3 (16%)
- 46. Definition It usually refers to the following: Being asked to do something sexual when you don‟t want to Being asked to share personal sexual information when you don‟t want to Being asked to talk about sex when you don‟t want to It does not necessarily mean that youth are being solicited for sex.
- 47. Context Girl, 14: “I was chatting on the Internet and this guy just popped up in an Instant Message and started talking really dirty to me and saying things that I had never heard of before. He told me he was 30 years old and then he said, „LOL‟ (laugh out loud).” Boy, 11, who was playing an online game with a man, 20: “He asked me something personal, something about a man‟s privates.” -Quotes from participants of the Youth Internet Safety Survey -2 (Finkelhor, Wolak, Mitchell, 2005)
- 48. Overlap between victimization and perpetration Average across Waves 1-3 from the Growing up with Media study (PI: Ybarra) Not involved 84% Victim-only 13% Perpetrator- only 1% Perpetrator- victim 2% Unwanted sexual encounters
- 49. Unwanted sexual encounters victimization by age across time Data from the Growing up with Media study, PI: Ybarra 0% 5% 10% 15% 20% 25% 30% 35% 40% 10 11 12 13 14 15 16 17 Wave 1 (33%) Wave 2 (34%) Wave 3 (39%)
- 50. Very / extremely upset by the encounter – age constant (12-15 y.o.) 0% 5% 10% 15% 20% 25% 30% 35% 40% Talk about sex Sexual information Do something sexual 2006 2007 2008
- 51. Unwanted sexual experiences victimization by environment 0% 5% 10% 15% 20% 25% 30% 35% 40% Every day / almost every day Once or twice a week Once or twice a month Less often School Internet Average from Waves 2-3 from the Growing up with Media study (PI: Ybarra) (Questions about unwanted sexual experiences at school were added at W2)
- 52. Unwanted sexual encounter perpetration by age across time Data from the Growing up with Media study, PI: Ybarra 0% 5% 10% 15% 20% 25% 30% 35% 40% 10 11 12 13 14 15 16 17 Wave 1 (3%) Wave 2 (3%) Wave 3 (3%)
- 53. Concurrent psychosocial problems for victims Victims of harassment, bullying, and unwanted sexual experiences online are more likely to also report: Interpersonal victimization / bullying offline (Ybarra, Mitchell, Espelage, 2007; Ybarra, Mitchell, Wolak, Finkelhor, 2006; Ybarra, 2004) Alcohol use (Ybarra, Mitchell, Espelage, 2007) Social problems (Ybarra, Mitchell, Wolak, Finkelhor, 2006) Depressive symptomatology and suicidal ideation (Ybarra, 2004; Mitchell, Finkelhor, Wolak, 2000; The Berkman Center for Internet & Society, 2008; Hinduja & Patchin, in press) School behavior problems (Ybarra, Diener- West, Leaf, 2007) Poor caregiver-child relationships (Ybarra, Diener-
- 54. Concurrent psychosocial problems for perpetrators Perpetrators of harassment, bullying, and unwanted sexual experiences online are more likely to report: Interpersonal victimization and perpetration (bullying) offline (Ybarra, Mitchell, Espelage, 2007; Ybarra & Mitchell, 2007; Ybarra & Mitchell, 2004) Aggression / rule breaking (Ybarra, Mitchell, Espelage, 2007; Ybarra & Mitchell, 2007) Binge drinking (Ybarra, Mitchell, Espelage, 2007) Substance use (Ybarra, Mitchell, Espelage, 2007; Ybarra & Mitchell, 2007) Poor caregiver child relationship (Ybarra, Mitchell, Espelage, 2007; Ybarra & Mitchell, 2004; Ybarra & Mitchell, 2007) Low school commitment (Ybarra & Mitchell, 2004)
- 55. Myths and truths about online risks
- 56. Assumptions about Internet victimization experiences It‟s happening to everyone It‟s increasing over time It‟s getting nastier / kids are more affected The Internet is doing it
- 57. Research supporting and refuting assumptions about Internet victimization Assumption: Victimization is increasing Rates of victimization appear to be holding steady (and maybe in some cases decreasing) from 2006-2008 Assumption: Victimization is getting nastier At least as measured by rates of distress – victimization distress rates appear to be holding steady (and maybe in some cases decreasing) from 2006-2008
- 58. Research supporting and refuting assumptions about Internet victimization Assumption: Victims are always innocent The interplay between victimization and perpetration can sometimes be complex. These data suggest that victims are significantly more likely to also be perpetrators. It can be a two-way street. Assumption: the Internet is doing it The strong overlap between online and offline behaviors …and the fact that these kids are significantly more likely to have additional psychosocial problems Suggests that this is form of „old‟ behavior in a „new environment‟
- 59. Recap Victimization from negative online experiences and exposures is associated with psychological distress and negative mental health outcomes for some youth. The Internet is not the only medium through which youth are having these experiences and exposures. It is important to understand how technology is changing the lives of youth; and also to not forget that the Internet and cell phones are just pieces of a larger puzzle that youth must navigate successfully every day.
- 60. Takeaways As professionals we need to be able to sit with these two “competing” realities: We need to raise awareness about the impact that Internet victimization may have, including doing a better job of identifying youth negatively impacted and getting them into services (e.g., therapy). We also need to recognize that: ◦ The majority of youth are not being victimized online, ◦ The majority who are, are not seriously upset by it.
Notas del editor
- http://pewinternet.org/Reports/2011/P2PHealthcare.aspx
- http://pewinternet.org/Reports/2011/P2PHealthcare.aspx
- http://pewinternet.org/Reports/2010/Mobile-Health-2010.aspx
- Finkelhor, Wolak and Mitchell noted an increase in reports of wanted exposure among youth 10-15 years of age (8% in 2000 and 13% in 2005). Note that the question was changed to add more ‘context’. Nonetheless, fewer youth report going to these sites on purpose than by accident. It might be more socially acceptable to report unwanted vs. wanted exposure; it also is possible that unwanted exposures are so frequent that youth who might otherwise be curious are exposed and do not want further exposure.
- A quick aside: the Internet is not the most common exposure to x-rated material – including violent x-rated material
- http://www.thenationalcampaign.org/sextech/PDF/SexTech_Summary.pdfhttp://www.pewinternet.org/~/media//Files/Reports/2009/PIP_Teens_and_Sexting.pdf
- http://www.pewinternet.org/~/media//Files/Reports/2009/PIP_Teens_and_Sexting.pdf
- http://www.pewinternet.org/~/media//Files/Reports/2009/PIP_Teens_and_Sexting.pdf
- http://www.pewinternet.org/~/media//Files/Reports/2009/PIP_Teens_and_Sexting.pdf
- Similarly, data from the Youth Internet Safety Surveys 1 and 2 (Finkelhor, Mitchell, Wolak) suggest that about one in three victims of harassment are very or extremely upset by the experience
- As an aside, bullying is most common at school
- As an aside, internet is the least distressing type of bullying
- Youth Internet Safety Survey studies 1 and 2 also report that about one in three youth victims are very or extremely upset by the experience (Finkelhor, Wolak, Mitchell)
- As an aside, USE happens just as frequently at school