SlideShare una empresa de Scribd logo
1 de 17
X Variable 1 Line Fit Plot
     0.2

    0.15

     0.1

    0.05
                                                     Column G
Y


       0                                             Column B

    -0.05

     -0.1

    -0.15
      -10.00%   -5.00%   0.00%      5.00%   10.00%
                     X Variable 1
X Variable 1 Residual Plot
             0.2


            0.15


             0.1
Residuals


            0.05


               0


            -0.05


             -0.1
               -6.00%   -4.00%   -2.00%          0.00%             2.00%   4.00%   6.00%   8.00%
                                                    X Variable 1
Normal Probability Plot
     0.2


    0.15


     0.1


    0.05
Y


       0


    -0.05


     -0.1


    -0.15
            0   20   40             60         80   100   120
                           Sample Percentile
SUMMARY OUTPUT

Regression Statistics
Multiple R     0.57
R Square       0.32
Adjusted R Square
               0.31
Standard Error 0.05
Observations      59

 ANOVA
              df        SS       MS        F Significance F
 Regression         1    0.07     0.07     27.33        0
 Residual          57    0.15        0
 Total             58    0.22

           Coefficients
                    Standard Errort Stat   P-value Lower 95%Upper 95%
                                                                    Lower 95.0%
                                                                             Upper 95.0%
 Intercept           0     0.01      -0.01     0.99    -0.01     0.01    -0.01     0.01
 X Variable 1      1.4     0.27       5.23        0     0.86     1.93     0.86     1.93


 RESIDUAL OUTPUT                                PROBABILITY OUTPUT

Observation
          Predicted YResiduals
                          Standard Residuals    Percentile    Y
         1      0.02      0.11      2.15             0.85     -0.13
         2     -0.03      0.02      0.37             2.54     -0.11
         3      0.04     -0.08      -1.5             4.24     -0.08
         4         0      0.04      0.76             5.93     -0.08
         5     -0.03     -0.02     -0.46             7.63     -0.07
         6      0.05     -0.06      -1.1             9.32     -0.07
         7     -0.03     -0.01     -0.22            11.02     -0.06
         8      0.01      0.04      0.78            12.71     -0.06
         9         0      0.09      1.72            14.41     -0.05
       10       0.05      0.03      0.51             16.1     -0.04
       11       0.01      0.01      0.15             17.8     -0.04
       12       0.01      0.05      1.06            19.49     -0.04
       13       0.02     -0.04     -0.88            21.19     -0.04
       14       0.02     -0.02     -0.44            22.88     -0.04
       15      -0.04     -0.05     -0.91            24.58     -0.03
       16       0.04      0.04      0.88            26.27     -0.03
       17          0     -0.07     -1.44            27.97     -0.03
       18      -0.01     -0.07     -1.38            29.66     -0.02
       19       0.05         0     -0.09            31.36     -0.02
       20      -0.02     -0.02     -0.45            33.05     -0.02
       21       0.03      0.12      2.28            34.75     -0.01
       22      -0.02     -0.06     -1.14            36.44         0
       23       0.01      0.06      1.13            38.14         0
       24       0.04      0.07       1.3            39.83         0
       25      -0.04      0.06      1.11            41.53         0
       26      -0.07     -0.06     -1.19            43.22         0
       27       0.01         0     -0.02            44.92      0.01
       28       0.02         0         0            46.61      0.01
       29      -0.04         0     -0.02            48.31      0.02
30    0.04   -0.02   -0.45      50   0.02
31    0.06   -0.08   -1.62   51.69   0.02
32   -0.04   -0.02   -0.44   53.39   0.02
33    0.03   -0.01   -0.12   55.08   0.02
34   -0.05    0.15    3.06   56.78   0.02
35    0.02    0.04    0.82   58.47   0.02
36    0.03    0.07    1.49   60.17   0.02
37    0.05       0   -0.06   61.86   0.03
38    0.04   -0.03   -0.69   63.56   0.04
39    0.04       0   -0.03   65.25   0.04
40    0.05   -0.05   -1.02   66.95   0.04
41    0.03   -0.03   -0.54   68.64   0.04
42    0.04    0.01    0.29   70.34   0.05
43       0   -0.04   -0.83   72.03   0.05
44    0.05   -0.03   -0.69   73.73   0.05
45   -0.01    0.02    0.36   75.42   0.06
46    0.06   -0.02    -0.4   77.12   0.06
47    0.02   -0.04   -0.87   78.81   0.06
48    0.04    0.05    0.95   80.51   0.07
49    0.01    0.01    0.17    82.2   0.07
50    0.01   -0.03   -0.69    83.9   0.08
51    0.02   -0.05   -0.91   85.59   0.09
52    0.03   -0.05   -1.08   87.29   0.09
53       0    0.03    0.67   88.98    0.1
54   -0.06   -0.05   -0.98   90.68   0.11
55    0.03       0   -0.05   92.37   0.11
56    0.08    0.03    0.68   94.07   0.11
57    0.04    0.01    0.15   95.76   0.12
58     0.1    0.02     0.4   97.46   0.12
59   -0.03   -0.03   -0.54   99.15   0.14
RISK RETURN                                10


Current riskfree rate =      7.50%      Risk premium for stocks=        15.50%
Number of periods of data=       60     Riskfree rate during period =    8.50%
RISK RETURN                                                    11


Time period    Index Price(Stock)   DPS(Stock)   Split Factor       Index Level Return(Stock) Return(Mkt)
           1     1     INR 34.16     INR 0.04                   1      409.32      Infotech CNX S&P 500
           2     1     INR 38.42                                1      414.08       12.47%        1.16%
           3     1     INR 37.87                                1      404.35       -1.43%       -2.35%
           4     1     INR 36.42     INR 0.05                   1      415.53       -3.69%        2.76%
           5     1     INR 38.00                                1      416.98        4.34%        0.35%
           6     1     INR 36.13     INR 0.00                   1      409.17       -4.93%       -1.87%
           7     1     INR 36.00     INR 0.05                   1      424.81       -0.20%        3.82%
           8     1     INR 34.50                                1      415.54       -4.17%       -2.18%
           9     1     INR 36.25     INR 0.00                   1      418.90        5.07%        0.81%
          10     1     INR 39.38     INR 0.05                   1      419.23        8.77%        0.08%
          11     1     INR 42.18                                1      432.90        7.12%        3.26%
          12     1     INR 43.00     INR 0.00                   1      436.64        1.94%        0.87%
          13     1     INR 45.63     INR 0.05                   1      439.35        6.23%        0.62%
          14     1     INR 44.38                                1      444.76       -2.74%        1.23%
          15     1     INR 44.50     INR 0.00                   1      452.73        0.28%        1.79%
          16     1     INR 40.75     INR 0.06                   1      440.75       -8.29%       -2.65%
          17     1     INR 44.00                                1      451.93        7.98%        2.54%
          18     1     INR 40.75     INR 0.00                   1      451.51       -7.39%       -0.09%
          19     1     INR 37.50     INR 0.06                   1      448.72       -7.82%       -0.62%
          20     1     INR 39.25                                1      465.10        4.67%        3.65%
          21     1     INR 37.75     INR 0.00                   1      460.01       -3.82%       -1.09%
          22     1     INR 43.00     INR 0.06                   1      468.42       14.07%        1.83%
          23     1     INR 39.88                                1      463.37       -7.27%       -1.08%
          24     1     INR 42.63     INR 0.00                   1      467.37        6.90%        0.86%
          25     1     INR 47.25     INR 0.06                   1      482.29       11.00%        3.19%
          26     1     INR 48.00                                1      468.55        1.59%       -2.85%
          27     1     INR 42.00     INR 0.00                   1      446.80      -12.50%       -4.64%
          28     1     INR 42.50     INR 0.08                   1      451.48        1.37%        1.05%
          29     1     INR 43.38                                1      458.23        2.06%        1.50%
          30     1     INR 41.63     INR 0.00                   1      445.33       -4.03%       -2.82%
          31     1     INR 42.38     INR 0.08                   1      458.85        1.98%        3.04%
RISK RETURN                               12


32   1   INR 41.25                    1   477.02    -2.65%    3.96%
33   1   INR 38.75   INR 0.00         1   463.89    -6.06%   -2.75%
34   1   INR 39.50   INR 0.08         1   473.07     2.13%    1.98%
35   1   INR 43.50                    1   455.17    10.13%   -3.78%
36   1   INR 46.00   INR 0.00         1   460.41     5.75%    1.15%
37   1   INR 50.88   INR 0.08         1   471.17    10.76%    2.34%
38   1   INR 53.38                    1   488.74     4.91%    3.73%
39   1   INR 53.50   INR 0.00         1   501.75     0.23%    2.66%
40   1   INR 55.38   INR 0.09         1   515.45     3.67%    2.73%
41   1   INR 55.50                    1   535.24     0.23%    3.84%
42   1   INR 55.50   INR 0.00         1   545.78     0.00%    1.97%
43   1   INR 58.63   INR 0.09         1   562.81     5.79%    3.12%
44   1   INR 56.25                    1   563.47    -4.05%    0.12%
45   1   INR 57.38   INR 0.00         1   585.58     2.00%    3.92%
46   1   INR 57.88   INR 0.09         1   582.32     1.03%   -0.56%
47   1   INR 60.13                    1   607.00     3.89%    4.24%
48   1   INR 58.88   INR 0.00         1   617.03    -2.08%    1.65%
49   1   INR 64.25   INR 0.09         1   636.87     9.28%    3.22%
50   1   INR 65.50                    1   641.93     1.95%    0.80%
51   1   INR 63.88   INR 0.00         1   646.60    -2.48%    0.73%
52   1   INR 62.00   INR 0.09         1   655.01    -2.79%    1.30%
53   1   INR 60.75                    1   671.01    -2.02%    2.44%
54   1   INR 62.88   INR 0.00         1   671.67     3.50%    0.10%
55   1   INR 55.63   INR 0.11         1   641.02   -11.36%   -4.56%
56   1   INR 57.00                    1   653.47     2.47%    1.94%
57   1   INR 63.25   INR 0.00         1   688.65    10.96%    5.38%
58   1   INR 65.88   INR 0.11         1   706.26     4.32%    2.56%
59   1   INR 73.88                    1   757.53    12.14%    7.26%
60   1   INR 69.75   INR 0.00         1   742.02    -5.58%   -2.05%
RISK RETURN   13


REGRESSION STATISTICS AND RISK PARAMETERS
RISK AND PERFORMANCE MEASURES
Intercept (Alpha) =    -0.01%
Slope (Beta)=             1.40
Rf(1- Beta) =          -0.27%
Intercept-Rf(1-Beta)=   0.26%

VARIANCE STATISTICS
Variance of the stock=             0
Variance of the market =           0
Systematic variance=               0
Unsystematic variance=             0
R squared =                   32.41%


USING BETA
In estimating expected returns:
 Riskfree Rate =                 7.50%
 Historical return premium= 15.50%
 Expected return=               29.18%

In forecasting prices:
 Current price=            INR 75.38
 Annualized DPS=            INR 0.44
 Predicted prices:
 - One year from now       INR 96.94
RISK RETURN   14


- Two years from now     INR 124.66
- Three years from now   INR 160.30
- Four years from now    INR 206.14
- Five years from now    INR 265.09
RISK RETURN   15


Current stock price=   INR 75.38
Current Annual DPS =    INR 0.44
RISK RETURN   16


            (R(jt)-Rj)^2    (R(mt)-R(m))^2   (R(jt)-R(j))
X S&P 500                                     (R(mt)-R(m))
                     0.01          0                 0
                       0           0                 0
                       0           0                 0
                       0           0                 0
                       0           0                 0
                       0           0                 0
                       0           0                 0
                       0           0                 0
                     0.01          0                 0
                       0           0                 0
                       0           0                 0
                       0           0                 0
                       0           0                 0
                       0           0                 0
                     0.01          0                 0
                       0           0                 0
                     0.01          0                 0
                     0.01          0                 0
                       0           0                 0
                       0           0                 0
                     0.02          0                 0
                     0.01          0                 0
                       0           0                 0
                     0.01          0                 0
                       0           0                 0
                     0.02          0               0.01
                       0           0                 0
                       0           0                 0
                       0           0                 0
                       0           0                 0
RISK RETURN   17


  0    0     0
0.01   0     0
  0    0     0
0.01   0     0
  0    0     0
0.01   0     0
  0    0     0
  0    0     0
  0    0     0
  0    0     0
  0    0     0
  0    0     0
  0    0     0
  0    0     0
  0    0     0
  0    0     0
  0    0     0
0.01   0     0
  0    0     0
  0    0     0
  0    0     0
  0    0     0
  0    0     0
0.02   0   0.01
  0    0     0
0.01   0     0
  0    0     0
0.01   0   0.01
  0    0     0
RISK RETURN   18
RISK RETURN   19
Price(Stock): Price at the end of each month
DPS(Stock): Includes dividends, if the stock went ex-dividend during the month
Return on Stock = (Price (end) - Price (Beg) + Dividend)/Price(Beg)

Time period Price(Stock) DPS(Stock) Return(Stock)
Jan-92         34.16       0.04
Feb-92         38.42                   12.47%
Mar-92         37.87                   -1.43%
Apr-92         36.42       0.05        -3.69%
May-92         38.00                    4.34%
Jun-92         36.13                   -4.93%
Jul-92         36.00       0.05        -0.20%
Aug-92         34.50                   -4.17%
Sep-92         36.25                    5.07%
Oct-92         39.38       0.05         8.77%
Nov-92         42.18                    7.12%
Dec-92         43.00                    1.94%
Jan-93         45.63       0.05         6.23%
Feb-93         44.38                   -2.74%
Mar-93         44.50                    0.28%
Apr-93         40.75       0.06        -8.29%
May-93         44.00                    7.98%
Jun-93         40.75                   -7.39%
Jul-93         37.50       0.06        -7.82%
Aug-93         39.25                    4.67%
Sep-93         37.75                   -3.82%
Oct-93         43.00       0.06        14.07%
Nov-93         39.88                   -7.27%
Dec-93         42.63                    6.90%
Jan-94         47.25       0.06        11.00%
Feb-94         48.00                    1.59%
Mar-94         42.00                  -12.50%
Apr-94         42.50       0.08         1.37%
May-94         43.38                    2.06%
Jun-94         41.63                   -4.03%
Jul-94         42.38       0.08         1.98%
Aug-94         41.25                   -2.65%
Sep-94         38.75                   -6.06%
Oct-94         39.50       0.08         2.13%
Nov-94         43.50                   10.13%
Dec-94         46.00                    5.75%
Jan-95         50.88       0.08        10.76%
Feb-95         53.38                    4.91%
Mar-95         53.50                    0.23%
Apr-95         55.38       0.09         3.67%
May-95            55.50                    0.23%
Jun-95            55.50                    0.00%
Jul-95            58.63           0.09     5.79%
Aug-95            56.25                   -4.05%
Sep-95            57.38                    2.00%
Oct-95            57.88           0.09     1.03%
Nov-95            60.13                    3.89%
Dec-95            58.88                   -2.08%
Jan-96            64.25           0.09     9.28%
Feb-96            65.50                    1.95%
Mar-96            63.88                   -2.48%
Apr-96            62.00           0.09    -2.79%
May-96            60.75                   -2.02%
Jun-96            62.88                    3.50%
Jul-96            55.63           0.11   -11.36%
Aug-96            57.00                    2.47%
Sep-96            63.25                   10.96%
Oct-96            65.88           0.11     4.32%
Nov-96            73.88                   12.14%
Dec-96            69.75                   -5.58%
Variance in Returns =                            0
Standard Deviation in Returns =              6.14%

Más contenido relacionado

La actualidad más candente

Som grower screw machine products
Som grower screw machine productsSom grower screw machine products
Som grower screw machine productsRajendra Inani
 
Go Ahead for F&O Report 08 January 2013 Mansukh Investment and Trading Solution
Go Ahead for F&O Report 08 January 2013 Mansukh Investment and Trading Solution Go Ahead for F&O Report 08 January 2013 Mansukh Investment and Trading Solution
Go Ahead for F&O Report 08 January 2013 Mansukh Investment and Trading Solution Mansukh Investment & Trading Solutions
 
Go Ahead for F&O Report 01 November 2012-Mansukh Investment and Trading Solut...
Go Ahead for F&O Report 01 November 2012-Mansukh Investment and Trading Solut...Go Ahead for F&O Report 01 November 2012-Mansukh Investment and Trading Solut...
Go Ahead for F&O Report 01 November 2012-Mansukh Investment and Trading Solut...Mansukh Investment & Trading Solutions
 
Forex Capital Markets
Forex Capital MarketsForex Capital Markets
Forex Capital MarketsPedro L.
 
G1 hb 2011 2012 23 excitation-contraction coupling (steendijk)
G1 hb 2011 2012 23 excitation-contraction coupling (steendijk)G1 hb 2011 2012 23 excitation-contraction coupling (steendijk)
G1 hb 2011 2012 23 excitation-contraction coupling (steendijk)PaulSteendijk
 
Go Ahead for F&O Report 02 January 2013 Mansukh Investment and Trading Solution
Go Ahead for F&O Report 02 January 2013 Mansukh Investment and Trading Solution Go Ahead for F&O Report 02 January 2013 Mansukh Investment and Trading Solution
Go Ahead for F&O Report 02 January 2013 Mansukh Investment and Trading Solution Mansukh Investment & Trading Solutions
 
Go Ahead for F&O Report 10 January 2013 Mansukh Investment and Trading Solution
Go Ahead for F&O Report 10 January 2013 Mansukh Investment and Trading Solution Go Ahead for F&O Report 10 January 2013 Mansukh Investment and Trading Solution
Go Ahead for F&O Report 10 January 2013 Mansukh Investment and Trading Solution Mansukh Investment & Trading Solutions
 
Lazard network correlation_architecture
Lazard network correlation_architectureLazard network correlation_architecture
Lazard network correlation_architectureJean Meilhoc Ricaume
 
Selection Rotation Charts / Stats / Trades
Selection Rotation Charts / Stats / TradesSelection Rotation Charts / Stats / Trades
Selection Rotation Charts / Stats / TradesJason Unger
 
Go Ahead for F&O Report 29 January 2013 Mansukh Investment and Trading Solution
Go Ahead for F&O Report 29 January 2013 Mansukh Investment and Trading SolutionGo Ahead for F&O Report 29 January 2013 Mansukh Investment and Trading Solution
Go Ahead for F&O Report 29 January 2013 Mansukh Investment and Trading SolutionMansukh Investment & Trading Solutions
 

La actualidad más candente (14)

Som grower screw machine products
Som grower screw machine productsSom grower screw machine products
Som grower screw machine products
 
Go Ahead for F&O Report 08 January 2013 Mansukh Investment and Trading Solution
Go Ahead for F&O Report 08 January 2013 Mansukh Investment and Trading Solution Go Ahead for F&O Report 08 January 2013 Mansukh Investment and Trading Solution
Go Ahead for F&O Report 08 January 2013 Mansukh Investment and Trading Solution
 
Go Ahead for F&O Report 01 November 2012-Mansukh Investment and Trading Solut...
Go Ahead for F&O Report 01 November 2012-Mansukh Investment and Trading Solut...Go Ahead for F&O Report 01 November 2012-Mansukh Investment and Trading Solut...
Go Ahead for F&O Report 01 November 2012-Mansukh Investment and Trading Solut...
 
Forex Capital Markets
Forex Capital MarketsForex Capital Markets
Forex Capital Markets
 
G1 hb 2011 2012 23 excitation-contraction coupling (steendijk)
G1 hb 2011 2012 23 excitation-contraction coupling (steendijk)G1 hb 2011 2012 23 excitation-contraction coupling (steendijk)
G1 hb 2011 2012 23 excitation-contraction coupling (steendijk)
 
Cob 20081000 1
Cob 20081000 1Cob 20081000 1
Cob 20081000 1
 
Cob 20081009 1
Cob 20081009 1Cob 20081009 1
Cob 20081009 1
 
Go Ahead for F&O Report 02 January 2013 Mansukh Investment and Trading Solution
Go Ahead for F&O Report 02 January 2013 Mansukh Investment and Trading Solution Go Ahead for F&O Report 02 January 2013 Mansukh Investment and Trading Solution
Go Ahead for F&O Report 02 January 2013 Mansukh Investment and Trading Solution
 
Go Ahead for F&O Report 10 January 2013 Mansukh Investment and Trading Solution
Go Ahead for F&O Report 10 January 2013 Mansukh Investment and Trading Solution Go Ahead for F&O Report 10 January 2013 Mansukh Investment and Trading Solution
Go Ahead for F&O Report 10 January 2013 Mansukh Investment and Trading Solution
 
Lazard network correlation_architecture
Lazard network correlation_architectureLazard network correlation_architecture
Lazard network correlation_architecture
 
Selection Rotation Charts / Stats / Trades
Selection Rotation Charts / Stats / TradesSelection Rotation Charts / Stats / Trades
Selection Rotation Charts / Stats / Trades
 
Data hygiene report
Data hygiene reportData hygiene report
Data hygiene report
 
Go Ahead for F&O Report 29 January 2013 Mansukh Investment and Trading Solution
Go Ahead for F&O Report 29 January 2013 Mansukh Investment and Trading SolutionGo Ahead for F&O Report 29 January 2013 Mansukh Investment and Trading Solution
Go Ahead for F&O Report 29 January 2013 Mansukh Investment and Trading Solution
 
Cob 20081201 1
Cob 20081201 1Cob 20081201 1
Cob 20081201 1
 

Destacado

Determining a Line of Best Fit Using a Graphing Calculator
Determining a Line of Best Fit Using a Graphing CalculatorDetermining a Line of Best Fit Using a Graphing Calculator
Determining a Line of Best Fit Using a Graphing Calculatoremilybriggs
 
Story line and Plot Elements
Story line and Plot ElementsStory line and Plot Elements
Story line and Plot ElementsKricel Mendoza
 
THE PLOT LINE STUDY GUIDE
THE PLOT LINE STUDY GUIDETHE PLOT LINE STUDY GUIDE
THE PLOT LINE STUDY GUIDEmiddletons1
 
Line best fit 2012-13 edmodo
Line best fit  2012-13 edmodoLine best fit  2012-13 edmodo
Line best fit 2012-13 edmodoshumwayc
 
Linear Regression
Linear RegressionLinear Regression
Linear Regressionktini
 
5 6 Scatter Plots & Best Fit Lines
5 6 Scatter Plots & Best Fit Lines5 6 Scatter Plots & Best Fit Lines
5 6 Scatter Plots & Best Fit LinesBitsy Griffin
 
Stem-and-Leaf Plot and Line Plot
Stem-and-Leaf Plot and Line PlotStem-and-Leaf Plot and Line Plot
Stem-and-Leaf Plot and Line Plotsheisirenebkm
 
Frequency table and line plot
Frequency table and line plotFrequency table and line plot
Frequency table and line plotbweldon
 
Straight Line Graph Reminder
Straight Line Graph ReminderStraight Line Graph Reminder
Straight Line Graph Reminderkeithpeter
 
Plot Element Notes
Plot Element NotesPlot Element Notes
Plot Element Noteskmcclai2
 

Destacado (16)

Plot line
Plot linePlot line
Plot line
 
Determining a Line of Best Fit Using a Graphing Calculator
Determining a Line of Best Fit Using a Graphing CalculatorDetermining a Line of Best Fit Using a Graphing Calculator
Determining a Line of Best Fit Using a Graphing Calculator
 
Story line and Plot Elements
Story line and Plot ElementsStory line and Plot Elements
Story line and Plot Elements
 
THE PLOT LINE STUDY GUIDE
THE PLOT LINE STUDY GUIDETHE PLOT LINE STUDY GUIDE
THE PLOT LINE STUDY GUIDE
 
Stem and leaf
Stem and leafStem and leaf
Stem and leaf
 
Line plot
Line plotLine plot
Line plot
 
Line best fit 2012-13 edmodo
Line best fit  2012-13 edmodoLine best fit  2012-13 edmodo
Line best fit 2012-13 edmodo
 
Linear Regression
Linear RegressionLinear Regression
Linear Regression
 
Regression for class teaching
Regression for class teachingRegression for class teaching
Regression for class teaching
 
5 6 Scatter Plots & Best Fit Lines
5 6 Scatter Plots & Best Fit Lines5 6 Scatter Plots & Best Fit Lines
5 6 Scatter Plots & Best Fit Lines
 
Probablity normal
Probablity normalProbablity normal
Probablity normal
 
Stem-and-Leaf Plot and Line Plot
Stem-and-Leaf Plot and Line PlotStem-and-Leaf Plot and Line Plot
Stem-and-Leaf Plot and Line Plot
 
Frequency table and line plot
Frequency table and line plotFrequency table and line plot
Frequency table and line plot
 
Straight Line Graph Reminder
Straight Line Graph ReminderStraight Line Graph Reminder
Straight Line Graph Reminder
 
Box and whisker plots
Box and whisker plotsBox and whisker plots
Box and whisker plots
 
Plot Element Notes
Plot Element NotesPlot Element Notes
Plot Element Notes
 

Similar a Calculation of beta

FreakonomicsOfScrum spreadsheet
FreakonomicsOfScrum spreadsheetFreakonomicsOfScrum spreadsheet
FreakonomicsOfScrum spreadsheetguest4ed39d
 
Data For Lab Day 1
Data For Lab   Day 1Data For Lab   Day 1
Data For Lab Day 1guest0009aa
 
Ch 06 financial management notes
Ch 06 financial management notesCh 06 financial management notes
Ch 06 financial management notesBabasab Patil
 
Ch 05 financial management notes
Ch 05 financial management notesCh 05 financial management notes
Ch 05 financial management notesBabasab Patil
 
WCCI 2008 Tutorial on Computational Intelligence and Games, part 2 of 3
WCCI 2008 Tutorial on Computational Intelligence and Games, part 2 of 3WCCI 2008 Tutorial on Computational Intelligence and Games, part 2 of 3
WCCI 2008 Tutorial on Computational Intelligence and Games, part 2 of 3togelius
 
Depotwise sl&tl(west)
Depotwise sl&tl(west)Depotwise sl&tl(west)
Depotwise sl&tl(west)maverick4300
 
SPICE MODEL of PBYR10100 (Standard Model) in SPICE PARK
SPICE MODEL of PBYR10100 (Standard Model) in SPICE PARKSPICE MODEL of PBYR10100 (Standard Model) in SPICE PARK
SPICE MODEL of PBYR10100 (Standard Model) in SPICE PARKTsuyoshi Horigome
 
FreakonomicsOfScrum spreadsheet
FreakonomicsOfScrum spreadsheetFreakonomicsOfScrum spreadsheet
FreakonomicsOfScrum spreadsheetMaxim Dorofeev
 
SPICE MODEL of LR6AG_RL=10(Ohm) in SPICE PARK
SPICE MODEL of LR6AG_RL=10(Ohm) in SPICE PARKSPICE MODEL of LR6AG_RL=10(Ohm) in SPICE PARK
SPICE MODEL of LR6AG_RL=10(Ohm) in SPICE PARKTsuyoshi Horigome
 

Similar a Calculation of beta (20)

FreakonomicsOfScrum spreadsheet
FreakonomicsOfScrum spreadsheetFreakonomicsOfScrum spreadsheet
FreakonomicsOfScrum spreadsheet
 
Data For Lab Day 1
Data For Lab   Day 1Data For Lab   Day 1
Data For Lab Day 1
 
Financial ratios
Financial ratiosFinancial ratios
Financial ratios
 
Results Det 3
Results   Det 3Results   Det 3
Results Det 3
 
Sabrina olivares
Sabrina olivaresSabrina olivares
Sabrina olivares
 
Ch 06 financial management notes
Ch 06 financial management notesCh 06 financial management notes
Ch 06 financial management notes
 
Futures Options
Futures OptionsFutures Options
Futures Options
 
Ch 05 financial management notes
Ch 05 financial management notesCh 05 financial management notes
Ch 05 financial management notes
 
WCCI 2008 Tutorial on Computational Intelligence and Games, part 2 of 3
WCCI 2008 Tutorial on Computational Intelligence and Games, part 2 of 3WCCI 2008 Tutorial on Computational Intelligence and Games, part 2 of 3
WCCI 2008 Tutorial on Computational Intelligence and Games, part 2 of 3
 
تحليل ماركوف
تحليل ماركوفتحليل ماركوف
تحليل ماركوف
 
Ib.2008
Ib.2008Ib.2008
Ib.2008
 
Depotwise sl&tl(west)
Depotwise sl&tl(west)Depotwise sl&tl(west)
Depotwise sl&tl(west)
 
Matías reyes
Matías reyesMatías reyes
Matías reyes
 
SPICE MODEL of PBYR10100 (Standard Model) in SPICE PARK
SPICE MODEL of PBYR10100 (Standard Model) in SPICE PARKSPICE MODEL of PBYR10100 (Standard Model) in SPICE PARK
SPICE MODEL of PBYR10100 (Standard Model) in SPICE PARK
 
Sta iluu
Sta iluuSta iluu
Sta iluu
 
FreakonomicsOfScrum spreadsheet
FreakonomicsOfScrum spreadsheetFreakonomicsOfScrum spreadsheet
FreakonomicsOfScrum spreadsheet
 
Pm
PmPm
Pm
 
Cob 20091102 1
Cob 20091102 1Cob 20091102 1
Cob 20091102 1
 
Cob 20081202 1
Cob 20081202 1Cob 20081202 1
Cob 20081202 1
 
SPICE MODEL of LR6AG_RL=10(Ohm) in SPICE PARK
SPICE MODEL of LR6AG_RL=10(Ohm) in SPICE PARKSPICE MODEL of LR6AG_RL=10(Ohm) in SPICE PARK
SPICE MODEL of LR6AG_RL=10(Ohm) in SPICE PARK
 

Más de iipmff2

Stocks price
Stocks priceStocks price
Stocks priceiipmff2
 
Statistics
StatisticsStatistics
Statisticsiipmff2
 
Statistical calculation sample
Statistical calculation   sampleStatistical calculation   sample
Statistical calculation sampleiipmff2
 
Solver 1
Solver 1Solver 1
Solver 1iipmff2
 
Sharp portfolio optimiser
Sharp portfolio optimiserSharp portfolio optimiser
Sharp portfolio optimiseriipmff2
 
Riskfree lending and borrowing
Riskfree lending and borrowingRiskfree lending and borrowing
Riskfree lending and borrowingiipmff2
 
Residual
ResidualResidual
Residualiipmff2
 
Portfolio evaluation
Portfolio evaluationPortfolio evaluation
Portfolio evaluationiipmff2
 
Mckinsey tutorial on valuations
Mckinsey tutorial on valuationsMckinsey tutorial on valuations
Mckinsey tutorial on valuationsiipmff2
 
Mck valuation sprdsheet
Mck valuation sprdsheetMck valuation sprdsheet
Mck valuation sprdsheetiipmff2
 
Market model calculation
Market model calculationMarket model calculation
Market model calculationiipmff2
 
Iipm chapter 1
Iipm chapter 1Iipm chapter 1
Iipm chapter 1iipmff2
 
Iipm chapter 3
Iipm chapter 3Iipm chapter 3
Iipm chapter 3iipmff2
 
Iipm chapter 1
Iipm chapter 1Iipm chapter 1
Iipm chapter 1iipmff2
 
Financial functions
Financial functionsFinancial functions
Financial functionsiipmff2
 
Financial functions
Financial functionsFinancial functions
Financial functionsiipmff2
 
Advanced functions
Advanced functionsAdvanced functions
Advanced functionsiipmff2
 
Sustainable competitive advantage cs & notes toyota cs
Sustainable competitive advantage cs & notes toyota csSustainable competitive advantage cs & notes toyota cs
Sustainable competitive advantage cs & notes toyota csiipmff2
 
Small business comp adv
Small business comp advSmall business comp adv
Small business comp adviipmff2
 
Sca michel poter
Sca michel poterSca michel poter
Sca michel poteriipmff2
 

Más de iipmff2 (20)

Stocks price
Stocks priceStocks price
Stocks price
 
Statistics
StatisticsStatistics
Statistics
 
Statistical calculation sample
Statistical calculation   sampleStatistical calculation   sample
Statistical calculation sample
 
Solver 1
Solver 1Solver 1
Solver 1
 
Sharp portfolio optimiser
Sharp portfolio optimiserSharp portfolio optimiser
Sharp portfolio optimiser
 
Riskfree lending and borrowing
Riskfree lending and borrowingRiskfree lending and borrowing
Riskfree lending and borrowing
 
Residual
ResidualResidual
Residual
 
Portfolio evaluation
Portfolio evaluationPortfolio evaluation
Portfolio evaluation
 
Mckinsey tutorial on valuations
Mckinsey tutorial on valuationsMckinsey tutorial on valuations
Mckinsey tutorial on valuations
 
Mck valuation sprdsheet
Mck valuation sprdsheetMck valuation sprdsheet
Mck valuation sprdsheet
 
Market model calculation
Market model calculationMarket model calculation
Market model calculation
 
Iipm chapter 1
Iipm chapter 1Iipm chapter 1
Iipm chapter 1
 
Iipm chapter 3
Iipm chapter 3Iipm chapter 3
Iipm chapter 3
 
Iipm chapter 1
Iipm chapter 1Iipm chapter 1
Iipm chapter 1
 
Financial functions
Financial functionsFinancial functions
Financial functions
 
Financial functions
Financial functionsFinancial functions
Financial functions
 
Advanced functions
Advanced functionsAdvanced functions
Advanced functions
 
Sustainable competitive advantage cs & notes toyota cs
Sustainable competitive advantage cs & notes toyota csSustainable competitive advantage cs & notes toyota cs
Sustainable competitive advantage cs & notes toyota cs
 
Small business comp adv
Small business comp advSmall business comp adv
Small business comp adv
 
Sca michel poter
Sca michel poterSca michel poter
Sca michel poter
 

Calculation of beta

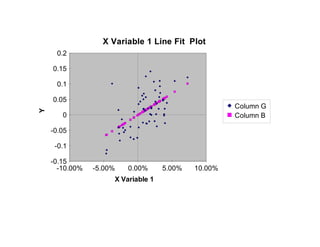
  • 1. X Variable 1 Line Fit Plot 0.2 0.15 0.1 0.05 Column G Y 0 Column B -0.05 -0.1 -0.15 -10.00% -5.00% 0.00% 5.00% 10.00% X Variable 1
  • 2. X Variable 1 Residual Plot 0.2 0.15 0.1 Residuals 0.05 0 -0.05 -0.1 -6.00% -4.00% -2.00% 0.00% 2.00% 4.00% 6.00% 8.00% X Variable 1
  • 3. Normal Probability Plot 0.2 0.15 0.1 0.05 Y 0 -0.05 -0.1 -0.15 0 20 40 60 80 100 120 Sample Percentile
  • 4. SUMMARY OUTPUT Regression Statistics Multiple R 0.57 R Square 0.32 Adjusted R Square 0.31 Standard Error 0.05 Observations 59 ANOVA df SS MS F Significance F Regression 1 0.07 0.07 27.33 0 Residual 57 0.15 0 Total 58 0.22 Coefficients Standard Errort Stat P-value Lower 95%Upper 95% Lower 95.0% Upper 95.0% Intercept 0 0.01 -0.01 0.99 -0.01 0.01 -0.01 0.01 X Variable 1 1.4 0.27 5.23 0 0.86 1.93 0.86 1.93 RESIDUAL OUTPUT PROBABILITY OUTPUT Observation Predicted YResiduals Standard Residuals Percentile Y 1 0.02 0.11 2.15 0.85 -0.13 2 -0.03 0.02 0.37 2.54 -0.11 3 0.04 -0.08 -1.5 4.24 -0.08 4 0 0.04 0.76 5.93 -0.08 5 -0.03 -0.02 -0.46 7.63 -0.07 6 0.05 -0.06 -1.1 9.32 -0.07 7 -0.03 -0.01 -0.22 11.02 -0.06 8 0.01 0.04 0.78 12.71 -0.06 9 0 0.09 1.72 14.41 -0.05 10 0.05 0.03 0.51 16.1 -0.04 11 0.01 0.01 0.15 17.8 -0.04 12 0.01 0.05 1.06 19.49 -0.04 13 0.02 -0.04 -0.88 21.19 -0.04 14 0.02 -0.02 -0.44 22.88 -0.04 15 -0.04 -0.05 -0.91 24.58 -0.03 16 0.04 0.04 0.88 26.27 -0.03 17 0 -0.07 -1.44 27.97 -0.03 18 -0.01 -0.07 -1.38 29.66 -0.02 19 0.05 0 -0.09 31.36 -0.02 20 -0.02 -0.02 -0.45 33.05 -0.02 21 0.03 0.12 2.28 34.75 -0.01 22 -0.02 -0.06 -1.14 36.44 0 23 0.01 0.06 1.13 38.14 0 24 0.04 0.07 1.3 39.83 0 25 -0.04 0.06 1.11 41.53 0 26 -0.07 -0.06 -1.19 43.22 0 27 0.01 0 -0.02 44.92 0.01 28 0.02 0 0 46.61 0.01 29 -0.04 0 -0.02 48.31 0.02
  • 5. 30 0.04 -0.02 -0.45 50 0.02 31 0.06 -0.08 -1.62 51.69 0.02 32 -0.04 -0.02 -0.44 53.39 0.02 33 0.03 -0.01 -0.12 55.08 0.02 34 -0.05 0.15 3.06 56.78 0.02 35 0.02 0.04 0.82 58.47 0.02 36 0.03 0.07 1.49 60.17 0.02 37 0.05 0 -0.06 61.86 0.03 38 0.04 -0.03 -0.69 63.56 0.04 39 0.04 0 -0.03 65.25 0.04 40 0.05 -0.05 -1.02 66.95 0.04 41 0.03 -0.03 -0.54 68.64 0.04 42 0.04 0.01 0.29 70.34 0.05 43 0 -0.04 -0.83 72.03 0.05 44 0.05 -0.03 -0.69 73.73 0.05 45 -0.01 0.02 0.36 75.42 0.06 46 0.06 -0.02 -0.4 77.12 0.06 47 0.02 -0.04 -0.87 78.81 0.06 48 0.04 0.05 0.95 80.51 0.07 49 0.01 0.01 0.17 82.2 0.07 50 0.01 -0.03 -0.69 83.9 0.08 51 0.02 -0.05 -0.91 85.59 0.09 52 0.03 -0.05 -1.08 87.29 0.09 53 0 0.03 0.67 88.98 0.1 54 -0.06 -0.05 -0.98 90.68 0.11 55 0.03 0 -0.05 92.37 0.11 56 0.08 0.03 0.68 94.07 0.11 57 0.04 0.01 0.15 95.76 0.12 58 0.1 0.02 0.4 97.46 0.12 59 -0.03 -0.03 -0.54 99.15 0.14
  • 6. RISK RETURN 10 Current riskfree rate = 7.50% Risk premium for stocks= 15.50% Number of periods of data= 60 Riskfree rate during period = 8.50%
  • 7. RISK RETURN 11 Time period Index Price(Stock) DPS(Stock) Split Factor Index Level Return(Stock) Return(Mkt) 1 1 INR 34.16 INR 0.04 1 409.32 Infotech CNX S&P 500 2 1 INR 38.42 1 414.08 12.47% 1.16% 3 1 INR 37.87 1 404.35 -1.43% -2.35% 4 1 INR 36.42 INR 0.05 1 415.53 -3.69% 2.76% 5 1 INR 38.00 1 416.98 4.34% 0.35% 6 1 INR 36.13 INR 0.00 1 409.17 -4.93% -1.87% 7 1 INR 36.00 INR 0.05 1 424.81 -0.20% 3.82% 8 1 INR 34.50 1 415.54 -4.17% -2.18% 9 1 INR 36.25 INR 0.00 1 418.90 5.07% 0.81% 10 1 INR 39.38 INR 0.05 1 419.23 8.77% 0.08% 11 1 INR 42.18 1 432.90 7.12% 3.26% 12 1 INR 43.00 INR 0.00 1 436.64 1.94% 0.87% 13 1 INR 45.63 INR 0.05 1 439.35 6.23% 0.62% 14 1 INR 44.38 1 444.76 -2.74% 1.23% 15 1 INR 44.50 INR 0.00 1 452.73 0.28% 1.79% 16 1 INR 40.75 INR 0.06 1 440.75 -8.29% -2.65% 17 1 INR 44.00 1 451.93 7.98% 2.54% 18 1 INR 40.75 INR 0.00 1 451.51 -7.39% -0.09% 19 1 INR 37.50 INR 0.06 1 448.72 -7.82% -0.62% 20 1 INR 39.25 1 465.10 4.67% 3.65% 21 1 INR 37.75 INR 0.00 1 460.01 -3.82% -1.09% 22 1 INR 43.00 INR 0.06 1 468.42 14.07% 1.83% 23 1 INR 39.88 1 463.37 -7.27% -1.08% 24 1 INR 42.63 INR 0.00 1 467.37 6.90% 0.86% 25 1 INR 47.25 INR 0.06 1 482.29 11.00% 3.19% 26 1 INR 48.00 1 468.55 1.59% -2.85% 27 1 INR 42.00 INR 0.00 1 446.80 -12.50% -4.64% 28 1 INR 42.50 INR 0.08 1 451.48 1.37% 1.05% 29 1 INR 43.38 1 458.23 2.06% 1.50% 30 1 INR 41.63 INR 0.00 1 445.33 -4.03% -2.82% 31 1 INR 42.38 INR 0.08 1 458.85 1.98% 3.04%
  • 8. RISK RETURN 12 32 1 INR 41.25 1 477.02 -2.65% 3.96% 33 1 INR 38.75 INR 0.00 1 463.89 -6.06% -2.75% 34 1 INR 39.50 INR 0.08 1 473.07 2.13% 1.98% 35 1 INR 43.50 1 455.17 10.13% -3.78% 36 1 INR 46.00 INR 0.00 1 460.41 5.75% 1.15% 37 1 INR 50.88 INR 0.08 1 471.17 10.76% 2.34% 38 1 INR 53.38 1 488.74 4.91% 3.73% 39 1 INR 53.50 INR 0.00 1 501.75 0.23% 2.66% 40 1 INR 55.38 INR 0.09 1 515.45 3.67% 2.73% 41 1 INR 55.50 1 535.24 0.23% 3.84% 42 1 INR 55.50 INR 0.00 1 545.78 0.00% 1.97% 43 1 INR 58.63 INR 0.09 1 562.81 5.79% 3.12% 44 1 INR 56.25 1 563.47 -4.05% 0.12% 45 1 INR 57.38 INR 0.00 1 585.58 2.00% 3.92% 46 1 INR 57.88 INR 0.09 1 582.32 1.03% -0.56% 47 1 INR 60.13 1 607.00 3.89% 4.24% 48 1 INR 58.88 INR 0.00 1 617.03 -2.08% 1.65% 49 1 INR 64.25 INR 0.09 1 636.87 9.28% 3.22% 50 1 INR 65.50 1 641.93 1.95% 0.80% 51 1 INR 63.88 INR 0.00 1 646.60 -2.48% 0.73% 52 1 INR 62.00 INR 0.09 1 655.01 -2.79% 1.30% 53 1 INR 60.75 1 671.01 -2.02% 2.44% 54 1 INR 62.88 INR 0.00 1 671.67 3.50% 0.10% 55 1 INR 55.63 INR 0.11 1 641.02 -11.36% -4.56% 56 1 INR 57.00 1 653.47 2.47% 1.94% 57 1 INR 63.25 INR 0.00 1 688.65 10.96% 5.38% 58 1 INR 65.88 INR 0.11 1 706.26 4.32% 2.56% 59 1 INR 73.88 1 757.53 12.14% 7.26% 60 1 INR 69.75 INR 0.00 1 742.02 -5.58% -2.05%
  • 9. RISK RETURN 13 REGRESSION STATISTICS AND RISK PARAMETERS RISK AND PERFORMANCE MEASURES Intercept (Alpha) = -0.01% Slope (Beta)= 1.40 Rf(1- Beta) = -0.27% Intercept-Rf(1-Beta)= 0.26% VARIANCE STATISTICS Variance of the stock= 0 Variance of the market = 0 Systematic variance= 0 Unsystematic variance= 0 R squared = 32.41% USING BETA In estimating expected returns: Riskfree Rate = 7.50% Historical return premium= 15.50% Expected return= 29.18% In forecasting prices: Current price= INR 75.38 Annualized DPS= INR 0.44 Predicted prices: - One year from now INR 96.94
  • 10. RISK RETURN 14 - Two years from now INR 124.66 - Three years from now INR 160.30 - Four years from now INR 206.14 - Five years from now INR 265.09
  • 11. RISK RETURN 15 Current stock price= INR 75.38 Current Annual DPS = INR 0.44
  • 12. RISK RETURN 16 (R(jt)-Rj)^2 (R(mt)-R(m))^2 (R(jt)-R(j)) X S&P 500 (R(mt)-R(m)) 0.01 0 0 0 0 0 0 0 0 0 0 0 0 0 0 0 0 0 0 0 0 0 0 0 0.01 0 0 0 0 0 0 0 0 0 0 0 0 0 0 0 0 0 0.01 0 0 0 0 0 0.01 0 0 0.01 0 0 0 0 0 0 0 0 0.02 0 0 0.01 0 0 0 0 0 0.01 0 0 0 0 0 0.02 0 0.01 0 0 0 0 0 0 0 0 0 0 0 0
  • 13. RISK RETURN 17 0 0 0 0.01 0 0 0 0 0 0.01 0 0 0 0 0 0.01 0 0 0 0 0 0 0 0 0 0 0 0 0 0 0 0 0 0 0 0 0 0 0 0 0 0 0 0 0 0 0 0 0 0 0 0.01 0 0 0 0 0 0 0 0 0 0 0 0 0 0 0 0 0 0.02 0 0.01 0 0 0 0.01 0 0 0 0 0 0.01 0 0.01 0 0 0
  • 16. Price(Stock): Price at the end of each month DPS(Stock): Includes dividends, if the stock went ex-dividend during the month Return on Stock = (Price (end) - Price (Beg) + Dividend)/Price(Beg) Time period Price(Stock) DPS(Stock) Return(Stock) Jan-92 34.16 0.04 Feb-92 38.42 12.47% Mar-92 37.87 -1.43% Apr-92 36.42 0.05 -3.69% May-92 38.00 4.34% Jun-92 36.13 -4.93% Jul-92 36.00 0.05 -0.20% Aug-92 34.50 -4.17% Sep-92 36.25 5.07% Oct-92 39.38 0.05 8.77% Nov-92 42.18 7.12% Dec-92 43.00 1.94% Jan-93 45.63 0.05 6.23% Feb-93 44.38 -2.74% Mar-93 44.50 0.28% Apr-93 40.75 0.06 -8.29% May-93 44.00 7.98% Jun-93 40.75 -7.39% Jul-93 37.50 0.06 -7.82% Aug-93 39.25 4.67% Sep-93 37.75 -3.82% Oct-93 43.00 0.06 14.07% Nov-93 39.88 -7.27% Dec-93 42.63 6.90% Jan-94 47.25 0.06 11.00% Feb-94 48.00 1.59% Mar-94 42.00 -12.50% Apr-94 42.50 0.08 1.37% May-94 43.38 2.06% Jun-94 41.63 -4.03% Jul-94 42.38 0.08 1.98% Aug-94 41.25 -2.65% Sep-94 38.75 -6.06% Oct-94 39.50 0.08 2.13% Nov-94 43.50 10.13% Dec-94 46.00 5.75% Jan-95 50.88 0.08 10.76% Feb-95 53.38 4.91% Mar-95 53.50 0.23% Apr-95 55.38 0.09 3.67%
  • 17. May-95 55.50 0.23% Jun-95 55.50 0.00% Jul-95 58.63 0.09 5.79% Aug-95 56.25 -4.05% Sep-95 57.38 2.00% Oct-95 57.88 0.09 1.03% Nov-95 60.13 3.89% Dec-95 58.88 -2.08% Jan-96 64.25 0.09 9.28% Feb-96 65.50 1.95% Mar-96 63.88 -2.48% Apr-96 62.00 0.09 -2.79% May-96 60.75 -2.02% Jun-96 62.88 3.50% Jul-96 55.63 0.11 -11.36% Aug-96 57.00 2.47% Sep-96 63.25 10.96% Oct-96 65.88 0.11 4.32% Nov-96 73.88 12.14% Dec-96 69.75 -5.58% Variance in Returns = 0 Standard Deviation in Returns = 6.14%