Cruise ships owned by Carnival Corporation emitted about 10 times more sulfur dioxide in European waters in 2017 than all of Europe's 260+ million passenger vehicles. A study analyzed 203 cruise ships and found they emitted around 62,000 tonnes of sulfur oxides, 155,000 tonnes of nitrogen oxides, and over 10 million tonnes of carbon dioxide while sailing in European exclusive economic zones. Major cruise ports like Barcelona, Palma, and Venice were among the most polluted by cruise ship emissions.
3. 2
a study by
Executive Summary
The main purpose of this study is to analyse air pollution caused by luxury passenger cruise ships in
European waters. The results show that the luxury cruise brands owned by Carnival Corporation &
PLC emitted in 2017 in European seas alone 10 times more cancer-causing sulphur dioxide than all of
Europe’s 260+ million passenger vehicles. Spain, Italy, Greece, France and Norway are the most
exposed countries to cruise ship air pollution in Europe. Among the major cruise ports, Barcelona,
Palma Mallorca and Venice are the most polluted.
Analysis also reveals that even in sulphur emission control areas (SECAs), where the most stringent
marine sulphur fuel standard is mandated, air pollution from cruise ships remains of great concern.
In Denmark, for example, whose coasts are entirely within SECAs, cruise ships emitted 18 times more
SOX in 2017 than all the country’s 2.5 million passenger vehicles in a year. This is a reflection of both
the effectiveness of the fuel quality directive for road transport fuels and the failure to implement
equivalent standards for the shipping industry. Ships SOX will still remain considerably large
compared to passenger car fleet even after the introduction of the global 2020 marine sulphur cap.
When it comes to nitrogen oxide (NOX) emissions, cruise ships are also of great concern despite the
air pollution impact of the ongoing land-based “dieselgate” in Europe. In Denmark again, 107 cruise
ships analysed emitted as much NOX in the Danish maritime economic exclusive zone (EEZ) as half
the passenger cars operating in the country itself.
This report recommends a zero-emission berth standard for all European ports. In addition, extra
stringent air pollution standards are recommended to apply to cruise ships. These ships usually
operate close to the coast with long port calls at major tourist destinations, hence disproportionately
affecting air quality. Initially, it is recommended to extend the emission control areas, currently in
place in the North and Baltic Seas, to the rest of the EU seas and to tighten marine SECA standard in
Europe to 10ppm, equivalent to fuel used in road transport. The report also suggests that cruise
ships, the industry’s public-facing luxury segment, be looked up and targeted as first-movers in
regulations to decarbonise the sector. So, in addition to a zero-emission berth standard, cruise ships
should also be the first required to switch to zero emission propulsion in EU territorial waters.
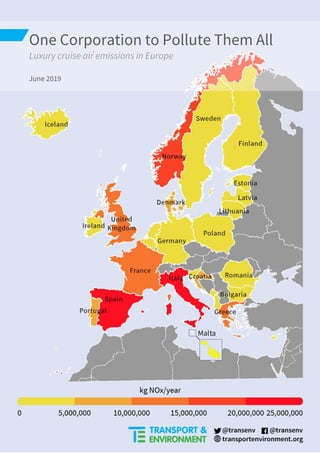
Figure 1: Heatmap of NOx emissions from cruise ships in European EEZ in 2017 (T&E).
4. 3
a study by
Table of Contents
Executive Summary............................................................................................................................................ 2
1. Description of the policy context ............................................................................................................... 4
2. Methodology............................................................................................................................................... 4
3. Findings....................................................................................................................................................... 6
General findings for Europe...................................................................................................6
Ranking of cruise ship companies by air pollution................................................................6
Port-level findings of cruise air pollution..............................................................................8
Country-level findings of cruise air pollution......................................................................11
4. Conclusions and recommendations........................................................................................................ 14
Appendix 1 – Detailed methodology................................................................................................................ 16
Appendix 2 – Detailed Results.......................................................................................................................... 17
Appendix 3 – Projected impact of 2020 standard on SOX emissions .............................................................. 23
Appendix 4 – Passenger car fleet in port cities .................................................................................................. 0
References........................................................................................................................................................... 0
5. 4
a study by
1. Description of the policy context
Shipping is an important transport sector relying on the use of fossil fuels as asource of energy. Unlike other
transport modes, marine fuel is less refined and standards for emission of air pollutants are less strict. As a
result, shipping is a source of considerable air pollution despite fewer number of operational vessels in the
global fleet. Sulphur oxide (SOX) emissions form sulphate (SO4) aerosols that increase human health risks.
SOX, ultrafine particles (PM2.5) and nitrogen oxides (NOX) cause premature death, including from lung
cancer and cardiovascular disease, and morbidity, e.g., childhood asthma. They also contribute to
acidification in terrestrial and aquatic environments.i
NOX contribute to particle and ozone formation, in
addition to causing acidification and eutrophication upon deposition on land, lakes and seas. It is moved
long distances in air and is, therefore, often considered a ‘regional’ pollutant.ii
Over the past 10 years, governments acting locally, regionally and globally have commended efforts to
reduce ship air pollution by setting SOX and NOX standards for marine fuels and engines. In addition, certain
geographical areas in Europe and North America, and more recently in China (only local) have been
designated emission control areas (ECA) for air pollutants.
Yet, shipping remains the least regulated transport sector as regards air pollution. The best marine sulphur
standard (0.1% | 1000 ppm) remains 100 times worse than Europe’s sulphur standard for road diesel/petrol
(0.001% | 10 ppm) in place for the past 15 years. Recent studies have shown the staggering amount of air
pollutants emitted by the global fleetiii
and that increasingly large proportion of NOX and SOX depositions
on land in coastal regions and port cities come from ships.iv
But these studies have had a generic global
and/or regional scope. Estimations of ship emissions have not been undertaken for individual countries
with a coastline. Analysis of emissions from passenger ships, especially luxury cruise vessels, is also missing
yet recent reports suggest they dramatically aggravate local air quality, especially in famous cruise ship
ports.v
The purpose of this report is to analyse air pollutants, notably, sulphur oxides (SOX), nitrogen oxides (NOX)
and particulate matter (PM) from cruise ships in the exclusive economic zones (EEZ)1
of European countries
and major cruise port cities.
2. Methodology
The study analysed 203 cruise ships that sailed according to ship automated identification system (AIS) in
the EEZ of European countries in 2017. Operational data (incl. ship coordinates and speed) was obtained
from ExactEarth which tracks ship movements using satellite data from AIS readings. The AIS data for the
analysed ships had a nominal 1-hour interval between each data point.
We first allocated each data point to the EEZ and port cities (see Appendix I). We then used the methodology
followed by the IMO 3rd
GHG Study (2014)2
, previous T&Ereportsvi
and the ICCT’sGHGinventoryvii
to estimate
the fuel consumption of each ship and associated emissions of air pollutants for each data point and
summed them for respective country EEZs and ports.
In estimating emissions, we assumed that all the ships analysed complied with the relevant fuel sulphur
standards in place in each geographical area. Notably, ships sailing in SECAs are required to use only 0.1%
sulphur compatible marine gas oils (MGO)3
, while cruise ships sailing outside SECA are obliged to use
1
An exclusive economic zone (EEZ) is a sea zone prescribed by the 1982 United Nations Convention on the Law of the Sea over
which a state has special rights regarding the exploration and use of marine resources, including energy production from water
and wind. It stretches from the baseline out to 200 nautical miles (nm) from its coast.
2
3rd
IMO GHG study developed a unique scientific methodology to estimate ship energy consumption and emissions and remains
the most trusted methodology.
3
Alternatively, ships are also allowed to use exhaust gas cleaning systems (scrubbers) to achieve similar results.
6. 5
a study by
residual fuels complying to a maximum 1.5% marine sulphur cap mandated under the EU Sulphur Directive
(2012/33/EU) (Figure 2). The Sulphur Directive requires ships, including cruise ships to switch to 0.1%
sulphur compatible fuels if they spend more than 2 hours at berth. Given that cruise ships normally spend
far more 2 hours at berth during cruise port calls, we have assumed that all the cruise ships analysed
complied with the 0.1% fuel standard during (the entire duration of) all port calls.
According to both global MARPOL Annex VI and EU Sulphur Directive, cruise ships will be required to switch
to fuels with a maximum of 0.5% Sulphur content starting from 1 January 2020 when sailing outside SECAs,
when operating outside the berths. This standard will remain less stringent compared to EU berth Sulphur
standard (0.1%) in all European ports.4
To take into account the new standard we also modelled an
additional forward-looking scenario, the results of which are presented in Appendix 3.
This report provides conservative estimates for shipping, both for absolute cruise emissions and for the
comparisons with passenger cars (light duty vehicles – LDVs5
). Our analysis assumes that ships fully comply
with theexistingSOX and NOX standardsinplaceintherelevant geographicallocations. Thishas beenshown
not to be always the case with some ships being found to violate the standards including some cruise
ships.viii
On the other hand, the “dieselgate” scandal has unearthed ample evidence of consistent cheating
by car manufacturers of emission standards using defeat devices. This masks the fact that real world
passenger vehicle emissions exceed standards by a considerable degree. For this reason, we have based
vehicle emission levels, for comparison with cruise ships, on verified real-world emission factors, which
have been shown to be several times higher than legal limits. Furthermore, the European passenger car
fleet is assumed for this study to be exclusively composed of diesel cars, which have better CO2 but a worse
NOX performance compared to petrol cars. As the comparisons rely on the ship emissions being divided by
those of the passenger cars, the final results are therefore likely to be on the conservative i.e. they may well
underestimate the comparative extent of air pollution from cruise ships versus cars.
Figure 2: EU Sulphur standards for marine and road fuels
4
Norway has also mandated 0.1% Sulphur fuels for ships sailing in the Norwegian fjord from March 2019.
5
In general, LDVs also include vans, too. But in this report, we concentrate only on passenger cars.
7. 6
a study by
3. Findings
General findings for Europe
The report found that in 2017, 203 cruise ships in Europe emitted about 62 kt of SOX, 155 kt of NOX, 10 kt of
PM and more than 10 Mt of CO2 (table 1). Most of these emissions (especially SOX) took place in the
Mediterranean Sea and other major touristic destinations, but also along the coasts of the key member
states where cruise ships depart from/terminate at or operate around. (Figures 1 and 3). CO2 emissions from
the 203 analysed ships alone (covering only the sailing time in European EEZs) are on par with total national
GHG emissions of Latvia, Luxembourg and Cyprus, but twice as big as the total national GHGix
emissions of
Malta.
Table 1: Fuel consumption and air emissions from cruise ships in Europe in 2017*.
Number of
cruise ships
Total SOX
(kt)
Total NOX
(kt)
Total PM
(kt)
Total CO2
(kt)
Total Fuel consumption
(kt)
203 62 155 10 10,286 3,267
* Geographic scope: EU EEZ, Norway (incl. Svalbard), Iceland, Albania, Montenegro and Denmark’s Greenland, Bornholm, and Faroe
Islands.
Figure 3: Heatmap of SOX emissions from cruise ships in 2017, T&E.
Ranking of cruise ship companies by air pollution
Table 2 ranks, on the basis of SOX, the top 30 cruise ship companies that emitted the largest amount of air
pollution while sailing in European EEZs. In particular, 47 ships of cruise brands owned by the global
Carnival Corporation & PLC emitted about 10 times more SOX in European EEZs than 260+ million passenger
vehicles in Europe (figure 4). Global Royal Caribbean Cruises ranks second emitting about 4 times more SOX
8. 7
a study by
than all of European cars. Among the luxury cruise brands, Costa Cruises, MSC Cruises, P&O Cruises, AIDA
Cruises and Royal Caribbean International were the biggest emitters of the luxury brands in 2017.
Figure 4: Comparison of SOX emissions in 2017 by Carnival-owned ships with all European passenger cars, T&E.
Table 2: Ranking of top 30 cruise shipping companies for SOX emissions in European EEZ in 2017.
Ranking
Cruise companies
Parent
company
#
ships
Emissions from the cruise ships
(kg)
Ratio of emissions from
cruise ships to LDVs
SOX PM NOX SOX PM NOX
1 Costa Cruises Carnival 9 10,789,223 1,654,527 19,891,566 337% 1.11% 2%
2 MSC Cruises 11 10,235,089 1,577,045 18,847,762 319% 1.06% 2%
3 P&O Cruises Carnival 7 7,019,625 1,113,087 15,161,168 219% 0.75% 1%
4
Royal Caribbean
International
Royal
Caribbean
Cruises
8 5,513,187 860,836 11,102,580 172% 0.58% 1%
5 AIDA Cruises Carnival 12 4,718,663 797,561 14,219,074 147% 0.54% 1%
6
Norwegian Cruise
Line
6 3,888,899 606,330 8,981,323 121% 0.41% 1%
7 Princess Cruises Carnival 8 2,845,009 456,871 6,673,180 89% 0.31% 1%
8 Hurtigruten 10 2,800,801 525,805 7,531,572 87% 0.35% 1%
9 Cunard Line Carnival 3 2,718,473 440,601 5,399,197 85% 0.30% 1%
10 TUI Cruises
Royal
Caribbean
Cruises
5 2,446,595 413,577 6,374,538 76% 0.28% 1%
11 Marella Cruises 5 2,261,468 381,540 6,217,960 71% 0.26% 1%
9. 8
a study by
Ranking
Cruise companies
Parent
company
#
ships
Emissions from the cruise ships
(kg)
Ratio of emissions from
cruise ships to LDVs
SOX PM NOX SOX PM NOX
12 Celebrity Cruise
Royal
Caribbean
Cruises
4 2,247,077 355,824 4,770,378 70% 0.24% 0%
13 Oceania Cruises 5 1,698,406 263,715 3,589,772 53% 0.18% 0%
14 Seabourn Cruise Line Carnival 3 1,128,800 170,082 1,907,724 35% 0.11% 0%
15
Cruise & Maritime
Voyages
5 1,032,019 193,871 4,599,622 32% 0.13% 0%
16 Pullmantur Cruises
Royal
Caribbean
Cruises
3 859,719 157,743 2,965,637 27% 0.11% 0%
17 Holland America Line Carnival 5 856,837 150,514 3,241,168 27% 0.10% 0%
18 Silversea Cruises
Royal
Caribbean
Cruises
6 751,978 128,240 1,989,050 23% 0.09% 0%
19
Fred. Olsen Cruise
Lines
4 677,119 131,211 2,751,768 21% 0.09% 0%
20 Viking Cruises 4 587,021 95,838 1,627,405 18% 0.06% 0%
21
Regent Seven Seas
Cruises
3 564,809 89,275 1,231,596 18% 0.06% 0%
22 Phoenix Reisen 4 540,105 103,356 2,078,439 17% 0.07% 0%
23 Disney Cruise Line 1 402,250 64,966 1,388,042 13% 0.04% 0%
24 Saga Cruises 2 380,120 71,238 1,453,249 12% 0.05% 0%
25 Azamara Club Cruises
Royal
Caribbean
Cruises
2 357,865 55,085 701,833 11% 0.04% 0%
26 Star Cruises 1 311,388 58,325 887,864 10% 0.04% 0%
27 Mano Maritime 1 303,747 48,615 623,154 9% 0.03% 0%
28
Compagnie du
Ponant
3 261,582 40,769 445,296 8% 0.03% 0%
29 Celestyal Cruises 1 237,464 43,641 635,022 7% 0.03% 0%
30 Crystal Cruises 2 212,753 34,607 709,833 7% 0.02% 0%
* Partial ownership
Port-level findings of cruise air pollution
The resolution of the modelling permits the calculation of cruise ship emissions at the port and port city
levels. These values were then compared to the city or port level fleet of light duty vehicles. Tables 3, A.2.1
and A.2.3 summarise the findings for SOX, PM and NOX emissions, respectively.
Tables 3 and A.2.1 shows that the top 10 most exposed cities to SOX and PM from cruise ships are almost
exclusively located in two countries, Spain and Italy. Barcelona, Palma Mallorca and Venice are the most
cruise ship polluted cities in Europe (figure 5). This can be explained by these countries being popular cruise
destinations with prolonged port calls, but also because they are located outside the SECAs where stringent
marine sulphur standards.
In large cities such as Barcelona, Marseille and Hamburg, cruise vessels emitted while docked at port about
2 to 5 times more SOX throughout 2017 than that emitted by these cities’ entire passenger car fleet during
the same year (Table 3).
10. 9
a study by
Figure 5: Top European cruise ship ports exposed to highest SOX emissions in 2017, T&E.
Table 3: Emissions of SOX from cruise ships and LDVs in top 50 cruise polluted European port cities in 2017*.
Ranking
Country
Port cities
Number
of cruise
ships
Port call
time
(hours
SOX from
cruise
ships
(kg)
Number of
registered
LDVs
SOX from
registered
LDVs
(kg)
Ratio of SOX
from cruise
ships and
LDVs
1 ES Barcelona 105 8,293 32,838 558,920 6,812 4.8
2 ES Palma Mallorca 87 6,766 28,011 245,005 2,986 9.4
3 IT Venezia 68 7,988 27,520 111,712 1,362 20.2
4 IT Civitavecchia 76 5,466 22,293 33,591 409 54.5
5 UK Southampton 42 4,510 19,734 261,696 3,189 6.2
6 PT Lisbon 115 7,953 16,111 374,855 4,569 3.5
7 ES
Santa Cruz de
Tenerife
75 4,363 15,605 115,574 1,409 11.1
8 FR Marseille 57 3,342 15,219 339,987 4,144 3.7
11. 10
a study by
Ranking
Country
Port cities
Number
of cruise
ships
Port call
time
(hours
SOX from
cruise
ships
(kg)
Number of
registered
LDVs
SOX from
registered
LDVs
(kg)
Ratio of SOX
from cruise
ships and
LDVs
9 ES Las Palmas 63 4,899 14,658 183,913 2,241 6.5
10 DK
Kobenhavns
Havn
71 4,069 14,425 206,054 2,511 5.7
11 DE Hamburg 42 3,539 14,079 767,202 9,351 1.5
12 IT Napoli 52 2,968 12,834 540,385 6,586 1.9
13 IT Genova 31 3,376 12,398 271,943 3,314 3.7
14 DE Warnemunde 35 2,615 11,245 122,514 1,493 7.5
15 ES
Arrecife de
Lanzarote
60 2,638 10,912 30,353 370 29.5
16 HR Rijeka 9 5,908 10,169 67,792 826 12.3
17 EE Tallinn 71 2,768 9,953 135,733 1,654 6.0
18 IT La Spezia 43 3,278 9,330 47,563 580 16.1
19 ES Cadiz 68 3,136 9,034 44,695 545 16.6
20 IT Savona 10 1,849 9,018 33,813 412 21.9
21 FR Le Havre 44 1,762 8,441 65,546 799 10.6
22 FI Helsinki 63 2,199 8,052 243,000 2,962 2.7
23 ES Ibiza 50 2,376 8,038 89,569 1,092 7.4
24 SE Stockholm 33 1,775 8,022 356,236 4,342 1.8
25 NL Rotterdam 18 1,538 7,714 225,210 2,745 2.8
26 UK Marchwood 18 1,549 7,327 -- -- --
27 BE Zeebrugge 45 1,577 7,213 57,049 695 10.4
28 NL Amsterdam 52 1,880 6,955 235,026 2,864 2.4
29 IS Reykjavik 64 2,598 6,481 79,887 974 6.7
30 IT Cagliari 45 1,486 6,477 100,600 1,226 5.3
31 NL Eemshaven 3 1,271 6,393 -- -- --
32 HR
Dubrovnik - Gruz
passenger port
40 2,791 6,344 27,173 331 19.2
33 DE Kiel 24 1,661 6,260 109,052 1,329 4.7
34 GI Gibraltar 76 1,795 6,231 17,000 207 30.1
35 IT Palermo 33 1,493 5,981 388,986 4,741 1.3
36 IT Messina 45 1,610 5,736 144,546 1,762 3.3
37 NO Alesund 58 2,048 5,651 -- -- --
38 SE Loudden 38 1,548 5,635 356,236 4,342 1.3
39 FR Nice 44 2,574 5,563 -- -- --
40 MC Monte-Carlo 48 2,644 5,516 -- -- --
41 FR Cannes 33 2,947 5,366 36,556 446 12.0
42 HR Split 47 3,535 5,266 89,473 1,090 4.8
43 IE Dublin 55 1,878 5,241 -- -- --
44 NO Oslo 43 1,393 5,017 -- -- --
45 ES
Puerto del
Rosario
17 1,194 4,982 19,856 242 20.6
46 ES Valencia 56 1,462 4,917 359,938 4,387 1.1
12. 11
a study by
Ranking
Country
Port cities
Number
of cruise
ships
Port call
time
(hours
SOX from
cruise
ships
(kg)
Number of
registered
LDVs
SOX from
registered
LDVs
(kg)
Ratio of SOX
from cruise
ships and
LDVs
47 DE Bremerhaven 26 2,368 4,799 -- -- --
48 ES Malaga 62 1,667 4,380 269,170 3,281 1.3
49 FR La Seyne-sur-Mer 29 1,003 4,369 -- -- --
50 IT Bari 13 906 4,354 178,521 2,176 2.0
* passenger vehicle numbers in some cities refer to broader regional figures.
The analysis shows that European major cruise ship destinations are exposed to amounts of cruise NOX
equivalent to sizeable share of their entire car fleets. For example, the 57 cruise ships which called at
Marseilles in 2017 emitted about as much NOX as a quarter of the city’s 340,000 passenger cars (Table A.2.2).
In smaller port cities, such as Civitavecchia or Venice, cruise ships emit more NOX than the total local
passenger car fleet.
These figures are likely to get worse in the coming years, because unlike SOX, NOX emissions remain largely
unaffected by local, regional or global standards on the sulphur in marine fuels. The north European NECA
only applies to new ships built after 2021 and they are only required to operate their NOX control devices
(e.g. selective catalytic reduction – SCR) when operating in NECAs. Therefore, existing European NECAs will
unlikely have any impact on NOX emissions in the South. Secondly, even in NECAs, it will take more than 30
years for fleet replacement and the consequent impact of a more stringent ship NOX standard on maritime
emissions.x
This progressive NECA obligation on cruise ships will also likely take place against the backdrop
of the accelerated transition of road transport to electric vehicles (EVs), which are emissions free, hence
augmenting the share of ship emissions in European port cities compared to vehicle sources.
Country-level findings of cruise air pollution
Comparative analysis of SOX emissions from cruise ships and registered passenger cars reveals staggering
results. In main tourist destination countries and countries with coastlines along the main shipping lines,
maritime SOX emissions exceed many times over the SOX emissions from all the registered passenger
vehicles ineach country. Ingeneral, 203 cruise ships alone emitted about20 times more SOX alongEuropean
coasts than all of Europe’s 260+ million passenger vehicles in 2017 (table 4 and figure 6).
In absolute terms, the Spanish coast is the most exposed to ship air pollution, with about 15 kt of SOX
emitted by 172 cruise ships in the country’s EEZ in 2017. This is about 50 times more than the total SOX
emissionsby Spain’s 23 millionpassenger vehiclesinthe same year. Inrelative termsCroatiahas the highest
ratio of ship to LDV SOX emissions among the EU countries, with 78 cruise ships outdoing the national
passenger vehicles by a factor of 189. The coastal counties least exposed to air pollution are Bulgaria and
Romania with passenger vehicles emitting more SOX than cruise ships, a result of significantly lower cruise
ship movements in their waters.
Four out of the top five European countries exposed to cruise ship SOx (Spain, Italy, Norway, Greece and
France) are major tourist destinations in the South, notably, in the Mediterranean basin. This not only
reflects the large amount of time that cruise ships spend in the South but also the less stringent marine
sulphur standard (i.e. 1.5%) in force outside the SECAs (i.e. 0.1%).
13. 12
a study by
Figure 6: Comparison of SOx pollution from cruise ships in individual EEZs and domestic car fleet in each
corresponding country.
Ships SOX will still remain considerably large compared to passenger car fleet even after the introduction of
the global 2020 marine sulphur cap (table A.3.1).
Table 4: Emissions of SOX from cruise ships and LDVs in European countries in 2017.
Country Number of
cruise ships**
Sailing time
(hours)
SOX from cruise
ships
(kg)
Number of
registered LDVs
(thousand)
SOX from
registered LDVs†
(kg)
Ratio of SOX
from cruise
ships and LDVs
ES 172 129,742 14,496,409 22,877 278,818 51.99
IT 141 128,164 13,895,078 37,876 461,627 30.10
EL 115 97,949 7,674,156 5,236 63,814 120.26
FR 162 63,541 5,949,724 32,074 390,914 15.22
NO 110 160,253 5,260,533 2,663 32,455 162.09
PT 154 46,042 5,107,572 4,850 59,114 86.40
HR 78 42,324 3,589,093 1,553 18,926 189.6
UK 162 75,670 1,714,826 31,834 387,991 4.4
IS 72 19,396 988,982 240 2,931 337.4
AL 67 5,460 784,888 436 5,314 147.7
14. 13
a study by
Country Number of
cruise ships**
Sailing time
(hours)
SOX from cruise
ships
(kg)
Number of
registered LDVs
(thousand)
SOX from
registered LDVs†
(kg)
Ratio of SOX
from cruise
ships and LDVs
DK 107 29,547 544,460 2,466 30,049 18.1
MT 83 7,490 502,778 283 3,448 145.8
IE 71 6,687 448,425 2,049 24,969 18.0
ME 62 3,830 319,311 193 2,355 135.6
CY 34 8,192 220,746 508 6,195 35.6
SE 80 34,780 182,034 4,768 58,112 3.1
DE 92 21,692 157,366 45,804 558,245 0.3
NL 97 19,612 146,228 8,223 100,220 1.5
FI 72 11,823 79,355 3,346 40,780 2,0
EE 71 8,509 70,904 703 8,569 8.3
BE 86 2,990 28,461 5,731 69,848 0.4
LV 43 3,288 17,033 664 8,095 2.1
PL 41 3,123 13,513 21,675 264,175 0.1
SI 33 1,228 13,471 1,097 13,364 1.0
LT 36 974 4,183 1,299 15,829 0.3
BG 3 126 3,846 3,144 38,312 0.1
RO 3 62 987 5,472 66,697 0.01
CZ* 0 0 0 5,308 64,691 0.0
LU* 0 0 0 391 4,765 0.0
HU* 0 0 0 3,313 40,381 0.0
AT* 0 0 0 4,822 58,764 0.0
SK* 0 0 0 2,122 25,860 0.0
TOTAL 203 932,491 62,222,174 263,019 3,205,628 19.4
* refers to landlocked countries with no coastline; hence, no maritime emissions.
** the sum of cruise ships in each country is larger than the total of the 203 ships in European EEZs, because the same cruise ships
travel across multiple EEZs.
†
SOX emissions from LDVs are estimated by T&E. Number of registered can be found in the EU Statistical pocketbook, 2018.
With regards to NOX ship emissions, the comparativepicture is somewhat different. Eventhough the relative
distribution of NOX emissions from cruise ships among European countries mirrors that of SOX, cruise NOX
emissions are generally inferior to those of passenger vehicles. This can be partially explained by the real-
world emission factors that we used to estimate car NOX, which have been shown to be several times higher
than legal limits. This creates a distorted comparative picture between cars and cruise ships, as real-world
car emissions appear to be much larger than the legal limits of ships, which this analysis is based on. In
general, NOX emissions from the analysed cruise ships are about 15% of total NOX emitted by Europe’s
15. 14
a study by
passenger car fleet in a year. But there are significant variations. For example, in Norway and Croatia cruise
ships emitted more NOX than these countries’ entire domestic passenger car fleet in a year. In Greece,
Denmark, Malta and Estonia these figures a handful of cruise vessels were responsible for more NOX than
the majority of these countries’ domestic car fleet (table A.2.3).
In absolute terms, the Spanish and Italian coasts are still the most exposed areas to ship NOX emissions,
with about 27 and 25 kt of NOX emitted by cruise vessels in these countries’ EEZs in 2017, while Bulgaria and
Romania remain the least exposed.
Similar to SOX, 4 out of top 5 NOX exposed European countries are major tourist destinations in Southern
Europe, notably, in the Mediterranean basin. This is most explained by the large amount of time that cruise
ships spend along the coasts of the Southern European countries.
PM emissions from shipping are generally linked to the quality of fuel used and are a function of fuel sulphur
content. Distribution of PM too follows a similar pattern to SOX and comparisons to PM2.5 from the
European car fleet are similar to that of NOX (table A.2.4).
4. Conclusions and recommendations
Analysis shows that even a relatively small number of cruise ships emit vast amounts of air pollution. High
emissions are due to insufficient stringency of the marine fuel quality and engine emissions standards.
These are further compounded by the large size of marine engines and longer operational times of cruise
vessels in ports and closer to the coasts. The evidence shows that even SECA ports are still exposed to high
amounts of SOX and PM from ships. Emissions at berth are of a special concern given that main cruise
passenger terminals are very close to densely populated cities. This is despite the 0.1% standard in place
for all European ports for passenger ships with port calls longer than 2 hours.
In 2020, marine sulphur standard for ships sailing in the EU EEZ outside the SECAs and outside the (berths
in) European ports will improve from 1.5% to 0.5%. This will have considerable impact on ship air pollution.
However, emissions from cruise ships will still remain considerably large compared to the emissions from
the European passenger car fleet. As table A.3.1 demonstrates, even after the 2020 standard, a handful of
cruise ships will still emit about 18, 10 and 41 times more SOX than all of the passenger vehicles respectively
in Spain, Italy and Greece – top cruise ship polluted countries in Europe. Also, 2020 standard will have no
impact on emissions in ports and in SECAs, because the standard in SECAs and in European ports is more
stringent than the upcoming global standard (0.1% vs. 0.5%).
Fortunately, there are technologies available to eliminate all ship emissions at berth and at sea. Notably,
shore-sideelectricity(SSE), the possibilityforships atberth to connect to the localelectricity grid and power
their on-board equipment, is a proven and mature technology which can greatly reduce the local air
pollution generated by docked vessels in ports. The European Alternative Fuels Infrastructure Directive
requires SSE in major European ports, but only if it is cost-beneficial; as a result, there is little uptake so far
by ships and ports. Two main issues are hindering the widespread adoption of SSE:
1. A “chicken-and-egg” problem, whereby owners of the vessels do not invest in ships to make them
SSE-compatible because of limited connections available in ports, while at the same time ports do
not invest in SSE connections because few ships can use them.
2. There is also a market distortion because of taxation. Shore-side electricity is taxed under the 2003
EU Energy Tax Directive, while fossil marine fuels are tax exempt. Such an uneven playing field
creates a disincentive for ship owners to use SSE in ports wherever these technologies are available.
This situation further disincentivises ports interested in SSE capacity.
16. 15
a study by
Recommendation 1: In order to create a level playing field between SSE and fossil fuels used on-board, the
EU should exempt by default SSE from electricity taxation for a transitional period of time, and/or tax at an
equivalent rate fossil fuels used on board.
Recommendation 2: The EU should mandate zero emission berth standard in European ports, hence
requiring ships to use SSE or implement alternative measures to achieve equivalent results. This would help
ports that have invested in SSE avoid stranded assets.
Recommendation 3: Extend SECA standards to the rest of the EU seas and further tighten the SECA
standard, notably, in favour of 10ppm sulphur standard (0.001%) currently applicable to road transport.
Recommendation 4: Given that NOX from existing and new ships is of great concern and that upcoming
Baltic and North Sea and English Channel nitrogen emissions control areas (NECAs) will only address
emissions from new ships built after 2021 alone, there is a need to tackle NOX from existing ships in all
European waters (outside ports). For this reason, we recommend for a stand-alone EU measure, including
possibly a financial mechanism similar to the Norwegian NOX Fund. Ships can use SCR systems and diesel
particulate filters (DPF) to reduce their NOX and PM.
Recommendation 5: Consider zero emission control areas, as an extension of zero emission berth
standard, in European territorial waters, especially in the major touristic destinations.
Ship sourced air pollution is a huge problem in many parts of the world. Even though the scope of this
analysis was limited to continental Europe and surrounding islands only, one could expect similar levels of
ship pollution elsewhere, too. For this reason, the recommendations of this report can be valid for countries
as well.
17. 16
a study by
Appendix 1 – Detailed methodology
Transport & Environment acquired automatic identification system (AIS) data for the global cruise ship fleet
in 2017. These data contain information such as the IMO number, geographical coordinates, bearing, speed
over ground (SOG), and the time of the signal. These data were analysed using a suite of in-house programs
for filtering and collating the data for post-processing using our in-house ship energy and emissions model.
This appendix outlines the methodology employed in the pre-processing and filtering of the data, along
with the merging of other datasets.
The first step was to identify the cruise ships that operated in European waters. This involved a pre-filtering
phase whereby ship coordinates were filtered based on a geographical polygon around the European
continent and into theAtlantic Ocean (Figure A1.1). Followingthis, ship coordinates weretagged depending
on whether or not they were in the North Sea SECA, and similarly ships were tagged as being in open sea or
within a country’s EEZ using a ray-casting algorithm. We used a database of port locations to assign port
tags to the ship movements. Emissions were assigned to ports under the condition of SOG < 3 knots and the
distance was less than 12 nautical miles. Dry docks were also identified, and whenever ships were
registered as being within a dry-dock through spatial filtering, those data were deleted from the analysis.
Figure A1.1: Geographical filtering (red), SECA (green), and insert showing the Portuguese EEZ (blue).
Spurious velocities were filtered in two ways. The first compared the calculated velocity (from distance and
time) to the recorded SOG; a clustering algorithm was used to automatically identify outliers that were
deleted. In a second step, any remaining readings that had a SOG > 35 knots had the velocity corrected to
that of the previous time step. The time interval, dt, was calculated from the signal times by dt = ti – ti-1,
where i represents a data row. This metric allows the calculation of fuel consumption and emissions of
pollutants across the records. The data had nominal dt = 1 h, however some ships or some regions yielded
higher frequency readings, dt < 1. In this case the data was under-sampled so that dt ~ 1, mainly for the
performance of the downstream model. On the other hand, if dt > 5, the following data row was deleted
and dt set to 1. This covered to common events: ships that pass through the geographic boundaries (for
example travelling to and from Europe to the Americas and back), and more rarely for ships that were
inactive in a port.
These filtered and collated results were then fed into our in-house ship energy and emissions model, to
compute fuel consumption and emissions. The model allowed us to sum the pollutants for ports and for
each EEZ. Results were compared to the ICCT study, and our results correspond well to their results for
cruise ships using operational hours as a proxy for emissions.
18. 17
a study by
Appendix 2 – Detailed Results
Tables below provide detailed breakdown of emissions per country and per port city.
Table A.2.1: PM emissions from cruise ships and LDVs in the top 50 cruise polluted European port cities in 2017.
Ranking
Country
Port cities
Number
of cruise
ships
Port call
time
(hours)
PM from
cruise
ships
(kg)
Number of
registered
LDVs
PM2.5 from
registered
LDVs
(kg)
Cruise ship
PM2.5 vs.
LDVs*
(%)
1 ES Barcelona 105 8,293 13,101 558,920 345,439 3.5%
2 ES Palma Mallorca 87 6,766 11,196 245,005 151,425 6.8%
3 IT Venezia 68 7,988 10,961 111,712 49,729 20.3%
4 IT Civitavecchia 76 5,466 8,898 33,591 14,953 54.7%
5 UK Southampton 42 4,510 7,890 261,696 161,347 4.5%
6 PT Lisbon 115 7,953 6,335 374,855 319,430 1.8%
7 ES
Santa Cruz de
Tenerife
75 4,363 6,205 115,574 71,430 8.0%
8 FR Marseille 57 3,342 6,091 339,987 157,601 3.6%
9 ES Las Palmas 63 4,899 5,834 183,913 113,667 4.7%
10 DK Kobenhavns Havn 71 4,069 5,738 206,054 93,640 5.6%
11 DE Hamburg 42 3,539 5,612 767,202 272,615 1.9%
12 IT Napoli 52 2,968 5,138 540,385 240,556 2.0%
13 IT Genova 31 3,376 4,946 271,943 121,057 3.8%
14 DE Warnemunde 35 2,615 4,492 122,514 43,534 9.5%
15 ES
Arrecife de
Lanzarote
60 2,638 4,357 30,353 18,760 21.4%
16 EE Tallinn 71 2,768 3,960 135,733 63,184 5.8%
17 HR Rijeka 9 5,908 3,878 67,792 28,842 12.4%
18 IT La Spezia 43 3,278 3,721 47,563 21,173 16.2%
19 IT Savona 10 1,849 3,616 33,813 15,052 22.1%
20 ES Cadiz 68 3,136 3,572 44,695 27,624 11.9%
21 FR Le Havre 44 1,762 3,383 65,546 30,384 10.2%
22 SE Stockholm 33 1,775 3,210 356,236 187,115 1.6%
23 FI Helsinki 63 2,199 3,205 243,000 149,564 2.0%
24 ES Ibiza 50 2,376 3,198 89,569 55,358 5.3%
25 NL Rotterdam 18 1,538 3,095 225,210 108,086 2.6%
26 UK Marchwood 18 1,549 2,935 -- -- --
27 BE Zeebrugge 45 1,577 2,888 57,049 16,135 16.5%
28 NL Amsterdam 52 1,880 2,765 235,026 112,797 2.3%
29 IT Cagliari 45 1,486 2,592 100,600 44,783 5.3%
30 NL Eemshaven 3 1,271 2,565 -- -- --
31 IS Reykjavik 64 2,598 2,559 79,887 -- --
32 HR
Dubrovnik - Gruz
passenger port
40 2,791 2,523 27,173 11,561 20.1%
33 DE Kiel 24 1,661 2,491 109,052 38,750 5.9%
34 GI Gibraltar 76 1,795 2,485 17,000 10,481 21.8%
19. 18
a study by
Ranking
Country
Port cities
Number
of cruise
ships
Port call
time
(hours)
PM from
cruise
ships
(kg)
Number of
registered
LDVs
PM2.5 from
registered
LDVs
(kg)
Cruise ship
PM2.5 vs.
LDVs*
(%)
35 IT Palermo 33 1,493 2,393 388,986 173,159 1.3%
36 IT Messina 45 1,610 2,296 144,546 64,346 3.3%
37 SE Loudden 38 1,548 2,239 356,236 187,115 1.1%
38 NO Alesund 58 2,048 2,232 -- -- --
39 FR Nice 44 2,574 2,199 -- -- --
40 MC Monte-Carlo 48 2,644 2,161 -- -- --
41 FR Cannes 33 2,947 2,130 36,556 16,946 11.6%
42 HR Split 47 3,535 2,076 89,473 38,066 5.0%
43 IE Dublin 55 1,878 2,070 -- -- --
44 NO Oslo 43 1,393 1,994 -- -- --
45 ES Puerto del Rosario 17 1,194 1,990 19,856 12,272 14.9%
46 ES Valencia 56 1,462 1,957 359,938 222,459 0.8%
47 DE Bremerhaven 26 2,368 1,857 -- -- --
48 FR La Seyne-sur-Mer 29 1,003 1,750 -- -- --
49 IT Bari 13 906 1,746 178,521 79,470 2.0%
50 ES Malaga 62 1,667 1,733 269,170 166,360 1.0%
* The majority (about 92%) of ship PM is PM 2.5. This has been taken into account when comparing to car PM 2.5.
Table A.2.2: Emissions of NOX from cruise ships and LDVs in top 50 cruise polluted European port cities in 2017.
Ranking
Country
Port cities
Number
of cruise
ships
Port call
time
(hours)
NOX from
cruise
ships
(kg)
Number of
registered
LDVs
NOX from
registered
LDVs
(kg)
Cruise ship
NOX vs. LDVs
(%)
1 ES Barcelona 105 8,293 729,481 558,920 2,562,913 28.5%
2 ES Palma Mallorca 87 6,766 629,833 245,005 1,123,464 56.1%
3 IT Venezia 68 7,988 600,337 111,712 436,279 137.6%
4 IT Civitavecchia 76 5,466 500,326 33,591 131,186 381.4%
5 UK Southampton 42 4,510 419,435 261,696 1,142,692 36.7%
6 PT Lisbon 115 7,953 374,811 374,855 1,976,056 19.0%
7 ES
Santa Cruz de
Tenerife
75 4,363 366,886 115,574 529,962 69.2%
8 ES Las Palmas 63 4,899 341,486 183,913 843,328 40.5%
9 FR Marseille 57 3,342 326,460 339,987 1,285,961 25.4%
10 DE Hamburg 42 3,539 311,088 767,202 2,526,310 12.3%
11 DK Kobenhavns Havn 71 4,069 310,488 206,054 806,206 38.5%
12 IT Napoli 52 2,968 303,708 540,385 2,110,417 14.4%
13 HR Rijeka 9 5,908 273,622 67,792 249,916 109.5%
14 IT Genova 31 3,376 261,550 271,943 1,062,045 24.6%
15 ES
Arrecife de
Lanzarote
60 2,638 254,580 30,353 139,183 182.9%
16 DE Warnemunde 35 2,615 245,380 122,514 403,425 60.8%
17 ES Cadiz 68 3,136 231,880 44,695 204,948 113.1%
20. 19
a study by
Ranking
Country
Port cities
Number
of cruise
ships
Port call
time
(hours)
NOX from
cruise
ships
(kg)
Number of
registered
LDVs
NOX from
registered
LDVs
(kg)
Cruise ship
NOX vs. LDVs
(%)
18 EE Tallinn 71 2,768 215,364 135,733 548,181 39.3%
19 IT La Spezia 43 3,278 194,646 47,563 185,752 104.8%
20 IT Savona 10 1,849 191,830 33,813 132,053 145.3%
21 FR Le Havre 44 1,762 181,303 65,546 247,920 73.1%
22 ES Ibiza 50 2,376 176,276 89,569 410,716 42.9%
23 SE Stockholm 33 1,775 175,943 356,236 1,443,419 12.2%
24 FI Helsinki 63 2,199 175,434 243,000 1,134,968 15.5%
25 NL Rotterdam 18 1,538 167,938 225,210 896,444 18.7%
26 UK Marchwood 18 1,549 166,317 -- -- --
27 NL Amsterdam 52 1,880 158,953 235,026 935,517 17.0%
28 BE Zeebrugge 45 1,577 155,433 57,049 162,113 95.9%
29 IS Reykjavik 64 2,598 152,799 79,887 -- --
30 GI Gibraltar 76 1,795 145,418 17,000 74,230 195.9%
31 IT Cagliari 45 1,486 144,070 100,600 392,883 36.7%
32 HR
Dubrovnik - Gruz
passenger port
40 2,791 140,259 27,173 100,174 140.0%
33 NL Eemshaven 3 1,271 135,395 -- -- --
34 DE Kiel 24 1,661 135,166 109,052 359,096 37.6%
35 FR Nice 44 2,574 133,791 -- -- --
36 NO Alesund 58 2,048 133,193 -- -- --
37 IT Messina 45 1,610 130,777 144,546 564,509 23.2%
38 IT Palermo 33 1,493 130,054 388,986 1,519,144 8.6%
39 SE Loudden 38 1,548 121,330 356,236 1,443,419 8.4%
40 MC Monte-Carlo 48 2,644 118,897 -- -- --
41 IE Dublin 55 1,878 117,721 -- -- --
42 ES Puerto del Rosario 17 1,194 116,939 19,856 91,049 128.4%
43 FR Cannes 33 2,947 116,119 36,556 138,269 84.0%
44 DE Bremerhaven 26 2,368 116,024 -- -- --
45 HR Split 47 3,535 113,167 89,473 329,844 34.3%
46 NO Oslo 43 1,393 111,166 -- -- --
47 ES Valencia 56 1,462 108,877 359,938 1,650,486 6.6%
48 FR La Seyne-sur-Mer 29 1,003 107,225 -- -- --
49 ES Malaga 62 1,667 106,979 269,170 1,234,272 8.7%
50 ES
Santa Cruz de la
Palma
39 1,122 93,058 7,213 33,075 281.4%
21. 20
a study by
Table A.2.3: Emissions of NOX from cruise ships and LDVs in European countries in 2017.
Country Number of
cruise ships**
Sailing time
(hours)
NOX from
cruise ships
(kg)
Number of
registered LDVs
(thousand)
NOX from
registered LDVs†
(kg)
Cruise ship NOX
vs. LDVs
(%)
ES 172 129,742 27,423,604 22,877 104,901,104 26%
IT 141 128,164 25,395,875 37,876 147,921,275 17%
NO 110 160,253 18,856,703 2,663 13,122,591 144%
EL 115 97,949 14,899,584 5,236 23,438,486 64%
FR 162 63,541 12,706,186 32,074 121,316,906 10%
UK 162 75,670 11,333,184 31,834 139,004,386 8%
PT 154 46,042 9,595,870 4,850 25,568,081 38%
HR 78 42,324 6,373,174 1,553 5,724,808 111%
DK 107 29,547 5,314,834 2,466 9,646,650 55%
SE 80 34,780 4,170,896 4,768 19,319,524 22%
DE 92 21,692 3,669,861 45,804 150,825,969 2%
NL 97 19,612 3,402,294 8,223 32,731,391 10%
IS 72 19,396 2,155,163 240 -- --
FI 72 11,823 1,793,443 3,346 15,628,013 11%
EE 71 8,509 1,610,180 703 2,839,592 57%
AL 67 5,460 1,302,371 436 -- --
MT 83 7,490 1,127,542 283 1,544,274 73%
IE 71 6,687 982,858 2,049 6,750,547 15%
CY 34 8,192 686,612 508 2,598,464 26%
BE 86 2,990 647,698 5,731 16,285,433 4%
ME 62 3,830 593,984 193 -- --
LV 43 3,288 404,891 664 2,064,949 20%
PL 41 3,123 318,400 21,675 116,825,406 0%
LT 36 974 93,755 1,299 3,432,384 3%
SI 33 1,228 55,800 1,097 4,351,971 1%
BG 3 126 10,923 3,144 9,962,539 0%
RO 3 62 3,296 5,472 21,105,378 0%
CZ* 0 0 0 5,308 21,400,673 0%
LU* 0 0 0 391 822,064 0%
22. 21
a study by
Country Number of
cruise ships**
Sailing time
(hours)
NOX from
cruise ships
(kg)
Number of
registered LDVs
(thousand)
NOX from
registered LDVs†
(kg)
Cruise ship NOX
vs. LDVs
(%)
HU* 0 0 0 3,313 14,307,402 0%
AT* 0 0 0 4,822 21,214,471 0%
SK* 0 0 0 2,122 8,303,397 0%
TOTAL 203 932,491 155,085,540 263,019 1,062,958,126 15%
* refers to landlocked countries with no coastline; hence, no maritime emissions.
** the sum of cruise ships in each country is larger than total 69 ships in European EEZ, because the same cruise ships travel across
multiple EEZs.
†
NOX emissions from LDVs are also estimated by T&E. Number of registered can be found in the EU Statistical pocketbook, 2018.
Table A.2.4: Emissions of PM from cruise ships and LDVs in European countries in 2017.
Country Number of
cruise ships**
Sailing time
(hours)
PM from cruise
ships*
(kg)
Number of
registered LDVs
(thousand)
PM 2.5 from
registered
LDVs†
(kg)
Cruise ship
PM2.5 vs. LDVs††
(%)
ES 172 129,742 2,283,225 22,877 14,138,969 15%
IT 141 128,164 2,168,985 37,876 16,860,791 12%
EL 115 97,949 1,227,580 5,236 2,879,151 39%
NO 110 160,253 1,002,787 2,663 1,895,734 49%
FR 162 63,541 955,579 32,074 14,867,999 6%
PT 154 46,042 809,360 4,850 4,133,092 18%
HR 78 42,324 558,084 1,553 660,678 78%
UK 162 75,670 378,715 31,834 19,627,351 2%
IS 72 19,396 164,450 240 -- --
DK 107 29,547 139,399 2,466 1,120,451 11%
AL 67 5,460 121,677 436 0 --
MT 83 7,490 82,407 283 255,951 30%
IE 71 6,687 78,799 2,049 689,619 11%
SE 80 34,780 76,145 4,768 2,504,444 3%
DE 92 21,692 65,285 45,804 16,275,692 0%
NL 97 19,612 60,148 8,223 3,946,470 1%
ME 62 3,830 50,608 193 -- --
CY 34 8,192 39,294 508 390,211 9%
FI 72 11,823 33,132 3,346 2,059,426 1%
23. 22
a study by
Country Number of
cruise ships**
Sailing time
(hours)
PM from cruise
ships*
(kg)
Number of
registered LDVs
(thousand)
PM 2.5 from
registered
LDVs†
(kg)
Cruise ship
PM2.5 vs. LDVs††
(%)
EE 71 8,509 29,339 703 327,295 8%
BE 86 2,990 11,836 5,731 1,620,883 1%
LV 43 3,288 7,183 664 208,927 3%
PL 41 3,123 5,606 21,675 19,624,461 0%
SI 33 1,228 2,484 1,097 522,984 0%
LT 36 974 1,724 1,299 332,776 0%
BG 3 126 647 3,144 1,058,342 0%
RO 3 62 171 5,472 2,341,336 0%
CZ* 0 0 0 5,308 2,721,813 0%
LU* 0 0 0 391 70,931 0%
HU* 0 0 0 3,313 1,922,878 0%
AT* 0 0 0 4,822 2,805,553 0%
SK* 0 0 0 2,122 863,975 0%
TOTAL 203 932,491 10,357,785 263,019 136,728,184 7%
* refers to landlocked countries with no coastline; hence, no maritime emissions.
** the sum of cruise ships in each country is larger than total 203 ships in European EEZ, because the same cruise ships travel across
multiple EEZs.
†
PM emissions from LDVs are also estimated by T&E. Number of registered can be found in the EU Statistical pocketbook, 2018.
††
The majority (about 92%) of ship PM is PM 2.5. This has been taken into account when comparing to car PM 2.5.
24. 23
a study by
Appendix 3 – Projected impact of 2020 standard on SOX emissions
In 2020, sulphur standard for marine fuels will be tightened under the MARPOL Annex VI and EU Sulphur
Directive. For cruise ships sailing in the EU EEZ outside the ports and SECAs, this will be a three-fold
improvement – from 1.5% down to 0.5%. Anticipating this change in legislation, this report also estimated
the potential impact of the 2020 sulphur standard on emissions. As the results presented in Table A.3.1
demonstrate, even after the new sulphur standard, cruise ships will remain a huge source of SOX emissions
in almost all Europe countries. In the most cruise SOX polluted European countries, namely, Spain, Italy and
Greece, cruise ships will keep exceeding domestic LDV fleets by a factor of 10-40.
Table A.3.1: Projected emissions of SOX from cruise ships and LDVs in European countries in 2020.
Country Number of
cruise ships**
Sailing time
(hours)
SOX from cruise
ships
(kg)
Number of
registered LDVs
(thousand)
SOX from
registered LDVs
(kg)
Ratio of SOX
from cruise
ships and LDVs
ES 172 129,742 4,936,254 22,877 278,818 17.7
IT 141 128,164 4,732,440 37,876 461,627 10.3
EL 115 97,949 2,607,930 5,236 63,814 40.9
FR 162 63,541 2,085,453 32,074 390,914 5.3
NO 110 160,253 1,992,580 2,663 32,455 61.4
PT 154 46,042 1,730,602 4,850 59,114 29.3
HR 78 42,324 1,214,178 1,553 18,926 64.2
UK 162 75,670 818,063 31,834 387,991 2.1
IS 72 19,396 338,450 240 2,931 115.5
DK 107 5,460 316,869 2,466 30,049 10.5
AL 67 29,547 261,759 436 5,314 49.3
SE 80 7,490 182,034 4,768 58,112 3.1
MT 83 6,687 175,944 283 3,448 51.0
DE 92 3,830 157,366 45,804 558,245 0.3
IR 71 8,192 154,721 2,049 24,969 6.2
NL 97 34,780 146,228 8,223 100,220 1.5
ME 62 21,692 107,882 193 2,355 45.8
CY 34 19,612 79,942 508 6,195 12.9
FI 72 11,823 79,355 3,346 40,780 1.9
EE 71 8,509 70,904 703 8,569 8.3
BE 86 2,990 28,461 5,731 69,848 0.4
LV 43 3,288 17,033 664 8,095 2.1
25. 24
a study by
Country Number of
cruise ships**
Sailing time
(hours)
SOX from cruise
ships
(kg)
Number of
registered LDVs
(thousand)
SOX from
registered LDVs
(kg)
Ratio of SOX
from cruise
ships and LDVs
PL 41 3,123 13,513 21,675 264,175 0.1
SI 33 1,228 5,541 1,097 13,364 0.4
LT 36 974 4,183 1,299 15,829 0.3
BG 3 126 1,350 3,144 38,312 0.0
RO 3 62 360 5,472 66,697 0.0
CZ* 0 0 0 5,308 64,691 0.0
LU* 0 0 0 391 4,765 0.0
HU* 0 0 0 3,313 40,381 0.0
AT* 0 0 0 4,822 58,764 0.0
SK* 0 0 0 2,122 25,860 0.0
TOTAL 203 932,491 22,259,396 263,019 3,205,628 6.9
* refers to landlocked countries with no coastline; hence, no maritime emissions.
** the sum of cruise ships in each country is larger than the total of the 203 ships in European EEZs, because the same cruise ships
travel across multiple EEZs.
26. Appendix 4 – Passenger car fleet in port cities
The table A.4.1. summarises the passenger car fleet numbers in major touristic port cities based on desk research. In some cases, the numbers refer to the size
of the car fleet in regions, as opposed to individual cities. Wherever possible, we have aimed to exclude electric vehicles.
Table A.4.1: Passenger car fleet in major touristic port cities, compiled by T&E.
Port city name Country
Number of
registered
passenger
cars
Source Year Source
Palma Mallorca ES 245,005
Ministerio del interior,
Dirección General de Tráfico
2019 https://sedeapl.dgt.gob.es/WEB_IEST_CONSULTA/
Marseille FR 339,987
Ministère de la Transition
écologique et solidaire
2019
Barcelona ES 558,920
Ministerio del interior,
Dirección General de Tráfico
2019 https://sedeapl.dgt.gob.es/WEB_IEST_CONSULTA/
Venezia IT 111,712 Automobile Club D'Italia 2017 http://www.aci.it/laci/studi-e-ricerche/dati-e-statistiche/autoritratto/autoritratto-2017.html
Rijeka HR 67,792
Ministarstvo Unutarnjih
Poslova
2019
Genova IT 271,943 Automobile Club D'Italia 2017 http://www.aci.it/laci/studi-e-ricerche/dati-e-statistiche/autoritratto/autoritratto-2017.html
Savona IT 33,813 Automobile Club D'Italia 2017 http://www.aci.it/laci/studi-e-ricerche/dati-e-statistiche/autoritratto/autoritratto-2017.html
Hamburg DE 767,202
Statistisches Amt für
Hamburg und Schleswig-
Holstein
2017
https://www.statistik-
nord.de/fileadmin/Dokumente/Statistische_Berichte/verkehr_umwelt_und_energie/H_I_2_j_HuS/H_I_2_j-
17_HH.pdf
Civitavecchia IT 33,591 Automobile Club D'Italia 2017 http://www.aci.it/laci/studi-e-ricerche/dati-e-statistiche/autoritratto/autoritratto-2017.html
Las Palmas ES 183,913
Ministerio del interior,
Dirección General de Tráfico
2019 https://sedeapl.dgt.gob.es/WEB_IEST_CONSULTA/
Santa Cruz de
Tenerife
ES 115,574
Ministerio del interior,
Dirección General de Tráfico
2019 https://sedeapl.dgt.gob.es/WEB_IEST_CONSULTA/
Palermo IT 388,986 Automobile Club D'Italia 2017 http://www.aci.it/laci/studi-e-ricerche/dati-e-statistiche/autoritratto/autoritratto-2017.html
Rotterdam NL 225,210
Centraal Bureau voor de
Statistiek
2019
https://statline.cbs.nl/Statweb/publication/?DM=SLNL&PA=37209hvv&D1=0-17&D2=80,241,489,500&D3=15-
19&HDR=T&STB=G1,G2&VW=T
Lisbon PT 374,855 Diario de Noticias 2017 https://www.dn.pt/sociedade/interior/lisboa-vai-ter-84-mil-lugares-de-estacionamento-pago-8656670.html
Arrecife de Lanzarote ES 30,353
Ministerio del interior,
Dirección General de Tráfico
2019 https://sedeapl.dgt.gob.es/WEB_IEST_CONSULTA/
27. 1
a study by
Southampton UK 261,696
UK Government, Department
for Transport
2018 https://www.dft.gov.uk/traffic-counts/area/regions/South+East/local-authorities/Southampton
Warnemunde DE 122,514 Kraftahrt-Bundesamt 2017 https://www.kba.de/DE/Statistik/Produktkatalog/produkte/Fahrzeuge/fz3_b_uebersicht.html
Kobenhavns Havn DK 206,054 Danmarks statistik 2019 http://www.statbank.dk/statbank5a/default.asp?w=1920
Le Havre FR 65,546
Ministère de la Transition
écologique et solidaire
2019
Cagliari IT 100,600 Automobile Club D'Italia 2017 http://www.aci.it/laci/studi-e-ricerche/dati-e-statistiche/autoritratto/autoritratto-2017.html
Ibiza ES 89,569
Ministerio del interior,
Dirección General de Tráfico
2019 https://www.diariodeibiza.es/pitiuses-balears/2018/02/24/eivissa-soporta-113-vehiculos-motor/971933.html
Livorno IT 86,497 Automobile Club D'Italia 2017 http://www.aci.it/laci/studi-e-ricerche/dati-e-statistiche/autoritratto/autoritratto-2017.html
Amsterdam NL 235,026
Centraal Bureau voor de
Statistiek
2019
https://statline.cbs.nl/Statweb/publication/?DM=SLNL&PA=37209hvv&D1=0-17&D2=80,241,489,500&D3=15-
19&HDR=T&STB=G1,G2&VW=T
Bari IT 178,521 Automobile Club D'Italia 2017 http://www.aci.it/laci/studi-e-ricerche/dati-e-statistiche/autoritratto/autoritratto-2017.html
La Spezia IT 47,563 Automobile Club D'Italia 2017 http://www.aci.it/laci/studi-e-ricerche/dati-e-statistiche/autoritratto/autoritratto-2017.html
Stockholm SE 356,236 SCB 2019
https://www.scb.se/en/finding-statistics/statistics-by-subject-area/transport-and-communications/road-
traffic/registered-vehicles/
Kiel DE 109,052 Kraftahrt-Bundesamt 2019 https://www.kba.de/DE/Statistik/Produktkatalog/produkte/Fahrzeuge/fz3_b_uebersicht.html
Tallinn EE 135,733 Tallinn City Office 2019 https://www.tallinn.ee/eng/Yearbooks-and-Statistics
Trieste IT 107,265 Automobile Club D'Italia 2017 http://www.aci.it/laci/studi-e-ricerche/dati-e-statistiche/autoritratto/autoritratto-2017.html
Napoli IT 540,385 Automobile Club D'Italia 2017 http://www.aci.it/laci/studi-e-ricerche/dati-e-statistiche/autoritratto/autoritratto-2017.html
Puerto del Rosario ES 19,856
Ministerio del interior,
Dirección General de Tráfico
2019 https://sedeapl.dgt.gob.es/WEB_IEST_CONSULTA/
Cadiz ES 44,695
Ministerio del interior,
Dirección General de Tráfico
2019 https://sedeapl.dgt.gob.es/WEB_IEST_CONSULTA/
Schiedam NL 30,167
Centraal Bureau voor de
Statistiek
2019
https://statline.cbs.nl/Statweb/publication/?DM=SLNL&PA=37209hvv&D1=0-17&D2=80,241,489,500&D3=15-
19&HDR=T&STB=G1,G2&VW=T
Zeebrugge BE 57,049 Statbel 2018 https://statbel.fgov.be/fr/themes/mobilite/circulation/parc-de-vehicules#figures
Helsinski FI 243,000 Helsingin kaupunki 2017
https://www.hel.fi/helsinki/fi/kartat-ja-liikenne/kadut-ja-liikennesuunnittelu/tutkimus-ja-
tilastot/moottoriajoneuvoliikenteen-maarat/
Monfacolne IT 15,451 Automobile Club D'Italia 2017 http://www.aci.it/laci/studi-e-ricerche/dati-e-statistiche/autoritratto/autoritratto-2017.html
Messina IT 144,546 Automobile Club D'Italia 2017 http://www.aci.it/laci/studi-e-ricerche/dati-e-statistiche/autoritratto/autoritratto-2017.html
Split HR 89,473
Ministarstvo Unutarnjih
Poslova
2019
Gravesend UK
Reykjavik IS 79,887 Icelandic Transport Authority 2019
28. 2
a study by
Ballstaviken SE 356,236 SCB 2019 https://www.scb.se/TK1001-en
Valencia ES 359,938
Ministerio del interior,
Dirección General de Tráfico
2019 https://sedeapl.dgt.gob.es/WEB_IEST_CONSULTA
Malaga ES 269,170
Ministerio del interior,
Dirección General de Tráfico
2019 https://sedeapl.dgt.gob.es/WEB_IEST_CONSULTA
Cannes FR 36,556
Ministère de la Transition
écologique et solidaire
2019
Ajaccio FR 35,722
Ministère de la Transition
écologique et solidaire
2019
Loudden SE 356,236 SCB 2019 https://www.scb.se/TK1001-en
Gibraltar GI 17,000 Government of Gibraltar 2016 https://www.gibraltar.gov.gi/new/sites/default/files/press/2016/Press%20Releases/641-2016.pdf
Santa Cruz de la
Palma
ES 7,213
Ministerio del interior,
Dirección General de Tráfico
2019 https://sedeapl.dgt.gob.es/WEB_IEST_CONSULTA
Dubrovnik - Gruz
Passenger port
HR 27,173
Ministarstvo Unutarnjih
Poslova
2019
Kirkwall UK 35,873
UK Government, Department
for Transport
2018 https://www.dft.gov.uk/traffic-counts/area/regions/Scotland/local-authorities/Orkney+Islands
Mariehamn FI 7,856 Tilastokeskus 2018
http://pxnet2.stat.fi/PXWeb/pxweb/en/StatFin/StatFin__lii__mkan/statfin_mkan_pxt_11ic.px/table/tableVie
wLayout1/?loadedQueryId=eeb4b53e-e0ca-463c-bed5-59de16a3b709&timeType=from&timeValue=2014
Olbia IT 42,130 Automobile Club D'Italia 2017 http://www.aci.it/laci/studi-e-ricerche/dati-e-statistiche/autoritratto/autoritratto-2017.html
Antwerp BE 204,641 Statbel 2018 https://statbel.fgov.be/fr/themes/mobilite/circulation/parc-de-vehicules#figures
29. References
i
Sofiev, M. et al., (2018) Cleaner fuels for ships provide public health benefits with climate tradeoffs, Nature
Communications, volume 9, Article number: 406 (2018)
ii
Winnes, H., Fridell, E., Yaramenka, K., Nelissen, D., Faber, J., and Ahdour, S. (2016) NOx controls for
shipping in EU Seas, IVL and CE Delft, available at:
https://www.transportenvironment.org/sites/te/files/publications/2016_Consultant_report_shipping_NO
x_abatement.pdf
iii
Third IMO GHG Study, IMO, 2014; Olmer, N., Comer, B., Roy, B., Mao, X., and Rutherford, D. (2017).
Greenhouse gas emissions from global shipping, 2013-2015. The International Council on Clean
Transportation.
iv
Cofala, J., Amann, M., Borken-Kleefeld, J., Gomez Sanabria, A., Heyes, C, Kiesewetter, G., Sander, R.,
Schöpp, W., et al. (2018), The potential for cost-effective air emission reductions from international shipping
through designation of further Emission Control Areas in EU waters with focus on the Mediterranean Sea,
IIASA.
v
NABU measures air pollution from cruise ships, available at: https://en.nabu.de/issues/traffic/air-
testing.html
vi
Abbasov, F. Gilliam, L., & Earl, T. (2018), Cost analysis of Arctic HFO ban for Cruise shipping, Transport &
Environment. Available at: https://www.transportenvironment.org/publications/cost-analysis-arctic-hfo-
ban-cruise-shipping
vii
Olmer, N., Comer, B., Roy, B., Mao, X., and Rutherford, D. (2017). Greenhouse gas emissions from global
shipping, 2013-2015. The International Council on Clean Transportation.
viii
Cruise Ship Caught Exceeding Sulfur Limit at Gieranger, The Maritime Executive, 16-May-2019, available
at: https://maritime-executive.com/article/cruise-ship-caught-exceeding-sulfur-limit-at-gieranger; France
hits American cruise ship captain with €100,000 fine for air pollution, The Local, 26-November-2019,
available at: https://www.thelocal.fr/20181126/france-fines-american-cruise-ship-captain-100000-euros-
for-pollution
ix
Greenhouse gas emission statistics - emission inventories, Eurostat, 2018, https://bit.ly/2FmyJnx
x
Winnes, H., Fridell, E., Yaramenka, K., Nelissen, D., Faber, J., and Ahdour, S. (2016) NOx controls for
shipping in EU Seas, IVL and CE Delft, available at:
https://www.transportenvironment.org/sites/te/files/publications/2016_Consultant_report_shipping_NO
x_abatement.pdf