Más contenido relacionado La actualidad más candente (20) Similar a Annex 3 01 (20) 1. Measure 06
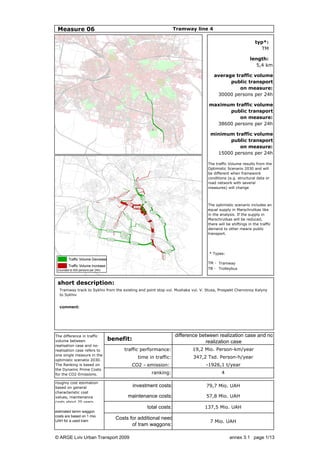
typ*:
TM
length:
5,4 km
average traffic volume
public transport
on measure:
30000 persons per 24h
maximum traffic volume
public transport
on measure:
38600 persons per 24h
minimum traffic volume
public transport
on measure:
15000 persons per 24h
The traffic Volume results from the
Optimistic Scenario 2030 and will
be different when framework
conditions (e.g. structural data or
road network with several
measures) will change
The optimistic scenario includes an
equal supply in Marschrutkas like
in the analysis. If the supply in
Marschrutkas will be reduced,
there will be shiftings in the traffic
demand to other means public
transport.
TM - Tramway
TB -
short description:
comment:
benefit:
traffic performance:
time in traffic:
CO2 - emission:
ranking:
roughly cost estimation
based on general
characteristic cost
values, maintenance
costs about 20 years
estimated tamm waggon
costs are based on 1 mio.
UAH for a used tram
investment costs:
Trolleybus
difference between realization case and no
realization case
19,2 Mio. Person-km/year
347,2 Tsd. Person-h/year
-1926,1 t/year
79,7 Mio. UAH
57,8 Mio. UAH
The difference in traffic
volume between
realisation case and no-realisation
case refers to
one single measure in the
optimistic scenatio 2030.
The Ranking is based on
the Dynamic Prime Costs
for the CO2-Emissions. 4
maintenance costs:
total costs:
Costs for additional need
of tram waggons:
Tramway line 4
* Types:
Tramway track to Sykhiv from the existing end point stop vul. Mushaka vul. V. Stusa, Prospekt Chervonoy Kalyny
to Sykhiv
137,5 Mio. UAH
7 Mio. UAH
© ARGE Lviv Urban Transport 2009 annex 3.1 page 1/13
2. Measure 07
typ*:
TM
length:
3.2 km
average traffic volume
public transport
on measure:
15600 persons per 24h
maximum traffic volume
public transport
on measure:
15600 persons per 24h
minimum traffic volume
public transport
on measure:
15600 persons per 24h
The traffic Volume results from the
Optimistic Scenario 2030 and will
be different when framework
conditions (e.g. structural data or
road network with several
measures) will change
The optimistic scenario includes an
equal supply in Marschrutkas like
in the analysis. If the supply in
Marschrutkas will be reduced,
there will be shiftings in the traffic
demand to other means public
transport.
TM - Tramway
TB -
short description:
comment:
benefit:
traffic performance:
time in traffic:
CO2 - emission:
ranking:
Tramway line 4
* Types:
Tramway track: Sykhiv, vul. Vernadskoho, Bus terminal vul. Stryyska
Trolleybus
difference between realization case and no
realization case
8.8 Mio. Person-km/year
73.8 Tsd. Person-h/year
-889.4 t/year
6
49.1 Mio. UAH
21.6 Mio. UAH
70.7 Mio. UAH
The difference in traffic
volume between
realisation case and no-realisation
case refers to
one single measure in the
optimistic scenatio 2030.
The Ranking is based on
the Dynamic Prime Costs
for the CO2-Emissions.
roughly cost estimation
based on general
investment costs: characteristic cost
values, maintenance
maintenance costs:
costs about 20 years
total costs:
estimated tamm waggon
costs are based on 1 mio.
UAH for a used tram Costs for additional need
of tram waggons: 3 Mio. UAH
© ARGE Lviv Urban Transport 2009 annex 3.1 page 2/13
3. Measure 08
typ*:
TM
length:
3.2 km
Tramway line 3 and line 5
average traffic volume
public transport
on measure:
12700 persons per 24h
(Line 3)
9800 persons per 24h
(Line 5)
maximum traffic volume
public transport
on measure:
12700 persons per 24h
(Line 3)
9800 persons per 24h
(Line 5)
minimum traffic volume
public transport
on measure:
12700 persons per 24h
(Line 3)
9800 persons per 24h
(Line 5)
* Types:
TM - Tramway
TB -
short description:
comment:
The optimistic scenario includes an equal supply in Marschrutkas like in the analysis. If the supply in Marschrutkas will be reduced,
there will be shiftings in the traffic demand to other means public transport.
benefit:
traffic performance:
time in traffic:
CO2 - emission:
ranking:
difference between realization case and no
realization case
33.3 Mio. Person-km/year
589.8 Tsd. Person-h/year
-3342.9 t/year
3
The difference in traffic
volume between
realisation case and no-realisation
case refers to
one single measure in the
optimistic scenatio 2030.
The Ranking is based on
the Dynamic Prime Costs
for the CO2-Emissions.
Trolleybus
Tramway track: Bus Terminal vul. Stryyska to vul. Knyahyny Olhy
The traffic Volume results from the
Optimistic Scenario 2030 and will
be different when framework
conditions (e.g. structural data or
road network with several
measures) will change
40.8 Mio. UAH
18.4 Mio. UAH
roughly cost estimation
based on general
characteristic cost
values, maintenance
costs about 20 years
maintenance costs:
total costs:
estimated tamm waggon
costs are based on 1 mio.
UAH for a used tram Costs for additional need
of tram waggons:
59.2 Mio. UAH
6 Mio. UAH
investment costs:
© ARGE Lviv Urban Transport 2009 annex 3.1 page 3/13
4. Measure 09
typ*:
TM
length:
6.9 km 6.3 km
(Line 2) (Line 6)
average traffic volume
public transport
on measure:
15900 persons per 24h
(Line 2)
9200 persons per 24h
(Line 6)
maximum traffic volume
public transport
on measure:
27300 persons per 24h
(Line 2)
9600 persons per 24h
(Line 6)
minimum traffic volume
public transport
on measure:
2900 persons per 24h
(Line 2)
400 persons per 24h
(Line 6)
TM - Tramway
TB -
comment:
The optimistic scenario includes an equal supply in Marschrutkas like in the analysis. If the supply in Marschrutkas will be reduced,
there will be shiftings in the traffic demand to other means public transport.
benefit:
traffic performance:
time in traffic:
CO2 - emission:
ranking:
difference between realization case and no
realization case
16.7 Mio. Person-km/year
The difference in traffic
volume between
realisation case and no-realisation
case refers to
one single measure in the
optimistic scenatio 2030.
The Ranking is based on
the Dynamic Prime Costs
for the CO2-Emissions.
Tramway line 2 and line 6
* Types:
Reconstruction of Tramway Line 2 and 6 (EBRD)
The traffic Volume results from the
Optimistic Scenario 2030 and will
be different when framework
conditions (e.g. structural data or
road network with several
measures) will change
short description:
Trolleybus
251.2 Tsd. Person-h/year
-1675.2 t/year
11
120.0 Mio. UAH
141.3 Mio. UAH
261.3 Mio. UAH
12 Mio. UAH
roughly cost estimation
based on general
investment costs: characteristic cost
values, maintenance
maintenance costs:
costs about 20 years
total costs:
estimated tamm waggon
costs are based on 1 mio.
UAH for a used tram Costs for additional need
of tram waggons:
© ARGE Lviv Urban Transport 2009 annex 3.1 page 4/13
5. Measure 10
typ*:
TM
length:
6.9 km
Trolleybus line 12
average traffic volume
public transport
on measure:
15900 persons per 24h
maximum traffic volume
public transport
on measure:
27300 persons per 24h
minimum traffic volume
public transport
on measure:
2900 persons per 24h
The traffic Volume results from the
Optimistic Scenario 2030 and will
be different when framework
conditions (e.g. structural data or
road network with several
measures) will change
The optimistic scenario includes an
equal supply in Marschrutkas like
in the analysis. If the supply in
Marschrutkas will be reduced,
there will be shiftings in the traffic
demand to other means public
transport.
* Types:
TM - Tramway
TB -
comment:
benefit:
traffic performance:
time in traffic:
CO2 - emission:
ranking:
maintenance costs:
10
49.1 Mio. UAH
10.2 Mio. UAH
3.5 Mio. UAH
Extension Line 12: to vul. Shevchenka
105.7 Tsd. Person-h/year
-453.7 t/year
Costs for additional
need of trolleybusses:
difference between realization case and no
realization case
short description:
Trolleybus
The difference in traffic
volume between
realisation case and no-realisation
case refers to
one single measure in the
optimistic scenatio 2030.
The Ranking is based on
the Dynamic Prime Costs
for the CO2-Emissions.
roughly cost estimation investment costs:
based on general
characteristic cost
values, maintenance
costs about 20 years
total costs:
estimated tamm waggon
costs are based on 3,5 mio.
UAH for a new trolleybus
investment costs include costs for
construction of new road
4.5 Mio. Person-km/year
59.3 Mio. UAH
© ARGE Lviv Urban Transport 2009 annex 3.1 page 5/13
6. Measure 11
typ*:
TM
length:
3.4 km
Trolleybus line 24
average traffic volume
public transport
on measure:
5900 persons per 24h
maximum traffic volume
public transport
on measure:
6900 persons per 24h
minimum traffic volume
public transport
on measure:
5200 persons per 24h
The traffic Volume results from the
Optimistic Scenario 2030 and will
be different when framework
conditions (e.g. structural data or
road network with several
measures) will change
The optimistic scenario includes an
equal supply in Marschrutkas like
in the analysis. If the supply in
Marschrutkas will be reduced,
there will be shiftings in the traffic
demand to other means public
transport.
TM - Tramway
TB -
Extension of Line 24: Prospekt Chervonoy Kalyny, vul. Khutorivka to vul. Stryyska
comment:
The line 24 in the model goes alternately to vul. Stryyska (measure 11) and to vul. Karbyshev (measure 14). In case the measure 11
will not be realised it was assumed that all trips go to vul. Karbyshev (measure 14).
benefit:
traffic performance:
time in traffic:
CO2 - emission:
ranking:
maintenance costs: 23.1 Mio. UAH
The difference in traffic
volume between
realisation case and no-realisation
case refers to
one single measure in the
optimistic scenatio 2030.
The Ranking is based on
the Dynamic Prime Costs
for the CO2-Emissions.
difference between realization case and no
realization case
4.7 Mio. Person-km/year
99.4 Tsd. Person-h/year
-470.4 t/year
roughly cost estimation
based on general
characteristic cost
values, maintenance
costs about 20 years
total costs:
estimated tamm waggon
costs are based on 3,5 mio.
UAH for a new trolleybus Costs for additional
need of trolleybusses:
short description:
Trolleybus
35.8 Mio. UAH
10.5 Mio. UAH
investment costs does not include
costs for construction of new road
* Types:
12.7 Mio. UAH
investment costs:
5
© ARGE Lviv Urban Transport 2009 annex 3.1 page 6/13
7. Measure 12
typ*:
TM
length:
4.3 km
Trolleybus line 24
average traffic volume
public transport
on measure:
2700 persons per 24h
maximum traffic volume
public transport
on measure:
5100 persons per 24h
minimum traffic volume
public transport
on measure:
1000 persons per 24h
The traffic Volume results from the
Optimistic Scenario 2030 and will
be different when framework
conditions (e.g. structural data or
road network with several
measures) will change
The optimistic scenario includes an
equal supply in Marschrutkas like
in the analysis. If the supply in
Marschrutkas will be reduced,
there will be shiftings in the traffic
demand to other means public
transport.
* Types:
TM - Tramway
TB -
Extension Line 11/24: vul. Dzh. Vashyngtona, vul. Pasichna, Mayorivka, vul. Medovoy Pechery
comment:
The measure 12 was added to the model as independent sub-line of the trolleybus line 24 from vul. Zelena to the end ofvul. Medovoy
Pechery
benefit:
traffic performance:
time in traffic:
CO2 - emission:
ranking:
maintenance costs:
19.2 Tsd. Person-h/year
-105.4 t/year
13
16.0 Mio. UAH
29.2 Mio. UAH
17.5 Mio. UAH
Costs for additional
need of trolleybusses:
difference between realization case and no
realization case
short description:
Trolleybus
The difference in traffic
volume between
realisation case and no-realisation
case refers to
one single measure in the
optimistic scenatio 2030.
The Ranking is based on
the Dynamic Prime Costs
for the CO2-Emissions.
roughly cost estimation investment costs:
based on general
characteristic cost
values, maintenance
costs about 20 years
total costs:
estimated tamm waggon
costs are based on 3,5 mio.
UAH for a new trolleybus
investment costs does not include
costs for construction of new road
1.0 Mio. Person-km/year
45.3 Mio. UAH
© ARGE Lviv Urban Transport 2009 annex 3.1 page 7/13
8. Measure 13
typ*:
TM
length:
1.0 km
Trolleybus line 24
average traffic volume
public transport
on measure:
7200 persons per 24h
maximum traffic volume
public transport
on measure:
8700 persons per 24h
minimum traffic volume
public transport
on measure:
5400 persons per 24h
The traffic Volume results from the
Optimistic Scenario 2030 and will
be different when framework
conditions (e.g. structural data or
road network with several
measures) will change
The optimistic scenario includes an
equal supply in Marschrutkas like
in the analysis. If the supply in
Marschrutkas will be reduced,
there will be shiftings in the traffic
demand to other means public
transport.
* Types:
TM - Tramway
TB -
Extension of Trolley bus line 24 for 1 Kilometer from cinema in Zone „Santa Barbara“
comment:
benefit:
traffic performance:
time in traffic:
CO2 - emission:
ranking:
8
4.5 Mio. UAH
maintenance costs: 8.2 Mio. UAH
The difference in traffic
volume between
realisation case and no-realisation
case refers to
one single measure in the
optimistic scenatio 2030.
The Ranking is based on
the Dynamic Prime Costs
for the CO2-Emissions.
difference between realization case and no
realization case
1.2 Mio. Person-km/year
18.6 Tsd. Person-h/year
-120.2 t/year
investment costs does not include
costs for construction of new road
estimated tamm waggon
costs are based on 3,5 mio.
UAH for a new trolleybus Costs for additional
need of trolleybusses:
short description:
Trolleybus
12.6 Mio. UAH
3.5 Mio. UAH
The measure 13 was added to model as blind line within the trolleybus line.
roughly cost estimation investment costs:
based on general
characteristic cost
values, maintenance
costs about 20 years
total costs:
© ARGE Lviv Urban Transport 2009 annex 3.1 page 8/13
9. Measure 14
typ*:
TM
length:
3.3 km
Trolleybus line 24
average traffic volume
public transport
on measure:
1400 persons per 24h
maximum traffic volume
public transport
on measure:
2000 persons per 24h
minimum traffic volume
public transport
on measure:
1000 persons per 24h
The traffic Volume results from the
Optimistic Scenario 2030 and will
be different when framework
conditions (e.g. structural data or
road network with several
measures) will change
The optimistic scenario includes an
equal supply in Marschrutkas like
in the analysis. If the supply in
Marschrutkas will be reduced,
there will be shiftings in the traffic
demand to other means public
transport.
* Types:
TM - Tramway
TB -
Construction of 2.5 km new Trolley bus line from cinema to the existing line on vul. Karbyshev over Sykhiv Bridge
for passenger transport from Sykhiv - Novyy Lviv, connection of two highly passenger frequented parts of the city
Sykhiv und Novyy Lviv and shortest Line from Sykhiv in the city centre (Pl. Petrushevycha) over vul. Stusa
comment:
The trolleybus line 1 is out of order because of the realised tram line 4. The line 24 in the model goes from the cinema alternately to
vul. Stryyska (measure 11) and to vul. Karbyshev (measure 14).In case the measure 14 is not realised, it was assumed that all trips go
tovul. Stryyska (measure 11).
benefit:
traffic performance:
time in traffic:
CO2 - emission:
ranking:
9
12.3 Mio. UAH
maintenance costs: 22.4 Mio. UAH
The difference in traffic
volume between
realisation case and no-realisation
case refers to
one single measure in the
optimistic scenatio 2030.
The Ranking is based on
the Dynamic Prime Costs
for the CO2-Emissions.
difference between realization case and no
realization case
3.2 Mio. Person-km/year
73.4 Tsd. Person-h/year
-320.5 t/year
investment costs does not include
costs for construction of new road
estimated tamm waggon
costs are based on 3,5 mio.
UAH for a new trolleybus Costs for additional
need of trolleybusses:
short description:
Trolleybus
34.7 Mio. UAH
10.5 Mio. UAH
roughly cost estimation investment costs:
based on general
characteristic cost
values, maintenance
costs about 20 years
total costs:
© ARGE Lviv Urban Transport 2009 annex 3.1 page 9/13
10. Measure 16
typ*:
TM
length:
5.0 km
Trolleybus line 2
average traffic volume
public transport
on measure:
3100 persons per 24h
maximum traffic volume
public transport
on measure:
7200 persons per 24h
minimum traffic volume
public transport
on measure:
900 persons per 24h
The traffic Volume results from the
Optimistic Scenario 2030 and will
be different when framework
conditions (e.g. structural data or
road network with several
measures) will change
The optimistic scenario includes an
equal supply in Marschrutkas like
in the analysis. If the supply in
Marschrutkas will be reduced,
there will be shiftings in the traffic
demand to other means public
transport.
* Types:
TM - Tramway
TB -
Extension Line 2 to vul. Trolleybusna (circle line in 2 directions: Kulparkivska-Naukova-Trolleybusna, V.Velykoho) -
chance to create new lines to connect Sykhiv)
comment:
benefit:
traffic performance:
time in traffic:
CO2 - emission:
ranking:
maintenance costs:
101.6 Tsd. Person-h/year
-434.8 t/year
7
14.9 Mio. UAH
27.2 Mio. UAH
7.0 Mio. UAH
Costs for additional
need of trolleybusses:
difference between realization case and no
realization case
short description:
Trolleybus
The difference in traffic
volume between
realisation case and no-realisation
case refers to
one single measure in the
optimistic scenatio 2030.
The Ranking is based on
the Dynamic Prime Costs
for the CO2-Emissions.
roughly cost estimation investment costs:
based on general
investment costs does not include
characteristic cost
costs for construction of new road
values, maintenance
costs about 20 years
total costs:
estimated tamm waggon
costs are based on 3,5 mio.
UAH for a new trolleybus
4.3 Mio. Person-km/year
42.1 Mio. UAH
© ARGE Lviv Urban Transport 2009 annex 3.1 page 10/13
11. Measure 17
typ*:
TM
length:
1.2 km (8.2 km)
shifting (whole line)
Trolleybus line 3
average traffic volume
public transport
on measure:
11000 persons per 24h
maximum traffic volume
public transport
on measure:
18000 persons per 24h
minimum traffic volume
public transport
on measure:
3100 persons per 24h
The traffic Volume results from the
Optimistic Scenario 2030 and will
be different when framework
conditions (e.g. structural data or
road network with several
measures) will change
The optimistic scenario includes an
equal supply in Marschrutkas like
in the analysis. If the supply in
Marschrutkas will be reduced,
there will be shiftings in the traffic
demand to other means public
transport.
* Types:
TM - Tramway
TB -
Shifting of one line (one direction) from vul. Stryyska to vul. Trolleybusna over vul. V. Velykoho - increase of
traffic flows by the double line on vul. Rubachka
comment:
Measure 17 includes a doubling on the vul. Rubachka by doubling of the time table of the whole line. The benefits and costs were
calculated together with measure 18.
benefit:
traffic performance:
time in traffic:
CO2 - emission:
ranking:
1
4.5 Mio. UAH
maintenance costs: 8.2 Mio. UAH
The difference in traffic
volume between
realisation case and no-realisation
case refers to
one single measure in the
optimistic scenatio 2030.
The Ranking is based on
the Dynamic Prime Costs
for the CO2-Emissions.
difference between realization case and no
realization case
7.2 Mio. Person-km/year
169.7 Tsd. Person-h/year
-725.5 t/year
investment costs does not include
costs for construction of new road
estimated tamm waggon
costs are based on 3,5 mio.
UAH for a new trolleybus Costs for additional
need of trolleybusses:
short description:
Trolleybus
12.6 Mio. UAH
14.0 Mio. UAH
roughly cost estimation investment costs:
based on general
characteristic cost
values, maintenance
costs about 20 years
total costs:
© ARGE Lviv Urban Transport 2009 annex 3.1 page 11/13
12. Measure 18
typ*:
TM
length:
1.2 km (8.2 km)
shifting (whole line)
Trolleybus line 3
average traffic volume
public transport
on measure:
11000 persons per 24h
maximum traffic volume
public transport
on measure:
18000 persons per 24h
minimum traffic volume
public transport
on measure:
3100 persons per 24h
The traffic Volume results from the
Optimistic Scenario 2030 and will
be different when framework
conditions (e.g. structural data or
road network with several
measures) will change
The optimistic scenario includes an
equal supply in Marschrutkas like
in the analysis. If the supply in
Marschrutkas will be reduced,
there will be shiftings in the traffic
demand to other means public
transport.
* Types:
TM - Tramway
TB -
Analogue (Measure 17) shifting of the Line in one direction from vul. Trolleybusna to vul. Stryyska over Naukova
(right turn is no bar for the other traffic) Line can be an important Trolley bus connection to Bus Terminal and
Stadion
comment:
Measure 18 includes a doubling on the vul. Rubachka by doubling of the time table of the whole line. The benefits and costs were
calculated together with measure 17.
benefit:
traffic performance:
time in traffic:
CO2 - emission:
ranking:
maintenance costs:
169.7 Tsd. Person-h/year
-725.5 t/year
2
4.5 Mio. UAH
8.2 Mio. UAH
0.0 Mio. UAH
Costs for additional
need of trolleybusses:
difference between realization case and no
realization case
short description:
Trolleybus
The difference in traffic
volume between
realisation case and no-realisation
case refers to
one single measure in the
optimistic scenatio 2030.
The Ranking is based on
the Dynamic Prime Costs
for the CO2-Emissions.
roughly cost estimation investment costs:
based on general
investment costs does not include
characteristic cost
costs for construction of new road
values, maintenance
costs about 20 years
total costs:
estimated tamm waggon
costs are based on 3,5 mio.
UAH for a new trolleybus
7.2 Mio. Person-km/year
12.6 Mio. UAH
© ARGE Lviv Urban Transport 2009 annex 3.1 page 12/13
13. Measure 19
typ*:
TM
length:
2.0 km
Trolleybus line 5
average traffic volume
public transport
on measure:
1900 persons per 24h
maximum traffic volume
public transport
on measure:
1900 persons per 24h
minimum traffic volume
public transport
on measure:
1900 persons per 24h
The traffic Volume results from the
Optimistic Scenario 2030 and will
be different when framework
conditions (e.g. structural data or
road network with several
measures) will change
The optimistic scenario includes an
equal supply in Marschrutkas like
in the analysis. If the supply in
Marschrutkas will be reduced,
there will be shiftings in the traffic
demand to other means public
transport.
* Types:
TM - Tramway
TB -
comment:
benefit:
traffic performance:
time in traffic:
CO2 - emission:
ranking:
12
59.5 Mio. UAH
maintenance costs: 13.6 Mio. UAH
The difference in traffic
volume between
realisation case and no-realisation
case refers to
one single measure in the
optimistic scenatio 2030.
The Ranking is based on
the Dynamic Prime Costs
for the CO2-Emissions.
difference between realization case and no
realization case
2.8 Mio. Person-km/year
59.9 Tsd. Person-h/year
-279.5 t/year
investment costs include costs for
construction of new road
estimated tamm waggon
costs are based on 3,5 mio.
UAH for a new trolleybus Costs for additional
need of trolleybusses:
short description:
Trolleybus
73.1 Mio. UAH
3.5 Mio. UAH
Future close connection of the Bus terminal to the Stadion by trolley bus
roughly cost estimation investment costs:
based on general
characteristic cost
values, maintenance
costs about 20 years
total costs:
© ARGE Lviv Urban Transport 2009 annex 3.1 page 13/13
14. Measure 01
typ*:
A
lanes:
length:
tunnel/bridges:
average traffic
volume on measure:
maximum traffic
volume on measure:
minimum traffic
volume on measure:
A -
B - Main road network with
moving traffic
C - Road network of general
relevance with regulated
traffic
D - Road and traffic organisation
comment:
investment costs:
* Types:
Motorway/ highway
CO2 - emission:
ranking:
roughly cost estimation
based on general
characteristic cost
values, maintenance
costs about 20 years
maintenance costs:
total costs:
difference between realization case and no
realization case
costs:
Completion of the road circle
The traffic Volume results from the
Optimistic Scenario 2030 and will
be different when framework
conditions (e.g. structural data or
road network with several
measures) will change
traffic performance:
short description:
The difference in traffic
volume between
realisation case and no-realisation
case refers to
one single measure in the
optimistic scenatio 2030.
The Ranking is based on
the Dynamic Prime Costs
for the CO2-Emissions.
benefit:
time in traffic:
Completion of the road circle
national measure not included in urban budget
© ARGE Lviv Urban Transport 2009 annex 3.2 page 1/26
15. Measure 02
typ*:
A
lanes:
length:
tunnel/bridges:
average traffic
volume on measure:
maximum traffic
volume on measure:
minimum traffic
volume on measure:
A -
B - Main road network with
moving traffic
C - Road network of general
relevance with regulated
traffic
D - Road and traffic organisation
Extension of the entire road circle to four lanes
comment:
Extension of the entire road circle to four lanes
* Types:
national measure not included in urban budget
The difference in traffic
volume between
realisation case and no-realisation
case refers to
one single measure in the
optimistic scenatio 2030.
The Ranking is based on
the Dynamic Prime Costs
for the CO2-Emissions.
benefit:
time in traffic:
The traffic Volume results from the
Optimistic Scenario 2030 and will
be different when framework
conditions (e.g. structural data or
road network with several
measures) will change
short description:
Motorway/ highway
traffic performance:
difference between realization case and no
realization case
costs: investment costs:
roughly cost estimation
based on general
characteristic cost
values, maintenance
costs about 20 years
CO2 - emission:
ranking:
maintenance costs:
total costs:
© ARGE Lviv Urban Transport 2009 annex 3.2 page 2/26
16. Measure 03
typ*:
B
lanes:
4
length:
10 km
tunnel/bridges:
yes / yes
average traffic
volume on measure:
42300 Veh/24h
maximum traffic
volume on measure:
58500 Veh/24h
minimum traffic
volume on measure:
32300 Veh/24h
A -
B - Main road network with
moving traffic
C - Road network of general
relevance with regulated
traffic
D - Road and traffic organisation
Construction of a main road near city centre, which will carry all traffic flows through the city centre in north-south
direction (cp. current master plan)
Course: from exit to Kiev, vul. Khmelnytskoho, over railway line Lviv-Krasne, over High Castle, with tunneled
sections, new section alongside Shevchenkivskyy Gay, crossing vul. Lychakivska, Zelena, Stusa, along vul. Ivana
Franka and vul. Stryyska to the exit to Stryy
comment:
The traffic Volume results from the
Optimistic Scenario 2030 and will
be different when framework
conditions (e.g. structural data or
road network with several
measures) will change
short description:
* Types:
Motorway/ highway
difference between realization case and no
realization case
-21 Mio. Veh-km/year
-2038 Tsd. Veh-h/year
- 5871 t/year
6
1399 Mio. UAH
234.8 Mio. UAH
roughly cost estimation
based on general
characteristic cost
values, maintenance
costs about 20 years
investment costs:
maintenance costs:
total costs:
Chorda - Axis
1633.8 Mio. UAH
The difference in traffic
volume between
realisation case and no-realisation
case refers to
one single measure in the
optimistic scenatio 2030.
The Ranking is based on
the Dynamic Prime Costs
for the CO2-Emissions.
benefit:
traffic performance:
time in traffic:
CO2 - emission:
ranking:
costs:
© ARGE Lviv Urban Transport 2009 annex 3.2 page 3/26
17. Measure 04
typ*:
B
lanes:
4
length:
20 km
tunnel/bridges:
no / yes
average traffic
Small inner circle
volume on measure:
36600 Veh/24h
maximum traffic
volume on measure:
58300 Veh/24h
minimum traffic
volume on measure:
16700 Veh/24h
* Types:
A -
B - Main road network with
moving traffic
C - Road network of general
relevance with regulated
traffic
D - Road and traffic organisation
comment:
roughly cost estimation
based on general
characteristic cost
values, maintenance
costs about 20 years
maintenance costs:
difference between realization case and no
realization case
- 8221 t/year
4
1167.5 Mio. UAH
total costs: 1395.7 Mio. UAH
The difference in traffic
volume between
realisation case and no-realisation
case refers to
one single measure in the
optimistic scenatio 2030.
The Ranking is based on
the Dynamic Prime Costs
for the CO2-Emissions.
benefit:
traffic performance:
time in traffic:
CO2 - emission:
-27 Mio. Veh-km/year
-4828 Tsd. Veh-h/year
228.2 Mio. UAH
ranking:
costs: investment costs:
The traffic Volume results from the
Optimistic Scenario 2030 and will
be different when framework
conditions (e.g. structural data or
road network with several
measures) will change
short description:
Motorway/ highway
The inner circle is planned to proceed from the industrial centre Sykhiv, alongside the railway line Lviv-Khodoriv
at vul. Luhanska, crossing the railway line Lviv-Mostyska-frontier, vul. Syayvo, Levandivska, Yeroshenka,
Lypynskoho, through the northern industrial zone, crossing the railway line Lviv-Krasne, vul. Bogdanivska
(planned) through the south-eastern industrial zone, vul. Pasychna, to the industrial centre Sykhiv
© ARGE Lviv Urban Transport 2009 annex 3.2 page 4/26
18. Measure 05
typ*:
B
lanes:
4
length:
27 km
tunnel/bridges:
no / yes
average traffic
Peripheral semi-circle
volume on measure:
33100 Veh/24h
maximum traffic
volume on measure:
46500 Veh/24h
minimum traffic
volume on measure:
18400 Veh/24h
The traffic Volume results from the
Optimistic Scenario 2030 and will
be different when framework
conditions (e.g. structural data or
road network with several
measures) will change
A -
B - Main road network with
moving traffic
C - Road network of general
relevance with regulated
traffic
D - Road and traffic organisation
Route: from Sykhiv industrial zone, vul Khutorivka, Naukova, Ryashivska, crossing of vul. Horodotska and railway
lines Lviv-Stryy and Lviv-Mostyska-frontier, new main road Roksolyani (planned), near residential area Ryasne,
through forest park zone, to the northern residential area Zboyska and to the exit towards Kiev
comment:
difference between realization case and no
realization case
-79 Mio. Veh-km/year
3
total costs: 1631.7 Mio. UAH
The difference in traffic
volume between
realisation case and no-realisation
case refers to
one single measure in the
optimistic scenatio 2030.
The Ranking is based on
the Dynamic Prime Costs
for the CO2-Emissions.
benefit:
traffic performance:
time in traffic:
CO2 - emission:
ranking:
costs: investment costs:
-6985 Tsd. Veh-h/year
short description:
* Types:
Motorway/ highway
259.2 Mio. UAH
roughly cost estimation
based on general
characteristic cost
values, maintenance
costs about 20 years
maintenance costs:
- 20553 t/year
1372.5 Mio. UAH
© ARGE Lviv Urban Transport 2009 annex 3.2 page 5/26
19. Measure 06
typ*:
B
lanes:
4
length:
8.5 km
tunnel/bridges:
no / no
average traffic
volume on measure:
24500 Veh/24h
maximum traffic
volume on measure:
32800 Veh/24h
minimum traffic
volume on measure:
11100 Veh/24h
The traffic Volume results from the
Optimistic Scenario 2030 and will
be different when framework
conditions (e.g. structural data or
road network with several
measures) will change
A -
B - Main road network with
moving traffic
C - Road network of general
relevance with regulated
traffic
D - Road and traffic organisation
Exit Ternopil - from band main road alongside Glynyanskyy Trakt to the circle bypass
comment:
difference between realization case and no
realization case
-3 Mio. Veh-km/year
-425 Tsd. Veh-h/year
9
67 Mio. UAH
roughly cost estimation
based on general
characteristic cost
values, maintenance
costs about 20 years
maintenance costs:
Exit Ternopil
- 666 t/year
335 Mio. UAH
short description:
* Types:
Motorway/ highway
total costs: 422 Mio. UAH
The difference in traffic
volume between
realisation case and no-realisation
case refers to
one single measure in the
optimistic scenatio 2030.
The Ranking is based on
the Dynamic Prime Costs
for the CO2-Emissions.
benefit:
traffic performance:
time in traffic:
CO2 - emission:
ranking:
costs: investment costs:
© ARGE Lviv Urban Transport 2009 annex 3.2 page 6/26
20. Measure 07
typ*:
B
lanes:
4
length:
6.5 km
tunnel/bridges:
no / no
average traffic
Exit Ivano-Frankivsk
volume on measure:
25500 Veh/24h
maximum traffic
volume on measure:
49100 Veh/24h
minimum traffic
volume on measure:
20400 Veh/24h
The traffic Volume results from the
Optimistic Scenario 2030 and will
be different when framework
conditions (e.g. structural data or
road network with several
measures) will change
A -
B - Main road network with
moving traffic
C - Road network of general
relevance with regulated
traffic
D - Road and traffic organisation
Exit Ivano-Frankivsk - from the circle connection and peripheral semi-circle to Sykhiv alongside vul. Zelena to
the circle bypass
comment:
difference between realization case and no
realization case
-0.8 Mio. Veh-km/year
14
total costs: 354.1 Mio. UAH
The difference in traffic
volume between
realisation case and no-realisation
case refers to
one single measure in the
optimistic scenatio 2030.
The Ranking is based on
the Dynamic Prime Costs
for the CO2-Emissions.
benefit:
traffic performance:
time in traffic:
CO2 - emission:
ranking:
costs: investment costs:
-203 Tsd. Veh-h/year
short description:
* Types:
Motorway/ highway
59.1 Mio. UAH
roughly cost estimation
based on general
characteristic cost
values, maintenance
costs about 20 years
maintenance costs:
-112 t/year
295 Mio. UAH
© ARGE Lviv Urban Transport 2009 annex 3.2 page 7/26
21. Measure 08
typ*:
B
lanes:
4
length:
6.8 km
tunnel/bridges:
no / yes
average traffic
volume on measure:
15800 Veh/24h
maximum traffic
volume on measure:
18900 Veh/24h
minimum traffic
volume on measure:
6800 Veh/24h
A -
B - Main road network with
moving traffic
C - Road network of general
relevance with regulated
traffic
D - Road and traffic organisation
comment:
difference between realization case and no
realization case
0.3 Mio. Veh-km/year
-274 Tsd. Veh-h/year
22
54.9 Mio. UAH
roughly cost estimation
based on general
characteristic cost
values, maintenance
costs about 20 years
maintenance costs:
Exit Zhovkva
27 t/year
289 Mio. UAH
Exit Zhovkva - from band main road to the northern bypass motorway
The traffic Volume results from the
Optimistic Scenario 2030 and will
be different when framework
conditions (e.g. structural data or
road network with several
measures) will change
short description:
* Types:
Motorway/ highway
total costs: 343.9 Mio. UAH
The difference in traffic
volume between
realisation case and no-realisation
case refers to
one single measure in the
optimistic scenatio 2030.
The Ranking is based on
the Dynamic Prime Costs
for the CO2-Emissions.
benefit:
traffic performance:
time in traffic:
CO2 - emission:
ranking:
costs: investment costs:
© ARGE Lviv Urban Transport 2009 annex 3.2 page 8/26
22. Measure 09
typ*:
B
lanes:
4
length:
6.2 km
tunnel/bridges:
no / yes
average traffic
volume on measure:
28700 Veh/24h
maximum traffic
volume on measure:
57600 Veh/24h
minimum traffic
volume on measure:
5200 Veh/24h
A -
B - Main road network with
moving traffic
C - Road network of general
relevance with regulated
traffic
D - Road and traffic organisation
comment:
difference between realization case and no
realization case
-1 Mio. Veh-km/year
11
total costs: 340.1 Mio. UAH
The difference in traffic
volume between
realisation case and no-realisation
case refers to
one single measure in the
optimistic scenatio 2030.
The Ranking is based on
the Dynamic Prime Costs
for the CO2-Emissions.
benefit:
traffic performance:
time in traffic:
CO2 - emission:
ranking:
costs: investment costs:
-203 Tsd. Veh-h/year
Exit Horodok - from inner circle at vul. Horodotska to Konopnyca
The traffic Volume results from the
Optimistic Scenario 2030 and will
be different when framework
conditions (e.g. structural data or
road network with several
measures) will change
short description:
* Types:
Motorway/ highway
58.1 Mio. UAH
roughly cost estimation
based on general
characteristic cost
values, maintenance
costs about 20 years
maintenance costs:
Exit Horodok
-376 t/year
282 Mio. UAH
© ARGE Lviv Urban Transport 2009 annex 3.2 page 9/26
23. Measure 10
typ*:
B
lanes:
4
length:
8.8 km
tunnel/bridges:
no / yes
average traffic
volume on measure:
20400 Veh/24h
maximum traffic
volume on measure:
34300 Veh/24h
minimum traffic
volume on measure:
12300 Veh/24h
The traffic Volume results from the
Optimistic Scenario 2030 and will
be different when framework
conditions (e.g. structural data or
road network with several
measures) will change
A -
B - Main road network with
moving traffic
C - Road network of general
relevance with regulated
traffic
D - Road and traffic organisation
Exit Yavoriv - from inner circle at vul. Shevchenka through Ryasne industrial zone to the peripheral circle
comment:
difference between realization case and no
realization case
-1 Mio. Veh-km/year
-231 Tsd. Veh-h/year
13
86.1 Mio. UAH
roughly cost estimation
based on general
characteristic cost
values, maintenance
costs about 20 years
maintenance costs:
Exit Yavoriv
-235 t/year
408 Mio. UAH
short description:
* Types:
Motorway/ highway
total costs: 494.1 Mio. UAH
The difference in traffic
volume between
realisation case and no-realisation
case refers to
one single measure in the
optimistic scenatio 2030.
The Ranking is based on
the Dynamic Prime Costs
for the CO2-Emissions.
benefit:
traffic performance:
time in traffic:
CO2 - emission:
ranking:
costs: investment costs:
© ARGE Lviv Urban Transport 2009 annex 3.2 page 10/26
24. Measure 11
typ*:
B
lanes:
4
length:
4 km
Road construction Vernadskyy prospekt
tunnel/bridges:
no / yes
average traffic
volume on measure:
12300 Veh/24h
maximum traffic
volume on measure:
14700 Veh/24h
minimum traffic
volume on measure:
6500 Veh/24h
A -
B - Main road network with
moving traffic
C - Road network of general
relevance with regulated
traffic
D - Road and traffic organisation
comment:
difference between realization case and no
realization case
-0.4 Mio. Veh-km/year
15
total costs: 249.4 Mio. UAH
The difference in traffic
volume between
realisation case and no-realisation
case refers to
one single measure in the
optimistic scenatio 2030.
The Ranking is based on
the Dynamic Prime Costs
for the CO2-Emissions.
benefit:
traffic performance:
time in traffic:
CO2 - emission:
ranking:
costs: investment costs:
-204 Tsd. Veh-h/year
Road construction Vernadskyy Prospekt, 3.2 km length
The traffic Volume results from the
Optimistic Scenario 2030 and will
be different when framework
conditions (e.g. structural data or
road network with several
measures) will change
short description:
* Types:
Motorway/ highway
39.9 Mio. UAH
roughly cost estimation
based on general
characteristic cost
values, maintenance
costs about 20 years
maintenance costs:
-45 t/year
209.5 Mio. UAH
© ARGE Lviv Urban Transport 2009 annex 3.2 page 11/26
25. Measure 12
typ*:
B
lanes:
length:
tunnel/bridges:
no / no
total traffic volume
heading to the node:
84500 Veh/24h
cross section
with highest traffic
volume at the node
45200 Veh/24h
cross section
with least traffic
volume at the node
39000 Veh/24h
A -
Motorway/ highway
B - Main road network with
moving traffic
C - Road network of general
relevance with regulated
traffic
D - Road and traffic organisation
Complete extension of crossing vul. Stryyska - vul. Khutorivska, Naukova (multilevel solution)
comment:
The traffic Volume results from the
Optimistic Scenario 2030 and will
be different when framework
conditions (e.g. structural data or
road network with several
measures) will change
difference between realization case and no
realization case
0.1 Mio. Veh-km/year
-124 Tsd. Veh-h/year
17
3.6 Mio. UAH
roughly cost estimation
based on general
characteristic cost
values, maintenance
costs about 20 years
benefit:
traffic performance:
time in traffic:
CO2 - emission:
maintenance costs:
15 Mio. UAH
short description:
total costs: 18.6 Mio. UAH
The difference in traffic
volume between
realisation case and no-realisation
case refers to
one single measure in the
optimistic scenatio 2030.
The Ranking is based on
the Dynamic Prime Costs
for the CO2-Emissions.
Crossing vul. Stryyska - vul. Khutorivska, Naukova
* Types:
65 t/year
ranking:
costs: investment costs:
© ARGE Lviv Urban Transport 2009 annex 3.2 page 12/26
26. Measure 16
New main roads in western residential/ industrial areas
typ*:
C
lanes:
4
length:
4.5 km
tunnel/bridges:
no / yes
average traffic
volume on measure:
9200 Veh/24h
maximum traffic
volume on measure:
9700 Veh/24h
minimum traffic
volume on measure:
8400 Veh/24h
The traffic Volume results from the
Optimistic Scenario 2030 and will
be different when framework
conditions (e.g. structural data or
road network with several
measures) will change
A -
B - Main road network with
moving traffic
C - Road network of general
relevance with regulated
traffic
D - Road and traffic organisation
New main roads in the western residential and industrial areas with connection to the motorway Lviv-Mostyska-frontier
comment:
difference between realization case and no
realization case
-4 Mio. Veh-km/year
-394 Tsd. Veh-h/year
5
40.1 Mio. UAH
roughly cost estimation
based on general
characteristic cost
values, maintenance
costs about 20 years
maintenance costs:
-964 t/year
199.5 Mio. UAH
short description:
* Types:
Motorway/ highway
total costs: 239.6Mio. UAH
The difference in traffic
volume between
realisation case and no-realisation
case refers to
one single measure in the
optimistic scenatio 2030.
The Ranking is based on
the Dynamic Prime Costs
for the CO2-Emissions.
benefit:
traffic performance:
time in traffic:
CO2 - emission:
ranking:
costs: investment costs:
© ARGE Lviv Urban Transport 2009 annex 3.2 page 13/26
27. Measure 17
typ*:
C
lanes:
4
length:
2.8 km
Connection of city with southern districts
tunnel/bridges:
no / no
average traffic
volume on measure:
16500 Veh/24h
maximum traffic
volume on measure:
18900 Veh/24h
minimum traffic
volume on measure:
15700 Veh/24h
The traffic Volume results from the
Optimistic Scenario 2030 and will
be different when framework
conditions (e.g. structural data or
road network with several
measures) will change
A -
B - Main road network with
moving traffic
C - Road network of general
relevance with regulated
traffic
D - Road and traffic organisation
Vul. Kulparkivska and Knyahyni Olhy - connection of central urban districts with southern residential areas and
Sokilnyky
comment:
difference between realization case and no
realization case
-0.6 Mio. Veh-km/year
10
total costs: 142.9Mio. UAH
The difference in traffic
volume between
realisation case and no-realisation
case refers to
one single measure in the
optimistic scenatio 2030.
The Ranking is based on
the Dynamic Prime Costs
for the CO2-Emissions.
benefit:
traffic performance:
time in traffic:
CO2 - emission:
ranking:
costs: investment costs:
-260 Tsd. Veh-h/year
short description:
* Types:
Motorway/ highway
23.4 Mio. UAH
roughly cost estimation
based on general
characteristic cost
values, maintenance
costs about 20 years
maintenance costs:
-178 t/year
119.5 Mio. UAH
© ARGE Lviv Urban Transport 2009 annex 3.2 page 14/26
28. Measure 18
Traffic improvement between vul. Zelena/ vul. Sakharova
typ*:
D
lanes:
2
length:
3.8 km
tunnel/bridges:
no / no
average traffic
volume on measure:
11000 Veh/24h
maximum traffic
volume on measure:
20800 Veh/24h
minimum traffic
volume on measure:
2000 Veh/24h
The traffic Volume results from the
Optimistic Scenario 2030 and will
be different when framework
conditions (e.g. structural data or
road network with several
measures) will change
A -
B - Main road network with
moving traffic
C - Road network of general
relevance with regulated
traffic
D - Road and traffic organisation
Traffic improvement on the section between vul. Zelena and vul. Sakharova (vul. Franko, Rustaveli, Voloska,
Sarytskykh, Vitovskoho, Kopernyka).
Planning of one-way-streets at vul. Franko, Rustaveli, Voloska, Zarytskykh, Saksahanskoho
Planning of reconstruction of vul. Voloska - road extension near Stryyskyy-market to 3 lanes with organisation of
one-way-streets and extension of vul. Rustaveli near vul. Archypenka
Reorganisation of bus- and electric public transport
comment:
difference between realization case and no
realization case
2 Mio. Veh-km/year
28 Tsd. Veh-h/year
16
33.5 Mio. UAH
roughly cost estimation
based on general
characteristic cost
values, maintenance
costs about 20 years
maintenance costs:
622 t/year
131.3 Mio. UAH
short description:
* Types:
Motorway/ highway
total costs: 164.8 Mio. UAH
The difference in traffic
volume between
realisation case and no-realisation
case refers to
one single measure in the
optimistic scenatio 2030.
The Ranking is based on
the Dynamic Prime Costs
for the CO2-Emissions.
benefit:
traffic performance:
time in traffic:
CO2 - emission:
ranking:
costs: investment costs:
© ARGE Lviv Urban Transport 2009 annex 3.2 page 15/26
29. Measure 19
Improvement of the traffic scheme at Pl. Petrushevycha
typ*:
D
lanes:
2
length:
1.1 km
tunnel/bridges:
no / no
average traffic
volume on measure:
6000 Veh/24h
maximum traffic
volume on measure:
15200 Veh/24h
minimum traffic
volume on measure:
1500 Veh/24h
The traffic Volume results from the
Optimistic Scenario 2030 and will
be different when framework
conditions (e.g. structural data or
road network with several
measures) will change
A -
B - Main road network with
moving traffic
C - Road network of general
relevance with regulated
traffic
D - Road and traffic organisation
Improvement of the traffic scheme at Pl. Petrushevycha, at vul. Saksahanskoho and Zelena incl. establishment of
one-way-streets and access from vul. Saksahanskoho to Pl. Petrushevycha via vul. Kostomarova (extended by
partial demolition of buildings) and traffic light controlled crossings - relief of crossing vul. Zelena – vul. Franka
The basic traffic scheme provides the establishment of a one-way-street and the effective utilisation of vul.
Sarytskykh: Planning of an access to this street from vul. Vitovskoho (left corner of the park, in front of park
entrance). inspection of th variant of continuation of vul. Sarytskykh towards vul. Bohuna (perspective 2012-
2015).
comment:
difference between realization case and no
realization case
0.3 Mio. Veh-km/year
20
total costs: 56.1 Mio. UAH
The difference in traffic
volume between
realisation case and no-realisation
case refers to
one single measure in the
optimistic scenatio 2030.
The Ranking is based on
the Dynamic Prime Costs
for the CO2-Emissions.
benefit:
traffic performance:
time in traffic:
CO2 - emission:
ranking:
costs: investment costs:
-19 Tsd. Veh-h/year
short description:
* Types:
Motorway/ highway
12.5 Mio. UAH
roughly cost estimation
based on general
characteristic cost
values, maintenance
costs about 20 years
maintenance costs:
97 t/year
43.6 Mio. UAH
© ARGE Lviv Urban Transport 2009 annex 3.2 page 16/26
30. Measure 20
Reconstruktion of sections in north-eastern city centre
typ*:
D
lanes:
2
length:
2 km
tunnel/bridges:
no / no
average traffic
volume on measure:
8000 Veh/24h
maximum traffic
volume on measure:
12200 Veh/24h
minimum traffic
volume on measure:
3100 Veh/24h
The traffic Volume results from the
Optimistic Scenario 2030 and will
be different when framework
conditions (e.g. structural data or
road network with several
measures) will change
A -
B - Main road network with
moving traffic
C - Road network of general
relevance with regulated
traffic
D - Road and traffic organisation
Reconstruction of several sections to improve traffic flows in the north-eastern city centre: alongside Lychakivska,
Halytskyy place, Prospekt Svoboda and vul. Pidvalna by planned intensified utilisation of the streets Sankovetska,
Lysenka, Vynnychenka
required reconstruction of parts of vul. Lysenka (executed), opening of a small part of vul. Vynnychenka (approx.
70 m), to secure the left-hand exit to vul. Kryvonosa and the ascension to vul. Honta by circumnavigating
perspectively: partial reconstruction of Vynnychenka, to redirect traffic flows from vul. Franka to Honta through
Vynnychenka which will relieve Pidvalna. demolition of a salient quoin at vul. Honta to increase the passage
capacity
comment:
difference between realization case and no
realization case
0.2 Mio. Veh-km/year
27 Tsd. Veh-h/year
21
19.1 Mio. UAH
roughly cost estimation
based on general
characteristic cost
values, maintenance
costs about 20 years
maintenance costs:
74 t/year
72 Mio. UAH
short description:
* Types:
Motorway/ highway
total costs: 91.1 Mio. UAH
The difference in traffic
volume between
realisation case and no-realisation
case refers to
one single measure in the
optimistic scenatio 2030.
The Ranking is based on
the Dynamic Prime Costs
for the CO2-Emissions.
benefit:
traffic performance:
time in traffic:
CO2 - emission:
ranking:
costs: investment costs:
© ARGE Lviv Urban Transport 2009 annex 3.2 page 17/26
31. Measure 21
3-lane road connection of Kharkivska with Musorskoho
typ*:
D
lanes:
3
length:
1.4 km
tunnel/bridges:
no / yes
average traffic
volume on measure:
13300 Veh/24h
maximum traffic
volume on measure:
16000 Veh/24h
minimum traffic
volume on measure:
10900 Veh/24h
The traffic Volume results from the
Optimistic Scenario 2030 and will
be different when framework
conditions (e.g. structural data or
road network with several
measures) will change
A -
B - Main road network with
moving traffic
C - Road network of general
relevance with regulated
traffic
D - Road and traffic organisation
Radical relief of the city centre from transit traffic on Lychakivska, Mayorivka, Zelena by construction of a 3-lane
road as a connection of Kharkivska with Musorskoho near Znesinnya park - redirection of traffic flows on vul.
Korduba and tunnel entrance to Promyslova and Khmelnytskoho, through Saklynskykh to Kovelska and Polova to
the northern district of the city
comment:
The 3-laned road construction measure goes via Chorda - Axis (measure 3), for measure 21 only the drives to the Chorda - Axis were
modelled as measure.
difference between realization case and no
realization case
0.8 Mio. Veh-km/year
19
total costs: 74.9 Mio. UAH
The difference in traffic
volume between
realisation case and no-realisation
case refers to
one single measure in the
optimistic scenatio 2030.
The Ranking is based on
the Dynamic Prime Costs
for the CO2-Emissions.
benefit:
traffic performance:
time in traffic:
CO2 - emission:
ranking:
costs: investment costs:
22 Tsd. Veh-h/year
short description:
* Types:
Motorway/ highway
14.2 Mio. UAH
roughly cost estimation
based on general
characteristic cost
values, maintenance
costs about 20 years
maintenance costs:
154 t/year
60.7 Mio. UAH
© ARGE Lviv Urban Transport 2009 annex 3.2 page 18/26
32. Measure 22
Abscission of the corner on crossing Pstrak/ Kleparivska
typ*:
D
lanes:
2
length:
1.2 km
tunnel/bridges:
no / no
average traffic
volume on measure:
8100 Veh/24h
maximum traffic
volume on measure:
10500 Veh/24h
minimum traffic
volume on measure:
6200 Veh/24h
The traffic Volume results from the
Optimistic Scenario 2030 and will
be different when framework
conditions (e.g. structural data or
road network with several
measures) will change
A -
B - Main road network with
moving traffic
C - Road network of general
relevance with regulated
traffic
D - Road and traffic organisation
Abscission of the sharp corner at the green area on the street crossing Pstrak and Kleparivska, to allow for an
active traffic flow from Horodocka via J.Mudroho to Kleparivska and onto north, radical reconstruction of vul. Y
Mudroho (currently under construction)
comment:
difference between realization case and no
realization case
-0.2 Mio. Veh-km/year
3 Tsd. Veh-h/year
12
13.0 Mio. UAH
roughly cost estimation
based on general
characteristic cost
values, maintenance
costs about 20 years
maintenance costs:
-53 t/year
46.2 Mio. UAH
short description:
* Types:
Motorway/ highway
total costs: 59.2 Mio. UAH
The difference in traffic
volume between
realisation case and no-realisation
case refers to
one single measure in the
optimistic scenatio 2030.
The Ranking is based on
the Dynamic Prime Costs
for the CO2-Emissions.
benefit:
traffic performance:
time in traffic:
CO2 - emission:
ranking:
costs: investment costs:
© ARGE Lviv Urban Transport 2009 annex 3.2 page 19/26
33. Measure 23
typ*:
D
lanes:
2
length:
0.5 km
Reconstruction Chuprynky and Melnyka
tunnel/bridges:
no / no
average traffic
volume on measure:
7500 Veh/24h
maximum traffic
volume on measure:
11000 Veh/24h
minimum traffic
volume on measure:
4900 Veh/24h
The traffic Volume results from the
Optimistic Scenario 2030 and will
be different when framework
conditions (e.g. structural data or
road network with several
measures) will change
A -
B - Main road network with
moving traffic
C - Road network of general
relevance with regulated
traffic
D - Road and traffic organisation
Reconstruction vul. Chuprynky (partly executed) and Melnyka to intensify traffic flows from Horbachevskoho to
Antonovycha for relief of vul. Sakharova and Kopernyka as well as the city centre
Traffic from Antonovycha via vul. Bandery, Nevskoho and Ozarkevycha will be directed via Horodotska and
Y.Mudroho-Pstraka-Kleparivska to the north of the city.
comment:
difference between realization case and no
realization case
0.2 Mio. Veh-km/year
18
total costs: 34.0 Mio. UAH
The difference in traffic
volume between
realisation case and no-realisation
case refers to
one single measure in the
optimistic scenatio 2030.
The Ranking is based on
the Dynamic Prime Costs
for the CO2-Emissions.
benefit:
traffic performance:
time in traffic:
CO2 - emission:
ranking:
costs: investment costs:
-133 Tsd. Veh-h/year
short description:
* Types:
Motorway/ highway
8.5 Mio. UAH
roughly cost estimation
based on general
characteristic cost
values, maintenance
costs about 20 years
maintenance costs:
75 t/year
25.5 Mio. UAH
© ARGE Lviv Urban Transport 2009 annex 3.2 page 20/26
34. Measure 24
typ*:
D
lanes:
3
length:
1 km
Enlarging of sections of vul. Kopernyka
tunnel/bridges:
no / no
average traffic
volume on measure:
14200 Veh/24h
maximum traffic
volume on measure:
15700 Veh/24h
minimum traffic
volume on measure:
8700 Veh/24h
The traffic Volume results from the
Optimistic Scenario 2030 and will
be different when framework
conditions (e.g. structural data or
road network with several
measures) will change
A -
B - Main road network with
moving traffic
C - Road network of general
relevance with regulated
traffic
D - Road and traffic organisation
Enlarging of sections of vul. Kopernyka (Kopernyka-Verbytskoho, Kopernyka-Bandery, Kopernyka-Stefanyka) to
improve the situation on vul. Sakharova and Vitovskoho towards city centre at the expense of the pavement
comment:
difference between realization case and no
realization case
-0.5 Mio. Veh-km/year
-46 Tsd. Veh-h/year
8
12.0 Mio. UAH
roughly cost estimation
based on general
characteristic cost
values, maintenance
costs about 20 years
maintenance costs:
-117 t/year
45.5 Mio. UAH
short description:
* Types:
Motorway/ highway
total costs: 57.5 Mio. UAH
The difference in traffic
volume between
realisation case and no-realisation
case refers to
one single measure in the
optimistic scenatio 2030.
The Ranking is based on
the Dynamic Prime Costs
for the CO2-Emissions.
benefit:
traffic performance:
time in traffic:
CO2 - emission:
ranking:
costs: investment costs:
© ARGE Lviv Urban Transport 2009 annex 3.2 page 21/26
35. Measure 25
3-lane-road between vul. Slovatskoho and Lepkoho
typ*:
D
lanes:
3
length:
0.4 km
tunnel/bridges:
no / no
average traffic
volume on measure:
13600 Veh/24h
maximum traffic
volume on measure:
14100 Veh/24h
minimum traffic
volume on measure:
13200 Veh/24h
The traffic Volume results from the
Optimistic Scenario 2030 and will
be different when framework
conditions (e.g. structural data or
road network with several
measures) will change
A -
B - Main road network with
moving traffic
C - Road network of general
relevance with regulated
traffic
D - Road and traffic organisation
Start of the construction of a 3-lane-road between vul. Slovatskoho and Lepkoho through the green area in front of
Franko memorial (relocation of the stopping points at university to secure the construction of the south-western
circle aroung the city centre and the relief of vul. Sichovykh Striltsiv.
comment:
difference between realization case and no
realization case
-0.1 Mio. Veh-km/year
23
total costs: 23.0 Mio. UAH
The difference in traffic
volume between
realisation case and no-realisation
case refers to
one single measure in the
optimistic scenatio 2030.
The Ranking is based on
the Dynamic Prime Costs
for the CO2-Emissions.
benefit:
traffic performance:
time in traffic:
CO2 - emission:
ranking:
costs: investment costs:
-59 Tsd. Veh-h/year
short description:
* Types:
Motorway/ highway
4.8 Mio. UAH
roughly cost estimation
based on general
characteristic cost
values, maintenance
costs about 20 years
maintenance costs:
0.2 t/year
18.2 Mio. UAH
© ARGE Lviv Urban Transport 2009 annex 3.2 page 22/26
36. Measure 26
Finalisation 1st phase connection Zaliznychna/ Lutskoho
typ*:
D
lanes:
2
length:
0.3 km
tunnel/bridges:
no / no
average traffic
volume on measure:
15100 Veh/24h
maximum traffic
volume on measure:
16600 Veh/24h
minimum traffic
volume on measure:
10800 Veh/24h
The traffic Volume results from the
Optimistic Scenario 2030 and will
be different when framework
conditions (e.g. structural data or
road network with several
measures) will change
A -
B - Main road network with
moving traffic
C - Road network of general
relevance with regulated
traffic
D - Road and traffic organisation
Finalisation of 1st phase workings for the connection of Zaliznychna and Lutskoho for traffic flows from district
Pryvokzalnyy to vul.Shevchenka and relief of Horodotska
comment:
difference between realization case and no
realization case
-1 Mio. Veh-km/year
-155 Tsd. Veh-h/year
1
1.4 Mio. UAH
roughly cost estimation
based on general
characteristic cost
values, maintenance
costs about 20 years
maintenance costs:
-222 t/year
7,8 Mio. UAH
short description:
* Types:
Motorway/ highway
total costs: 9.2 Mio. UAH
The difference in traffic
volume between
realisation case and no-realisation
case refers to
one single measure in the
optimistic scenatio 2030.
The Ranking is based on
the Dynamic Prime Costs
for the CO2-Emissions.
benefit:
traffic performance:
time in traffic:
CO2 - emission:
ranking:
costs: investment costs:
© ARGE Lviv Urban Transport 2009 annex 3.2 page 23/26
37. Measure 27
Roundabout at crossing prospekt Chornovola, Pid Dubom
typ*:
D
lanes:
length:
tunnel/bridges:
no / no
total traffic volume
heading to the node:
42300 Veh/24h
cross section
with highest traffic
volume at the node
31000 Veh/24h
cross section
with least traffic
volume at the node
8100 Veh/24h
The traffic Volume results from the
Optimistic Scenario 2030 and will
be different when framework
conditions (e.g. structural data or
road network with several
measures) will change
A -
Motorway/ highway
B - Main road network with
moving traffic
C - Road network of general
relevance with regulated
traffic
D - Road and traffic organisation
Construction of a roundabout instead of crossing Prospekt Chornovola, Pid Dubom and Kulisha
comment:
traffic performance:
time in traffic:
CO2 - emission:
ranking:
benefit:
costs: investment costs:
* Types:
difference between realization case and no
realization case
-1 Mio. Veh-km/year
-81 Tsd. Veh-h/year
-244 t/year
2
1.7 Mio. UAH
roughly cost estimation
based on general
characteristic cost
values, maintenance
costs about 20 years
maintenance costs:
9.9 Mio. UAH
short description:
total costs: 11.6 Mio. UAH
The difference in traffic
volume between
realisation case and no-realisation
case refers to
one single measure in the
optimistic scenatio 2030.
The Ranking is based on
the Dynamic Prime Costs
for the CO2-Emissions.
© ARGE Lviv Urban Transport 2009 annex 3.2 page 24/26
38. Measure 28
Measures for redirection traffic vul. Kulisha/ Chornovola
typ*:
D
lanes:
length:
tunnel/bridges:
average traffic
volume on measure:
12700 Veh/24h
maximum traffic
volume on measure:
16000 Veh/24h
minimum traffic
volume on measure:
10200 Veh/24h
A -
B - Main road network with
moving traffic
C - Road network of general
relevance with regulated
traffic
D - Road and traffic organisation
Organisational measures for the redirection of traffic flows and to activate car and bus traffic through vul.
Dzherelna to relieve vul. Kulisha and Chornovola
comment:
total costs:
traffic organisation only
The difference in traffic
volume between
realisation case and no-realisation
case refers to
one single measure in the
optimistic scenatio 2030.
The Ranking is based on
the Dynamic Prime Costs
for the CO2-Emissions.
benefit:
traffic performance:
time in traffic:
CO2 - emission:
ranking:
costs: investment costs:
The traffic Volume results from the
Optimistic Scenario 2030 and will
be different when framework
conditions (e.g. structural data or
road network with several
measures) will change
short description:
* Types:
Motorway/ highway
roughly cost estimation
based on general
characteristic cost
values, maintenance
costs about 20 years
maintenance costs:
difference between realization case and no
realization case
© ARGE Lviv Urban Transport 2009 annex 3.2 page 25/26
39. Measure 29
typ*:
D
lanes:
4
length:
0.2 km
tunnel/bridges:
yes / no
average traffic
volume on measure:
15000 Veh/24h
maximum traffic
volume on measure:
18000 Veh/24h
minimum traffic
volume on measure:
12700 Veh/24h
The traffic Volume results from the
Optimistic Scenario 2030 and will
be different when framework
conditions (e.g. structural data or
road network with several
measures) will change
A -
B - Main road network with
moving traffic
C - Road network of general
relevance with regulated
traffic
D - Road and traffic organisation
Inspection of possibilities for tunnel construction under the tramway line on vul. Khmelnytskoho for activation of
the street parallel to vul. Zamarstyniyska
comment:
tunnel construction under the tramway line
difference between realization case and no
realization case
-2 Mio. Veh-km/year
-150 Tsd. Veh-h/year
7
17.9 Mio. UAH
roughly cost estimation
based on general
characteristic cost
values, maintenance
costs about 20 years
maintenance costs:
-402 t/year
113 Mio. UAH
short description:
* Types:
Motorway/ highway
total costs: 130.9 Mio. UAH
The difference in traffic
volume between
realisation case and no-realisation
case refers to
one single measure in the
optimistic scenatio 2030.
The Ranking is based on
the Dynamic Prime Costs
for the CO2-Emissions.
benefit:
traffic performance:
time in traffic:
CO2 - emission:
ranking:
costs: investment costs:
© ARGE Lviv Urban Transport 2009 annex 3.2 page 26/26