
Recomendados
Más contenido relacionado
La actualidad más candente
Destacado
Destacado (20)
Similar a S
Similar a S (20)
Más de ireportergr
Más de ireportergr (20)
Último
Último (20)
S
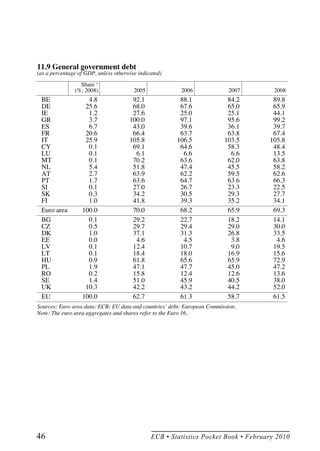
- 1. 11.9 General government debt (as a percentage of GDP, unless otherwise indicated) Share 1) (%; 2008) 2005 2006 2007 2008 BE 4.8 92.1 88.1 84.2 89.8 DE 25.6 68.0 67.6 65.0 65.9 IE 1.2 27.6 25.0 25.1 44.1 GR 3.7 100.0 97.1 95.6 99.2 ES 6.7 43.0 39.6 36.1 39.7 FR 20.6 66.4 63.7 63.8 67.4 IT 25.9 105.8 106.5 103.5 105.8 CY 0.1 69.1 64.6 58.3 48.4 LU 0.1 6.1 6.6 6.6 13.5 MT 0.1 70.2 63.6 62.0 63.8 NL 5.4 51.8 47.4 45.5 58.2 AT 2.7 63.9 62.2 59.5 62.6 PT 1.7 63.6 64.7 63.6 66.3 SI 0.1 27.0 26.7 23.3 22.5 SK 0.3 34.2 30.5 29.3 27.7 FI 1.0 41.8 39.3 35.2 34.1 Euro area 100.0 70.0 68.2 65.9 69.3 BG 0.1 29.2 22.7 18.2 14.1 CZ 0.5 29.7 29.4 29.0 30.0 DK 1.0 37.1 31.3 26.8 33.5 EE 0.0 4.6 4.5 3.8 4.6 LV 0.1 12.4 10.7 9.0 19.5 LT 0.1 18.4 18.0 16.9 15.6 HU 0.9 61.8 65.6 65.9 72.9 PL 1.9 47.1 47.7 45.0 47.2 RO 0.2 15.8 12.4 12.6 13.6 SE 1.4 51.0 45.9 40.5 38.0 UK 10.3 42.2 43.2 44.2 52.0 EU 100.0 62.7 61.3 58.7 61.5 Sources: Euro area data: ECB; EU data and countries’ debt: European Commission. Note: The euro area aggregates and shares refer to the Euro 16. 46 ECB • Statistics Pocket Book • February 2010
- 2. Statistics Pocket Book January February 2008 2010
- 4. The Statistics Pocket Book is updated monthly. As a general rule, the cut-off date for the statistics included in the Pocket Book is the day preceding the Governing Council of the ECB’s first meeting of the month. For this issue, it was 3 February 2010. For specific information on indicators in the tables, please refer to the notes at the back. If you require further information, please contact us at: statistics@ ecb.europa.eu. General information Unless otherwise indicated, all data series including observations for 2009 and beyond relate to the Euro 16 (the euro area including Slovakia) for the whole time series. For interest rates, monetary statistics and the HICP (and, for consistency reasons, the components and counterparts of M3 and the components of the HICP), statistical series refer to the changing composition of the euro area (i.e. they cover the EU Member States that had adopted the euro at the time to which the statistics relate). In such cases, where underlying data are available, absolute and percentage changes for the respective year of entry into the euro area of Greece (2001), Slovenia (2007), Cyprus (2008), Malta (2008) and Slovakia (2009), calculated from bases covering the year prior to the year of entry, use a series in which the impact of these countries’ joining the euro area is taken into account. Historical data referring to the euro area before the entry of Slovakia are available on the ECB’s website at http://www.ecb. europa.eu/stats/services/downloads/html/index.en.html. The statistical series referring to the changing composition of the euro area are based on the euro area composition at the time to which the statistics relate. Thus, data prior to 2001 refer to the Euro 11, i.e. the following 11 EU Member States: Belgium, Germany, Ireland, Spain, France, Italy, Luxembourg, the Netherlands, Austria, Portugal and Finland. Data from 2001 to 2006 refer to the Euro 12, i.e. the Euro 11 plus Greece. Data for 2007 refer to the Euro 13, i.e. the Euro 12 plus Slovenia. Data for 2008 refer to the Euro 15, i.e. the Euro 13 plus Cyprus and Malta, and data as of 2009 refer to the Euro 16, i.e. the Euro 15 plus Slovakia. More information can be found in the “Euro area statistics” section of the ECB’s Monthly Bulletin and the “Statistics” section of the ECB’s website (www.ecb.europa.eu). All rights reserved. © European Central Bank, 2010 Address Kaiserstrasse 29 60311 Frankfurt am Main Germany Postal address Postfach 16 03 19 60066 Frankfurt am Main Germany Telephone +49 69 1344 0 Website http://www.ecb.europa.eu Fax +49 69 1344 6000 ISSN 1725-552X (print) ISSN 1725-5538 (online)
- 5. Contents 1 Overview of major economic areas 1.1 Structural indicators 7 1.2 Main recent economic developments 8 2 Population and the labour market 2.1 Population and the labour market in the euro area 9 3 Macroeconomic indicators 3.1 GDP and expenditure components in the euro area 10 3.2 Value added by economic activity in the euro area 10 3.3 Short-term business indicators in the euro area 11 3.4 Opinion surveys (excluding price-related developments) in the euro area 11 4 External 4.1 Euro area balance of payments 12 4.2 Euro area balance of payments current account 12 4.3 Euro area trade in goods with main partners 13 4.4 Geographical breakdown of the b.o.p: current and capital accounts 14 4.5 Geographical breakdown of the b.o.p: financial account 14 4.6 Monetary presentation of the euro area balance of payments 15 4.7 Euro area international investment position 15 4.8 Geographical breakdown of the international investment position 16 4.9 International reserves of the Eurosystem and the ECB 16 4.10 Exchange rates 17 5 Prices 5.1 HICP in the euro area 18 5.2 The impact of inflation on the purchasing power of money 18 5.3 Industry, construction, residential property, export and import prices 19 5.4 Price-related opinion surveys in the euro area 19 5.5 Other prices and costs in the euro area 20 5.6 Gross domestic product deflators in the euro area 20 6 Euro area accounts 6.1 Euro area 21 6.2 Households 22 6.3 Non-financial corporations 23 6.4 Insurance corporations and pension funds 24 7 Government finance 7.1 Government revenue, expenditure, deficit/surplus and borrowing requirement 25 ECB • Statistics Pocket Book • February 2010 3
- 6. 7.2 Euro area government debt 25 8 Monetary policy 8.1 Key ECB interest rates 26 8.2 Eurosystem monetary policy operations allotted through tenders 27 8.3 Monetary developments in the euro area 28 8.4 Main components of the annual growth rate of M3 28 8.5 Main counterparts of M3 29 8.6 Breakdown of the annual growth rate of M3 by counterpart 29 8.7 Minimum reserve statistics 30 8.8 Structural indicators for the banking system and investment funds of the euro area 30 9 Financial market developments 9.1 Securities issued by euro area residents: outstanding amounts 31 9.2 Debt securities issued by euro area residents: gross issues, redemptions and net issues 31 9.3 Euro-denominated debt securities issued by euro area residents: outstanding amounts and annual growth rates by sector of the issuer 32 9.4 Quoted shares issued by euro area residents: outstanding amounts and annual growth rates by sector of the issuer 32 9.5 Money market interest rates 33 9.6 Implied interest rate on 3-month EURIBOR futures 33 9.7 Euro area yield curves 34 9.8 Spread between swaps and government bond yields 34 9.9 Stock market indices 35 9.10 Euro area sectoral stock market indices 35 9.11 MFI interest rates on deposits 36 9.12 MFI interest rates on loans 36 10 Payment and settlement systems 10.1 Major interbank funds transfer systems in the European Union 37 11 Selected indicators for EU Member States 11.1 HICP 38 11.2 GDP 39 11.3 GDP per capita and gross value added by economic activity in 2008 40 11.4 Unit labour costs 41 11.5 Harmonised competitiveness indicators and real effective exchange rates based on consumer price indices 42 11.6 Population and employment 43 11.7 Unemployment 44 4 ECB • Statistics Pocket Book • February 2010
- 7. 11.8 General government deficit/surplus 45 11.9 General government debt 46 11.10 General government expenditure 47 11.11 Harmonised long-term interest rates for convergence assessment purposes 48 11.12 MFI interest rate indicator for Estonia 48 Notes on the tables 49 Country abbreviations BE Belgium HU Hungary BG Bulgaria MT Malta CZ Czech Republic NL Netherlands DK Denmark AT Austria DE Germany PL Poland EE Estonia PT Portugal IE Ireland RO Romania GR Greece SI Slovenia ES Spain SK Slovakia FR France FI Finland IT Italy SE Sweden CY Cyprus UK United Kingdom LV Latvia JP Japan LT Lithuania US United States LU Luxembourg ECB • Statistics Pocket Book • February 2010 5
- 8. Other abbreviations b.o.p. balance of payments c.i.f. cost, insurance and freight at the importer’s border EONIA euro overnight index average EU European Union EURIBOR euro interbank offered rate f.o.b. free on board at the exporter’s border GDP gross domestic product HGDI households’ gross disposable income HICP Harmonised Index of Consumer Prices i.i.p. international investment position IPF initial period of interest rate fixation LIBOR London interbank offered rate PPP purchasing power parity UMTS Universal Mobile Telecommunications System Conventions used in the tables “-” data do not exist/data are not applicable “.” data are not yet available “...” nil or negligible “billion” 109 “trillion” 1012 (p) provisional s.a. seasonally adjusted 6 ECB • Statistics Pocket Book • February 2010
- 9. 1 Overview of major economic areas 1.1 Structural indicators 2008 Unit Euro EU United Japan area States Population, GDP and labour Total population 1) millions 328.0 498.7 304.8 127.8 Labour force participation rate 2) % 71.4 70.9 75.3 73.8 Age dependency ratio 3) % 49.8 48.6 48.7*) 55.2 GDP (PPP) EUR trillions 9.3 13.0 12.3 3.7 GDP per capita (PPP) EUR thousands 28.2 26.1 40.2 28.8 Labour productivity (PPP) 4) (euro area = 100) 100.0 91.5 132.6 91.2 Labour income share 5) % 66.0 66.8 68.3 72.8*) Value added by economic activity Agriculture, fishing and forestry % of total 1.8 1.8 1.3*) 1.4*) Industry (incl. construction) % of total 26.4 26.5 21.8*) 28.5*) Services (incl. non-market services) % of total 71.8 71.7 76.9*) 70.1*) Saving and investment 6) Gross saving % of GDP 21.1 20.8*) 14.5*) 27.0*) Gross fixed capital formation % of GDP 21.6 21.1 17.8 23.1 Households Gross disposable income (HGDI) per capita (PPP) EUR thousands 18.5 16.8 30.3 18.5 Gross saving % of HHGDI 14.2 11.2 5.3 9.0 Financial assets held 7) % of HHGDI 277.8 . 385.9 459.5 Gross debt outstanding 7) % of HHGDI 94.2 . 127.7 104.3 Non-financial corporations 8) Gross fixed capital formation % of GDP 11.9 12.0 10.2 15.6 Financial assets held 7) % of GDP 157.5 . 122.1 157.2 Gross debt outstanding 7) % of GDP 101.4 . 77.4 95.3 Government Expenditure 9) % of GDP 46.8 46.8 34.8 35.8 Surplus (+) or deficit (-) % of GDP -2.0 -2.3 -6.5 -2.1 Gross debt outstanding 7),10) % of GDP 69.3 61.5 56.3 162.2 External 11) Exports of goods and services % of GDP 22.6 14.8 12.6 18.4 Imports of goods and services % of GDP 22.3 15.8 17.5 18.0 Current account balance % of GDP -1.5 -2.1 -4.9 3.2 Net b.o.p. direct and portfolio investm. % of GDP 1.7 5.2 2.0 -7.9 Net international investment position 7),12)% of GDP -17.7 -16.2 -24.0 50.7 Monetary and financial indicators Credit 7),13) EUR trillions 15.5 20.8 10.8 8.9 Outstanding debt securities 7),14) EUR trillions 13.2 16.3*) 21.4 8.1 Stock market capitalisation 7),15) EUR trillions 3.5 5.2 9.0 2.3 Sources: For the euro area and EU: ECB, Eurostat, national data and ECB calculations; for the United States and Japan: national sources. *) 2007 figures. Note: Unless otherwise indicated, the euro area/EU aggregates for 2008 refer to the Euro 16/EU27 respectively. ECB • Statistics Pocket Book • February 2010 7
- 10. 1.2 Main recent economic developments (annual percentage changes, unless otherwise indicated) Real GDP Con- Broad 3-month 10-year Unit Unemploy- Labour GDP deflator sumer money 2) interbank gov. labour ment product- prices deposit bond costs (% of ivity 1) rate yield 3) labour 4) (% per (% per force; s.a.) annum) annum) Euro area 2008 0.6 2.2 3.3 9.7 4.64 4.36 3.3 7.6 -0.1 2009 . . 0.3 3.3 1.22 4.03 . 9.4 . 2009 Q2 -4.8 1.1 0.2 4.4 1.31 4.19 4.8 9.3 -3.1 Q3 -4.0 0.9 -0.4 2.7 0.87 3.95 3.5 9.6 -2.0 Q4 . . 0.4 0.3 0.72 3.84 . 9.9 . 2009 Nov. - - 0.5 -0.3 0.72 3.83 - 9.9 - Dec. - - 0.9 -0.2 0.71 3.88 - 10.0 - 2010 Jan. - - 1.0 . 0.68 4.10 - . - European Union 2008 0.8 2.6 3.7 - - 4.54 3.4 7.0 -0.2 2009 . . 1.0 - - . . 8.9 . 2009 Q2 -5.0 1.4 0.9 - - 4.25 6.0 8.8 -3.1 Q3 -4.3 1.4 0.4 - - 4.14 4.4 9.2 -2.1 Q4 . . 1.0 - - . . 9.5 . 2009 Oct. - - 0.5 - - 3.98 - 9.4 - Nov. - - 1.0 - - 3.97 - 9.5 - Dec. - - 1.4 - - . - 9.6 - United States 2008 0.4 2.1 3.8 7.1 2.93 3.65 1.0 5.8 1.8 2009 -2.4 1.2 -0.4 7.6 0.69 3.25 . 9.3 . 2009 Q2 -3.8 1.5 -1.2 8.6 0.84 3.31 0.3 9.3 1.9 Q3 -2.6 0.6 -1.6 7.7 0.41 3.50 -1.4 9.6 4.0 Q4 0.1 0.7 1.4 4.9 0.27 3.45 . 10.0 . 2009 Nov. - - 1.8 5.5 0.27 3.39 - 10.0 - Dec. - - 2.7 3.4 0.25 3.58 - 10.0 - 2010 Jan. - - . . 0.25 3.71 - . - Japan 2008 -1.2 -0.8 1.4 2.1 0.93 1.49 1.6 4.0 -0.3 2009 . . -1.4 2.7 0.47 1.35 . . . 2009 Q2 -6.0 -0.6 -1.0 2.6 0.53 1.45 2.5 5.2 - Q3 -4.7 -0.6 -2.2 2.8 0.40 1.35 . 5.5 - Q4 . . -2.0 3.3 0.31 1.32 . . - 2009 Nov. - - -1.9 3.3 0.31 1.36 - 5.2 - Dec. - - -1.7 3.1 0.28 1.27 - . - 2010 Jan. - - . . 0.26 1.34 - . - Sources: Eurostat, OECD, national data and ECB calculations. 8 ECB • Statistics Pocket Book • February 2010
- 11. 2 Population and the labour market 2.1 Population and the labour market in the euro area Population 1) Labour Employment (s.a.) Unemploy- Labour (millions) force ment product- partici- Millions Annual percentage changes (% of ivity 1) pation labour (annual rate 1) Total Employees Self- force; percentage (%) employed s.a.) change) 1971-80 287.0 - 116.0 0.4 0.9 -1.5 4.0 2.9 1981-90 297.3 - 120.1 0.7 0.9 -0.2 9.3 1.6 1991-00 309.1 - 128.6 0.6 0.8 -0.1 9.6 1.5 2001-05 318.6 68.8 139.7 0.9 0.9 0.7 8.6 0.6 2006 324.2 70.6 144.2 1.6 1.8 0.8 8.3 1.4 2007 326.1 71.0 146.7 1.8 1.9 0.8 7.5 1.0 2008 328.0 71.4 147.8 0.7 0.9 -0.3 7.5 -0.1 2008 Q3 . 71.7 147.8 0.5 0.7 -1.0 7.6 -0.1 Q4 . 71.5 147.3 -0.1 0.0 -1.0 8.0 -1.7 2009 Q1 . 71.4 146.2 -1.3 -1.0 -2.5 8.8 -3.8 Q2 . 71.6 145.5 -1.8 -1.7 -2.5 9.3 -3.1 Q3 . 71.6 144.8 -2.0 -1.9 -2.6 9.6 -2.0 Q4 . . . . . . 9.9 . Sources: European Commission (Eurostat and DG-ECFIN), national data and ECB calculations. ECB • Statistics Pocket Book • February 2010 9
- 12. 3 Macroeconomic indicators 3.1 GDP and expenditure components in the euro area (annual percentage changes in volume, unless otherwise indicated; seasonally and partly working day-adjust GDP (market prices) Total Total Private Government Gross fixed Exports 1) Imports 1) (quarter on consumption consumption capital quarter) formation 1971-80 - 3.4 3.7 4.4 2.1 5.9 5.5 1981-90 - 2.4 2.3 2.2 2.4 4.8 4.6 1991-00 - 2.2 2.1 1.7 2.2 6.9 6.4 2001-05 - 1.5 1.5 1.9 1.1 3.9 3.7 2006 - 3.0 2.0 2.1 5.5 8.5 8.5 2007 - 2.8 1.6 2.3 4.8 6.3 5.5 2008 - 0.6 0.4 2.0 -0.4 1.0 1.0 2008 Q4 -1.9 -1.8 -0.7 2.4 -5.8 -6.9 -4.0 2009 Q1 -2.5 -5.0 -1.3 2.5 -11.5 -16.6 -12.8 Q2 -0.1 -4.8 -0.9 2.5 -11.7 -17.2 -14.3 Q3 0.4 -4.0 -1.0 2.5 -11.4 -13.5 -11.8 Level data (EUR billions at current prices) and percentages of GDP 2008 - 9,259.6 5,228.8 1,892.1 2,001.8 3,858.7 3,761.9 2008 - 100.0 56.5 20.4 21.6 - - Source: European Commission (Eurostat and DG-ECFIN). 3.2 Value added by economic activity in the euro area (annual percentage changes in volume, unless otherwise indicated; seasonally and partly working day-adjust Gross value added (basic prices) Total Agriculture, Manu- Con- Trade, repairs, Financial, Public admi- hunting, facturing, struction hotels and real estate, nistration, forestry energy and restaurants, renting education, and fishing mining transport and and business health and activities communicat. activities other services 1996-00 2.7 2.5 2.8 0.3 3.4 3.7 1.6 2001-05 1.5 -0.7 1.1 0.8 1.9 2.1 1.3 2006 3.0 0.0 3.6 2.9 2.8 4.1 1.4 2007 3.0 -0.1 2.4 2.3 3.4 4.3 2.0 2008 0.9 1.7 -0.6 -0.6 0.8 1.7 1.6 2008 Q4 -1.7 2.2 -7.6 -3.4 -2.0 0.2 1.5 2009 Q1 -4.9 0.1 -16.6 -5.9 -5.5 -1.0 1.1 Q2 -4.9 0.1 -17.1 -4.7 -5.1 -1.2 1.3 Q3 -4.1 0.1 -13.6 -4.2 -4.6 -1.3 1.0 Level data (EUR billions at current prices) and percentages of gross value added 2008 8,313.6 146.7 1,660.2 533.3 1,726.8 2,364.6 1,882.1 2008 100.0 1.8 20.0 6.4 20.8 28.4 22.6 Source: Eurostat. 10 ECB • Statistics Pocket Book • February 2010
- 13. 3.3 Short-term business indicators in the euro area (annual percentage changes, unless otherwise indicated) Industrial production Manu- Manu- Retail trade New facturing facturing turnover passenger Total excl. construction Con- Manu- new orders turnover (constant car struction facturing (nominal) (nominal) prices) registrations Period on period (s.a.) 1986-90 3.2 - . - - - - - 1991-95 0.5 - 1.9 0.4 - - - -2.7 1996-00 2.8 - 1.4 3.0 4.9 4.7 1.8 4.5 2001-05 0.7 - 0.7 0.5 1.6 2.0 1.4 -0.6 2007 3.7 - 1.1 4.2 8.7 6.5 1.8 -0.5 2008 -1.7 - -4.4 -1.8 -5.2 1.9 -0.8 -7.0 2009 . - . . . . -1.9 2.8 2009 Q2 -18.6 -1.1 -7.4 -19.5 -30.6 -23.2 -2.0 -0.2 Q3 -14.5 2.3 -9.3 -15.3 -21.4 -18.8 -1.8 9.6 Q4 . . . . . . -1.1 20.3 2009 Oct. -11.0 -0.3 -6.3 -11.5 -14.5 -16.3 -0.4 10.8 Nov. -6.8 1.1 -7.1 -7.0 -0.4 -6.5 -1.5 33.6 Dec. . . . . . . -1.2 19.3 Sources: Eurostat, ACEA (European Automobile Manufacturers’ Association) and ECB calculations. 3.4 Opinion surveys (excluding price-related developments) in the euro area (seasonally adjusted) European Commission Business and Consumer Surveys Purchasing Managers’ (percentage balances 1) ) Surveys (diffusion index 2) ) Economic Manufacturing industry Services Retail Consumer Purchasing Business sentiment confi- trade confi- Managers’ activity indicator Industrial Order Capacity dence confi- dence Index (PMI) for (long-term confi- books utilisa- indicator dence indicator for manu- services average dence tion indicator facturing 4) =100) 3) indicator (%) 5) 1986-90 106.6 -2 -8 83.2 . 0 -9 . . 1991-95 95.2 -12 -27 80.7 . -10 -17 . . 1996-00 105.7 -5 -13 82.2 25 -6 -7 . . 2001-05 98.9 -8 -19 81.4 9 -9 -12 50.2 52.6 2007 109.2 5 5 84.2 20 1 -5 54.3 56.6 2008 93.5 -9 -15 81.8 2 -7 -18 46.5 48.5 2009 80.8 -28 -56 71.1 -16 -15 -25 43.3 46.8 2009 Q2 75.6 -33 -62 69.9 -22 -17 -28 40.0 44.4 Q3 84.1 -26 -58 70.3 -12 -14 -21 47.9 48.8 Q4 91.9 -19 -50 71.7 -4 -12 -17 51.2 53.1 2009 Nov. 91.9 -19 -51 - -4 -11 -17 51.2 53.0 Dec. 94.1 -16 -47 - -3 -10 -16 51.6 53.6 2010 Jan. 95.7 -14 -44 72.4 -1 -5 -16 52.4 52.5 Sources: European Commission Business and Consumer Surveys and Markit. ECB • Statistics Pocket Book • February 2010 11
- 14. 4 External 4.1 Euro area balance of payments (EUR billions, unless otherwise indicated; net transactions) Current and capital Goods and Financial account accounts services In As In As Total Direct Portfolio Financial Other Reserve EUR a% EUR a% invest- invest- deriva- invest- assets billions of GDP billions of GDP ment ment tives ment 2005 23.4 0.3 82.4 1.0 -37.6 -206.0 108.3 -17.3 59.4 18.0 2006 -1.1 0.0 52.3 0.6 -9.1 -160.2 188.7 -0.6 -35.7 -1.3 2007 15.7 0.2 94.3 1.0 -1.2 -72.9 151.3 -64.6 -9.9 -5.1 2008 -133.3 -1.4 29.3 0.3 163.9 -189.0 350.5 -65.7 72.1 -3.9 2008 Q4 -30.5 -1.3 5.2 0.2 41.5 -61.1 152.7 -13.3 -36.1 -0.5 2009 Q1 -36.6 -1.7 -7.3 -0.3 55.8 -58.8 129.9 -5.3 -15.7 5.7 Q2 -19.5 -0.9 20.4 0.9 13.9 -4.3 82.8 18.8 -81.0 -2.4 Q3 -1.2 -0.1 26.0 1.2 14.0 -24.3 83.4 -4.2 -41.3 0.3 2009 July 10.1 - 18.7 - -13.0 0.9 -22.9 6.5 6.2 -3.7 Aug. -5.4 - 2.1 - -6.0 4.8 26.5 -9.3 -28.7 0.8 Sep. -5.9 - 5.2 - 33.0 -29.9 79.8 -1.4 -18.9 3.3 Oct. -3.6 - 10.2 - 4.5 -2.0 17.1 0.9 -11.0 -0.6 Nov. 1.3 - 8.6 - -0.6 -0.3 -14.9 -0.7 14.9 0.3 4.2 Euro area balance of payments current account (EUR billions; seasonally adjusted) Current account Total Goods Services Income Current transfers Credit Debit Net Credit Debit Credit Debit Credit Debit Credit Debit 2003 1,701.4 1,680.1 21.3 1,040.5 939.7 330.4 307.8 249.7 294.1 80.8 138.5 2004 1,869.6 1,810.2 59.4 1,125.3 1,030.2 362.6 331.0 300.0 307.1 81.7 141.9 2005 2,101.7 2,085.4 16.3 1,223.5 1,179.3 404.4 365.9 386.5 386.0 87.3 154.2 2006 2,433.0 2,440.8 -7.8 1,397.9 1,386.4 441.2 399.9 499.2 482.1 94.7 172.5 2007 2,698.6 2,683.3 15.3 1,516.6 1,469.5 491.0 443.0 596.3 593.6 94.7 177.2 2008 2,739.1 2,879.7-140.6 1,575.6 1,585.1 509.2 468.2 565.3 639.1 89.0 187.3 2008 Q4 650.5 693.2 -42.8 368.4 370.2 125.7 118.1 134.7 156.5 21.7 48.4 2009 Q1 581.5 618.9 -37.4 317.6 327.2 119.4 113.7 123.1 132.2 21.5 45.8 Q2 564.1 578.3 -14.1 314.0 305.7 115.0 109.5 111.8 117.8 23.4 45.2 Q3 555.6 559.9 -4.2 319.8 301.3 114.4 105.7 100.0 110.7 21.4 42.2 2009 July 187.9 184.2 3.7 108.7 98.3 38.5 34.8 33.9 37.6 6.8 13.5 Aug. 184.5 186.5 -2.0 105.4 100.7 37.8 34.8 34.1 36.4 7.1 14.6 Sep. 183.2 189.1 -5.9 105.7 102.3 38.1 36.1 32.0 36.7 7.5 14.1 Oct. 188.4 193.0 -4.6 110.9 103.8 38.5 34.8 33.3 35.4 5.6 19.0 Nov. 192.0 191.9 0.1 111.1 104.1 38.3 36.0 32.7 36.0 10.0 15.8 Source: ECB. 12 ECB • Statistics Pocket Book • February 2010
- 15. 4.3 Euro area trade in goods with main partners 1) (EUR billions, unless otherwise indicated; seasonally adjusted) Total Other EU Member States United China 2) Japan Other Other States Asian countries United Others countries Kingdom Exports (f.o.b.) % of total in 2008 100 14.1 20.6 12.0 4.2 2.2 13.4 33.5 2006 1,357.5 217.6 266.6 200.9 53.9 34.6 182.9 400.9 2007 1,507.7 230.9 306.0 195.9 60.6 34.3 201.0 479.0 2008 1,558.6 220.2 320.8 187.5 65.7 33.6 208.7 522.3 2009 Q1 311.4 42.3 61.0 39.9 15.4 7.1 42.7 103.0 Q2 310.4 42.4 58.2 37.7 16.8 7.1 46.5 101.7 Q3 320.9 44.6 62.4 35.8 17.3 7.2 46.8 106.8 2009 Aug. 103.9 14.3 20.4 11.4 5.7 2.2 15.5 34.4 Sep. 108.6 15.3 21.2 11.9 5.8 2.4 15.6 36.4 Oct. 108.5 14.9 21.3 12.6 6.0 2.4 15.5 35.8 Nov. 108.0 . . 12.6 6.2 2.4 15.9 . Imports (c.i.f.) % of total in 2008 100 10.3 16.7 8.6 11.5 3.6 15.0 34.4 2006 1,378.5 167.7 224.9 126.0 145.2 57.5 219.0 438.1 2007 1,491.7 169.5 250.6 131.7 172.7 59.1 223.8 484.3 2008 1,601.8 164.2 267.1 137.7 184.3 56.9 240.1 551.4 2009 Q1 321.7 31.6 55.6 33.1 42.2 11.5 45.2 102.6 Q2 306.9 30.4 53.7 28.4 39.8 10.4 42.7 101.6 Q3 309.6 31.5 57.2 27.0 38.0 10.4 43.9 101.6 2009 Aug. 102.0 10.4 19.0 8.8 12.6 3.4 14.5 33.2 Sep. 104.8 10.7 19.3 9.1 12.8 3.5 14.9 34.5 Oct. 103.8 10.7 19.4 8.9 12.6 3.4 14.6 34.2 Nov. 104.1 . . 9.1 12.5 3.5 14.5 . Trade balance 2006 -21.1 49.9 41.7 74.8 -91.3 -22.9 -36.1 -37.2 2007 16.0 61.4 55.5 64.2 -112.1 -24.8 -22.8 -5.3 2008 -43.1 56.0 53.7 49.7 -118.7 -23.3 -31.5 -29.1 2009 Q1 -10.4 10.7 5.4 6.8 -26.8 -4.4 -2.5 0.4 Q2 3.5 12.0 4.5 9.3 -22.9 -3.3 3.8 0.1 Q3 11.3 13.1 5.2 8.8 -20.8 -3.2 2.9 5.2 2009 Aug. 1.9 3.9 1.4 2.5 -6.9 -1.2 1.0 1.2 Sep. 3.8 4.6 1.9 2.7 -7.0 -1.1 0.7 1.9 Oct. 4.7 4.2 1.8 3.7 -6.5 -1.0 1.0 1.6 Nov. 3.9 . . 3.5 -6.2 -1.1 1.4 . Sources: Eurostat and ECB calculations. ECB • Statistics Pocket Book • February 2010 13
- 16. 4.4 Geographical breakdown of the b.o.p.: current and capital accounts (EUR billions; not seasonally adjusted; cumulated transactions) Total EU27 Japan Switzer- United land States 2008 Q4 to 2009 Q3 UK Credits Current account 2,354.4 833.8 417.2 48.8 171.6 331.1 Goods 1,322.3 441.1 188.7 29.7 84.8 160.1 Services 474.0 158.1 101.7 10.3 47.9 72.7 Income 469.7 170.3 115.1 8.5 32.3 92.7 Current transfers 88.4 64.3 11.7 0.3 6.6 5.6 Capital account 18.2 15.5 1.0 0.0 0.3 0.5 Debits Current account 2,448.9 781.7 361.0 87.6 161.8 349.5 Goods 1,305.5 367.8 142.2 44.3 74.4 127.2 Services 446.4 137.3 85.4 7.7 38.0 96.9 Income 514.7 166.7 121.8 35.1 43.5 119.6 Current transfers 182.4 110.0 11.6 0.5 5.8 5.7 Capital account 11.4 2.3 1.0 0.1 0.5 0.8 Net Current account -94.6 52.0 56.2 -38.8 9.9 -18.5 Goods 16.7 73.3 46.5 -14.6 10.5 32.8 Services 27.6 20.8 16.3 2.6 9.9 -24.2 Income -44.9 3.6 -6.8 -26.6 -11.3 -27.0 Current transfers -93.9 -45.6 0.1 -0.2 0.8 -0.1 Capital account 6.8 13.2 0.0 -0.1 -0.1 -0.3 4.5 Geographical breakdown of the b.o.p.: financial account (EUR billions; not seasonally adjusted; cumulated transactions) Total EU27 Japan Switzer- United land States 2008 Q4 to 2009 Q3 UK Direct investment -148.5 -54.1 -34.5 10.0 21.9 -34.1 Abroad -303.6 -105.7 -78.9 1.3 0.4 -83.4 Equity/reinvested earnings -192.9 -56.8 -43.7 -0.7 -3.7 -42.5 Other capital -110.7 -48.9 -35.2 2.0 4.1 -41.0 In the euro area 155.1 51.5 44.4 8.7 21.5 49.3 Equity/reinvested earnings 177.6 52.6 37.6 2.8 13.0 63.6 Other capital -22.5 -1.0 6.8 5.9 8.5 -14.3 Portfolio investment assets 133.1 -41.0 -7.6 47.0 -8.2 41.3 Equity 46.2 1.4 2.4 5.7 -6.6 13.0 Debt securities 86.9 -42.4 -10.1 41.3 -1.6 28.3 of which: Bonds and notes 58.5 -49.8 -15.4 28.5 -0.3 28.2 Other investment -174.1 220.9 221.7 -68.7 -85.1 -49.9 Assets 722.3 332.5 319.6 9.4 53.8 188.1 of which: MFIs 664.4 326.2 312.9 7.2 50.2 108.3 Liabilities -896.4 -111.6 -97.9 -78.0 -138.9 -238.0 of which: MFIs -787.5 -95.6 -78.1 -79.6 -139.5 -142.6 Source: ECB. 14 ECB • Statistics Pocket Book • February 2010
- 17. 4.6 Monetary presentation of the euro area balance of payments (EUR billions) B.o.p. items mirroring net transactions by MFIs Current Transactions by non-MFIs Finan- Errors Total and cial and capital Direct Portfolio Other deriva- omis- account investment investment investment tives sions balance By By non- Assets Liabil- Assets Liabil- resident resident ities ities units units abroad in the euro area 2006 8.0 -391.6 256.4 -271.8 394.9 -256.5 229.9 -0.3 13.3 -17.6 2007 22.8 -457.6 401.0 -199.2 357.4 -384.8 226.8 -64.8 -14.1 -112.5 2008 -126.2 -325.0 136.6 42.1 219.5 -153.7 66.4 -65.6 -31.7 -237.6 2008 Q3 -31.2 -107.4 72.5 27.2 59.8 -27.3 -8.1 -8.3 -25.3 -48.1 Q4 -28.9 -48.9 -14.7 123.3 28.9 -18.1 34.8 -13.2 -10.4 52.7 2009 Q1 -36.6 -78.8 40.0 38.0 85.6 -11.8 -53.5 -5.3 -19.1 -41.7 Q2 -19.5 -88.0 91.4 -83.7 146.4 62.5 -56.0 18.8 5.5 77.4 Q3 -1.2 -58.7 33.7 -55.8 106.7 24.8 -33.7 -4.2 -12.8 -1.2 2009 July 10.1 -11.7 14.3 -35.7 1.6 13.0 -1.2 6.5 3.0 -0.1 Aug. -5.4 -13.2 19.9 -33.5 52.0 10.9 -13.3 -9.3 11.3 19.4 Sep. -5.9 -33.9 -0.5 13.4 53.1 0.9 -19.2 -1.4 -27.1 -20.4 Oct. -3.6 -28.2 25.6 -15.4 18.6 -28.4 26.7 0.9 -0.8 -4.7 Nov. 1.3 -8.8 8.9 -25.9 1.0 8.5 8.4 -0.7 -0.6 -8.1 4.7 Euro area international investment position (EUR billions, unless otherwise indicated; outstanding amounts at the end of period) Total Total Direct Portfolio Financial Other Reserve as a % investment investment derivatives investment assets of GDP Net international investment position 2007 -1,248.9 -13.9 442.1 -1,924.9 -26.0 -87.2 347.2 2008 -1,636.7 -17.7 527.4 -2,314.6 -36.2 -187.5 374.2 2009 Q2 -1,516.5 -16.7 715.0 -2,403.7 -58.2 -151.0 381.5 Q3 -1,558.2 -17.3 707.3 -2,559.2 -60.5 -76.7 430.9 Outstanding assets 2007 14,276.4 158.6 3,572.8 4,631.6 343.4 5,381.3 347.2 2008 13,937.1 150.4 3,744.4 3,763.9 588.4 5,466.1 374.2 2009 Q2 13,857.6 152.6 4,011.7 3,896.2 484.5 5,083.7 381.5 Q3 13,965.4 155.0 4,063.9 4,052.1 492.2 4,926.4 430.9 Outstanding liabilities 2007 15,525.3 172.5 3,130.7 6,556.5 369.4 5,468.6 - 2008 15,573.8 168.1 3,217.0 6,078.6 624.6 5,653.6 - 2009 Q2 15,374.1 169.3 3,296.7 6,299.9 542.7 5,234.7 - Q3 15,523.7 172.3 3,356.6 6,611.2 552.7 5,003.1 - Source: ECB. ECB • Statistics Pocket Book • February 2010 15
- 18. 4.8 Geographical breakdown of the international investment position (EUR billions; outstanding amounts at end of period) Total EU27 Japan Switzer- United land States 2008 UK Direct investment 527.4 -93.0 -293.9 -9.5 126.2 -68.7 Abroad 3,744.4 1,255.3 865.7 71.7 384.5 734.6 Equity/reinvested earnings 2,946.9 967.5 660.1 53.6 335.3 551.3 Other capital 797.5 287.9 205.7 18.1 49.2 183.4 In the euro area 3,217.0 1,348.3 1,159.7 81.2 258.3 803.3 Equity/reinvested earnings 2,405.5 1,096.8 956.9 68.7 191.1 590.8 Other capital 811.6 251.5 202.8 12.5 67.2 212.5 Portfolio investment assets 3,763.9 1,242.2 895.5 213.4 95.4 1,225.8 Equity 1,162.7 228.7 191.7 84.5 81.3 378.8 Debt securities 2,601.3 1,013.6 703.7 128.8 14.1 847.0 of which: Bonds and notes 2,179.1 849.1 569.1 61.7 12.6 705.4 Other investment -187.5 -91.1 -110.4 -10.2 -131.2 -286.3 Assets 5,466.1 2,419.7 2,020.2 109.4 276.5 852.5 of which: MFIs 3,309.5 1,731.1 1,419.1 79.0 164.5 418.9 Liabilities 5,653.6 2,510.8 2,130.6 119.5 407.7 1,138.8 of which: MFIs 4,234.1 1,907.6 1,664.9 91.2 328.7 751.1 4.9 International reserves of the Eurosystem and the ECB (EUR billions, unless otherwise indicated; outstanding amounts at end of period) Reserve assets Memo items Total Monetary gold SDR Reserve Foreign Other Predetermined holdings position exchange foreign short-term In In fine in the claims currency net EUR troy IMF assets drains on billions ounces foreign (millions) currency Eurosystem 2007 Dec. 347.2 201.0 353.688 4.6 3.6 138.0 44.3 -38.5 2008 Dec. 374.2 217.0 349.190 4.7 7.3 145.1 262.8 -245.7 2009 Oct. 437.9 244.0 347.197 49.5 11.6 132.8 43.4 -36.0 Nov. 464.2 271.7 347.166 49.6 10.3 132.6 39.5 -32.0 Dec. 462.4 266.0 347.163 51.1 9.7 135.5 32.1 -24.5 European Central Bank 2007 Dec. 39.6 10.3 18.092 0.5 0.0 28.9 3.9 -0.7 2008 Dec. 47.4 10.7 17.157 0.3 0.0 36.3 28.1 -25.2 2009 Oct. 45.9 11.3 16.122 0.3 0.0 34.2 4.2 -0.9 Nov. 47.3 12.6 16.122 0.3 0.0 34.3 3.4 -0.4 Dec. 47.8 12.4 16.122 0.3 0.0 35.1 3.4 -0.2 Source: ECB. 16 ECB • Statistics Pocket Book • February 2010
- 19. 4.10 Exchange rates (period averages) Effective exchange rate of the euro Bilateral ECU or euro (1999 Q1 = 100) exchange rates 1) EER-21 EER-41 US dollar Japanese yen Nominal Real Nominal Real 1996-99 99.6 101.5 94.9 99.7 1.1472 135.65 2002 89.7 90.1 94.7 90.5 0.9456 118.06 2003 100.3 101.2 106.6 101.4 1.1312 130.97 2004 104.2 105.1 111.2 105.0 1.2439 134.44 2005 102.7 103.7 109.2 102.5 1.2441 136.85 2006 102.6 103.7 109.3 101.9 1.2556 146.02 2007 106.3 106.8 113.0 104.2 1.3705 161.25 2008 110.5 110.1 118.0 107.1 1.4708 152.45 2009 111.7 110.6 120.6 107.9 1.3948 130.34 2008 Q1 110.7 110.5 117.7 107.4 1.4976 157.80 Q2 113.3 112.9 120.7 109.8 1.5622 163.35 Q3 111.2 110.5 118.3 107.2 1.5050 161.83 Q4 107.0 106.4 115.2 104.0 1.3180 126.71 2009 Q1 109.9 109.2 118.9 107.0 1.3029 122.04 Q2 111.1 110.2 119.8 107.5 1.3632 132.59 Q3 112.1 110.9 121.0 108.2 1.4303 133.82 Q4 113.8 112.2 122.5 108.9 1.4779 132.69 2008 Nov. 105.0 104.5 113.0 102.0 1.2732 123.28 Dec. 110.2 109.7 118.7 107.2 1.3449 122.51 2009 Jan. 109.8 109.2 118.6 106.9 1.3239 119.73 Feb. 108.7 108.0 117.7 106.0 1.2785 118.30 Mar. 111.1 110.3 120.4 108.1 1.3050 127.65 Apr. 110.3 109.5 119.1 106.9 1.3190 130.25 May 110.8 109.9 119.5 107.2 1.3650 131.85 June 112.0 111.1 120.7 108.3 1.4016 135.39 July 111.6 110.5 120.5 107.8 1.4088 133.09 Aug. 111.7 110.6 120.6 107.9 1.4268 135.31 Sep. 112.9 111.6 122.0 108.8 1.4562 133.14 Oct. 114.3 112.9 123.0 109.5 1.4816 133.91 Nov. 114.0 112.5 122.9 109.3 1.4914 132.97 Dec. 113.0 111.3 121.7 108.0 1.4614 131.21 2010 Jan. 110.8 109.1 119.1 105.6 1.4272 130.34 % ch. vs. prev. month 2) 2010 Jan. -1.9 -2.0 -2.1 -2.2 -2.3 -0.7 % ch. vs. prev. year 2) 2010 Jan. 0.9 0.0 0.4 -1.2 7.8 8.9 Sources: ECB and BIS. ECB • Statistics Pocket Book • February 2010 17
- 20. 5 Prices 5.1 HICP in the euro area 1) (annual percentage changes, unless otherwise indicated) HICP Total Goods Services Total Processed Unprocessed Non-energy Energy Total Housing 2) food food industrial goods % of total 100.0 58.6 11.9 7.5 29.7 9.6 41.4 10.1 1991-95 3) 3.2 2.6 3.2 1.9 2.5 2.5 4.6 - 1996-00 1.6 1.4 1.4 1.4 0.8 3.6 2.0 2.6 2001-05 2.2 1.9 2.9 2.7 0.8 3.8 2.6 2.3 2006 2.2 2.3 2.1 2.8 0.6 7.7 2.0 2.5 2007 2.1 1.9 2.8 3.0 1.0 2.6 2.5 2.7 2008 3.3 3.8 6.1 3.5 0.8 10.3 2.6 2.3 2009 0.3 -0.9 1.1 0.2 0.6 -8.1 2.0 2.0 2009 Q2 0.2 -1.2 1.1 0.8 0.7 -10.7 2.2 2.1 Q3 -0.4 -1.9 0.6 -1.2 0.5 -11.9 1.8 2.0 Q4 0.4 -0.4 0.5 -1.5 0.3 -3.2 1.7 1.9 2009 Nov. 0.5 -0.3 0.5 -1.3 0.2 -2.4 1.6 1.9 Dec. 0.9 0.5 0.7 -1.6 0.4 1.8 1.6 1.9 2010 Jan. 4) 1.0 . . . . . . . Month-on-month percentage changes (seasonally adjusted, except energy) 2009 Oct. 0.1 0.0 0.0 0.0 0.0 -0.2 0.2 0.1 Nov. 0.2 0.3 0.2 0.2 0.0 1.4 0.1 0.2 Dec. 0.0 0.0 0.1 -0.1 0.1 -0.5 0.1 0.2 Sources: Eurostat and ECB calculations. 5.2 The impact of inflation on the purchasing power of money (decrease in the purchasing power of money after x years at a given inflation rate; percentages) Inflation rate Year 1.0 2.0 3.0 4.0 5.0 10.0 20.0 1 1.0 2.0 2.9 3.8 4.8 9.1 16.7 2 2.0 3.9 5.7 7.5 9.3 17.4 30.6 3 2.9 5.8 8.5 11.1 13.6 24.9 42.1 4 3.9 7.6 11.2 14.5 17.7 31.7 51.8 5 4.9 9.4 13.7 17.8 21.6 37.9 59.8 6 5.8 11.2 16.3 21.0 25.4 43.6 66.5 7 6.7 12.9 18.7 24.0 28.9 48.7 72.1 8 7.7 14.7 21.1 26.9 32.3 53.3 76.7 9 8.6 16.3 23.4 29.7 35.5 57.6 80.6 10 9.5 18.0 25.6 32.4 38.6 61.4 83.8 15 13.9 25.7 35.8 44.5 51.9 76.1 93.5 20 18.0 32.7 44.6 54.4 62.3 85.1 97.4 Source: ECB calculations. 18 ECB • Statistics Pocket Book • February 2010
- 21. 5.3 Industry, construction, residential property, export and import prices (annual percentage changes) Industrial producer prices excluding Construc- Residential Industrial Industrial construction tion property producer import prices 1) export prices Total Inter- Capital Consumer Energy prices (c.i.f.) 2) mediate goods goods (f.o.b.) 2),3) goods 1986-90 1.1 . 3.1 2.1 -1.5 . 9.4 . . 1991-95 2.3 1.6 1.7 2.2 2.2 4.2 3.8 . . 1996-00 1.0 0.3 0.4 1.1 2.6 2.1 3.6 . . 2001-05 2.0 1.6 0.7 1.5 4.3 3.1 6.5 -0.4 -0.4 2007 2.7 4.6 2.2 2.2 1.2 4.1 4.4 0.4 0.1 2008 6.1 4.0 2.1 3.9 14.1 3.8 1.8 1.6 6.5 2009 -5.1 -5.2 0.4 -2.0 -11.5 . . -2.5 . 2009 Q2 -5.7 -5.7 0.6 -2.0 -13.2 -0.2 -2.4 -2.8 -12.4 Q3 -7.8 -7.4 -0.2 -2.6 -18.0 -1.6 . -4.0 -13.0 Q4 -4.6 -4.9 -0.6 -2.4 -9.7 . - -2.0 . 2009 Oct. -6.6 -6.5 -0.6 -2.8 -14.3 - - -3.6 -7.7 Nov. -4.4 -4.8 -0.6 -2.4 -8.9 - - -2.2 -3.5 Dec. -2.9 -3.4 -0.5 -2.0 -5.6 - - -0.2 . Sources: Eurostat, ECB calculations and national data. 5.4 Price-related opinion surveys in the euro area (seasonally adjusted) European Commission Business and Consumer Purchasing Managers’ Surveys Surveys (percentage balances 1) ) (diffusion index 2) ) Selling price expectations 3) Consumer Input prices Prices charged (for next 3 months) price trends (compared with previous month) over past Manufac- Retail trade Services 12 months Manufac- Services Manufac- Services turing turing turing 1986-90 16 - - 18 - - - - 1991-95 9 - - 29 - - - - 1996-00 2 - - 11 - - - - 2001-05 2 - - 43 55.7 56.8 - 49.7 2007 12 14 9 42 63.7 60.0 54.9 53.5 2008 11 17 7 64 61.4 60.6 54.2 51.9 2009 -10 -7 -7 10 39.8 48.5 42.2 42.5 2009 Q2 -11 -5 -8 14 34.0 47.0 39.8 41.0 Q3 -10 -8 -7 -2 43.8 47.8 43.3 42.6 Q4 -9 -9 -5 -7 52.7 50.0 46.1 44.4 2009 Nov. -9 -9 -6 -7 51.7 50.1 45.9 43.9 Dec. -10 -8 -5 -5 55.1 50.2 47.0 45.6 2010 Jan. -6 -6 -6 -4 57.3 51.6 47.4 45.5 Sources: European Commission Business and Consumer Surveys and Markit. ECB • Statistics Pocket Book • February 2010 19
- 22. 5.5 Other prices and costs in the euro area (annual percentage changes, unless otherwise indicated) Whole economy Negotiated Non-energy commodity prices Oil prices 1) wages Unit Compen- Labour Import- Use- (EUR per labour sation per costs 2) weighted 3) weighted 4) barrel) costs employee (hourly) 1986-90 3.4 5.2 . - . . 15.5 -12.1 1991-95 2.5 4.4 . . . . 14.4 -6.4 1996-00 0.9 2.1 . . . . 18.6 19.0 2001-05 1.7 2.4 2.9 2.4 0.9 0.2 30.9 7.6 2007 1.6 2.5 2.5 2.1 7.5 5.1 52.8 -0.2 2008 3.3 3.2 3.4 3.2 2.1 -1.7 65.9 24.8 2009 . . . . -18.5 -18.1 44.6 -32.3 2009 Q2 4.8 1.6 4.3 2.7 -24.5 -22.5 43.8 -44.2 Q3 3.5 1.4 3.2 2.3 -18.8 -18.9 48.1 -38.0 Q4 . . . . 2.8 2.3 51.2 17.6 2009 Nov. - - - - -0.9 -1.0 52.1 20.8 Dec. - - - - 19.0 19.7 51.6 61.0 2010 Jan. - - - - 27.1 25.6 54.0 57.4 Sources: Eurostat, ECB calculations based on Thomson Financial Datastream, European Commission (Eurostat and DG-ECFIN), OECD and national data. 5.6 Gross domestic product deflators in the euro area (annual percentage changes) GDP (market prices) Total Private Government Gross fixed Exports 1) Imports 1) consumption consumption capital formation 1996-00 1.5 1.7 2.0 1.1 1.0 1.5 2001-05 2.2 2.1 2.5 1.8 0.5 0.3 2006 1.9 2.2 2.0 2.9 2.6 3.8 2007 2.4 2.3 1.7 2.6 1.6 1.4 2008 2.2 2.9 2.8 2.4 2.4 3.7 2008 Q4 2.4 2.0 2.2 1.8 1.3 0.4 2009 Q1 1.8 0.3 2.8 0.6 -2.6 -4.4 Q2 1.1 -0.3 1.6 -0.8 -4.4 -6.8 Q3 0.9 -0.7 2.4 -1.5 -5.4 -8.1 Sources: Eurostat, ECB calculations. 20 ECB • Statistics Pocket Book • February 2010
- 23. 6 Euro area accounts 6.1 Euro area Non-financial accounts Net Net Current Current disposable Gross Consump- Primary Primary national transfers transfers income domestic tion income income income receivable payable product of fixed receivable payable capital Annual percentage changes 1) 2005 4.0 4.6 6.3 5.8 4.5 4.3 4.5 4.3 2006 5.1 5.0 9.1 9.5 4.7 4.8 4.9 4.6 2007 4.9 5.3 9.2 9.5 4.6 4.9 5.0 4.5 2008 Q3 2.9 5.0 5.1 5.6 1.9 4.0 3.9 2.0 Q4 0.7 4.4 0.1 1.0 -0.9 2.1 2.2 -1.0 2009 Q1 -3.0 3.4 -5.8 -5.5 -4.3 2.2 2.1 -4.4 Q2 -4.3 2.5 -9.0 -9.4 -4.7 -0.1 -0.1 -4.8 Q3 -2.8 2.0 -11.8 -12.2 -3.1 0.6 0.6 -3.2 As a percentage of gross domestic product 2007 100.0 14.6 100.8 100.6 85.6 68.5 69.5 84.6 2008 100.0 14.8 103.3 103.7 84.8 68.7 69.8 83.7 2009 Q3 100.0 15.6 99.1 99.6 83.9 71.2 72.4 82.7 Net Net Net Net disposable Final Net capital acquisition Gross lending/ income consumption saving transfers of non- fixed borrowing expenditure financial capital assets formation Annual percentage changes 1) 2005 4.3 4.3 4.7 -30.0 6.9 6.7 2006 4.6 4.0 10.7 47.4 6.1 8.8 2007 4.5 4.4 4.9 -4.4 7.3 5.9 2008 Q3 2.0 4.3 -21.8 -61.8 3.4 3.0 Q4 -1.0 2.1 -30.3 -41.7 -1.6 -3.6 2009 Q1 -4.4 0.6 -67.4 -63.0 -12.9 -10.9 Q2 -4.8 -0.3 -63.5 4.5 -18.8 -13.5 Q3 -3.2 -0.2 -43.0 19.1 -15.7 -12.0 As a percentage of gross domestic product 2007 84.6 76.9 7.7 0.2 22.3 22.0 0.3 2008 83.7 77.0 6.7 0.1 22.4 22.1 -0.8 2009 Q3 82.7 79.4 3.4 0.1 20.2 20.4 -1.1 Sources: ECB and Eurostat. ECB • Statistics Pocket Book • February 2010 21
- 24. 6.2 Households 1) Income, saving and investment Gross Final Gross Gross Changes disposable Compen- Operating, Net consump- saving fixed in net income sation mixed and current tion capital worth of emplo- property transfers expendi- formation yees incomes receivable ture Annual percentage changes 2) 2005 3.9 3.7 4.8 -5.1 4.0 2.9 7.7 2006 4.2 3.9 6.5 -8.6 4.1 3.8 10.4 2007 4.1 4.8 5.0 -9.7 4.4 2.3 3.3 2008 Q3 4.2 4.4 3.3 -2.6 4.2 5.0 0.8 Q4 2.2 2.9 -0.4 0.6 1.1 9.5 -5.8 2009 Q1 1.3 0.6 -1.4 11.1 -1.3 19.5 -12.4 Q2 0.7 -0.1 -5.2 22.2 -1.8 11.8 -15.1 Q3 0.3 -0.6 -4.5 20.2 -1.9 16.0 -14.0 As a percentage of households’ gross disposable income, adjusted 3) 2007 99.0 72.0 40.1 -13.1 86.1 13.9 10.8 14.1 2008 99.0 72.4 40.1 -13.6 86.1 13.9 10.7 -11.2 2009 Q3 99.0 72.1 38.6 -11.7 84.5 15.5 9.3 11.2 Financial investment and financing (loans) Financial Loans investment Currency Short- Long- Shares Insurance taken and term term and technical From deposits debt debt other reserves MFIs securities securities equity Annual growth rates 2005 4.5 5.0 -37.5 2.6 2.0 7.2 8.4 8.6 2006 4.2 5.3 52.6 1.7 0.4 7.6 9.2 9.4 2007 3.5 5.7 72.0 0.9 -0.3 6.2 7.4 7.1 2008 Q3 2.6 6.4 25.5 5.5 -3.4 4.4 4.4 3.9 Q4 2.6 7.1 7.0 4.1 -3.2 3.6 3.6 1.7 2009 Q1 2.4 6.6 -18.1 3.8 -2.4 3.5 2.7 0.4 Q2 2.8 5.9 -35.3 2.6 -1.3 3.6 2.1 0.2 Q3 3.0 5.3 -44.8 3.2 0.1 3.8 1.7 -0.3 Outstanding amounts as a percentage of households’ gross disposable income, adjusted 3) 2007 306.8 96.4 1.0 21.9 92.9 88.3 92.7 81.3 2008 284.0 98.8 1.2 22.0 70.6 85.9 93.2 80.9 2009 Q3 287.8 102.4 0.7 23.3 67.6 88.6 93.6 79.9 Sources: ECB and Eurostat. 22 ECB • Statistics Pocket Book • February 2010
- 25. 6.3 Non-financial corporations Value added, entrepreneurial income, saving and investment Gross Net Net Net Net value entrepre- saving acquisition Gross fixed Consumption lending/ added neurial of non- capital of fixed borrowing income financial formation capital assets Annual percentage changes 1) 2005 3.7 9.3 11.7 8.4 4.2 2006 5.4 9.5 23.5 7.8 4.4 2007 5.2 5.0 16.5 8.1 5.1 2008 Q3 3.2 -4.6 6.1 4.5 5.0 Q4 0.2 -11.1 -1.9 -5.8 4.6 2009 Q1 -4.9 -20.6 -16.4 -12.9 3.6 Q2 -6.6 -15.9 -39.6 -17.1 2.3 Q3 -4.5 -7.8 -56.5 -13.7 1.9 As a percentage of gross value added 2007 100.0 28.5 1.4 7.7 23.1 16.0 -4.6 2008 100.0 27.5 0.4 7.8 23.3 16.1 -5.8 2009 Q3 100.0 24.5 -1.0 3.6 21.4 17.3 -2.9 Financial investment and financing Financial Financing invest- Currency Shares ment and and Total Debt Shares deposits other Loans and equity taken From other MFIs equity Annual growth rates 2005 6.2 10.9 4.4 3.8 5.6 5.9 7.1 2.6 2006 7.0 12.3 4.6 5.3 9.6 10.6 11.9 2.5 2007 7.4 11.8 4.6 5.7 10.0 10.8 13.1 3.0 2008 Q3 5.1 6.5 4.9 4.8 9.4 10.1 11.5 2.0 Q4 4.1 1.5 5.0 4.4 8.4 8.9 9.0 2.0 2009 Q1 3.3 0.8 5.4 3.7 6.3 6.3 6.0 2.0 Q2 2.9 2.3 5.0 3.2 4.5 4.1 2.5 2.3 Q3 2.4 3.3 4.9 2.5 2.4 1.6 -0.5 2.6 Outstanding amounts as a percentage of gross value added 2007 346.7 35.3 180.6 495.9 184.7 161.6 94.9 310.6 2008 320.7 35.9 151.3 445.9 193.1 170.7 101.6 252.2 2009 Q3 335.9 38.5 157.7 467.9 207.4 181.9 105.3 260.0 Sources: ECB and Eurostat. ECB • Statistics Pocket Book • February 2010 23
- 26. 6.4 Insurance corporations and pension funds Financial investment and financing Financial investment Currency Debt Loans Shares and securi- and Quoted Mutual deposits ties other shares fund equity shares Annual growth rates 2005 7.2 6.1 10.2 0.8 5.8 5.0 8.2 2006 7.3 8.8 8.5 0.0 6.8 1.0 11.1 2007 5.0 9.6 9.3 -4.0 4.0 0.2 5.8 2008 Q3 3.5 4.9 5.3 4.0 2.1 -1.4 2.9 Q4 3.7 7.4 4.2 6.3 1.5 -2.2 2.0 2009 Q1 2.7 3.3 4.3 -0.4 1.2 -2.2 1.5 Q2 3.1 2.6 2.5 2.9 3.6 -2.9 7.0 Q3 3.6 2.2 2.8 2.8 5.2 -16.5 17.2 As a percentage of total outstanding financial assets 2007 100.0 13.3 37.8 6.8 42.0 12.7 20.4 2008 100.0 14.6 40.7 7.3 37.4 9.1 19.8 2009 Q3 100.0 14.3 41.6 7.2 36.8 6.8 22.3 Financing Changes Loans Shares Insurance in net and technical Net Prepayments financial other reserves equity of of insurance wealth equity households premiums Annual growth rates 2005 6.6 2.8 1.3 7.4 7.7 6.0 17.0 2006 7.6 18.7 2.1 7.8 8.6 3.2 -2.3 2007 6.1 11.2 1.3 6.4 7.4 0.8 -29.5 2008 Q3 3.6 -4.8 -1.4 4.6 4.9 2.5 -88.2 Q4 3.4 9.5 -0.1 3.5 3.8 1.1 -35.7 2009 Q1 2.9 0.1 0.5 3.1 3.5 0.7 -58.6 Q2 3.3 5.2 0.5 3.4 3.8 0.8 -3.3 Q3 3.5 4.0 1.0 3.6 4.1 0.5 12.5 As a percentage of total outstanding financial liabilities 2007 100.0 4.1 11.0 84.3 72.9 11.4 -1.5 2008 100.0 4.2 8.7 86.5 74.8 11.7 -2.4 2009 Q3 100.0 4.1 7.6 87.6 76.3 11.3 -2.4 Source: ECB. 24 ECB • Statistics Pocket Book • February 2010
- 27. 7 Government finance 7.1 Government revenue, expenditure, deficit/surplus and borrowing requirement (as a percentage of GDP; four-quarter moving sums for quarterly data 1) ) Total revenue Total expenditure Deficit(-)/ Borrowing surplus(+) requirement Direct Indirect Social Interest taxes taxes contributions 2003 45.0 11.4 13.1 15.7 48.0 3.3 -3.1 3.3 2004 44.6 11.3 13.2 15.5 47.5 3.1 -3.0 3.2 2005 44.8 11.5 13.4 15.4 47.3 3.0 -2.6 3.0 2006 45.3 12.1 13.5 15.3 46.6 2.9 -1.3 1.4 2007 45.4 12.4 13.5 15.1 46.0 3.0 -0.6 1.1 2008 Q1 45.4 12.5 13.3 15.1 46.1 3.0 -0.7 1.4 Q2 45.2 12.5 13.2 15.1 46.2 3.0 -1.0 1.5 Q3 45.1 12.4 13.1 15.2 46.4 3.0 -1.4 2.0 Q4 44.8 12.2 12.9 15.3 46.8 3.0 -2.0 5.1 2009 Q1 44.9 12.2 12.8 15.5 47.7 3.0 -2.8 6.4 Q2 44.7 11.9 12.8 15.6 48.8 3.0 -4.1 7.9 Q3 44.6 11.7 12.7 15.7 49.7 2.9 -5.1 8.7 Sources: ESCB, Eurostat, national data and ECB calculations. 7.2 Euro area government debt (as a percentage of GDP; four-quarter moving sums for quarterly data 1) ) Government debt Total Currency and Loans Short-term Long-term deposits securities securities 2003 69.1 2.1 12.4 5.0 49.6 2004 69.5 2.2 12.0 5.0 50.3 2005 70.0 2.4 11.8 4.7 51.2 2006 68.2 2.4 11.4 4.1 50.2 2007 65.9 2.2 10.8 4.2 48.8 2008 Q1 66.9 2.1 11.1 5.0 48.7 Q2 67.2 2.1 11.0 4.9 49.1 Q3 67.1 2.1 10.8 5.5 48.6 Q4 69.3 2.3 10.9 6.7 49.4 2009 Q1 72.7 2.3 11.0 7.9 51.6 Q2 75.9 2.4 11.5 8.4 53.6 Q3 77.6 2.3 11.6 9.2 54.5 Sources: ESCB, Eurostat, national data and ECB calculations. ECB • Statistics Pocket Book • February 2010 25
- 28. 8 Monetary policy 8.1 Key ECB interest rates (levels in percentages per annum; changes in percentage points) With effect Deposit facility Main refinancing operations Marginal lending facility from Fixed rate Variable rate tenders tenders Fixed rate Minimum bid rate Level Change Level Level Change Level Change 1999 1 Jan. 2.00 - 3.00 - - 4.50 - 4 2.75 0.75 3.00 - ... 3.25 -1.25 22 2.00 -0.75 3.00 - ... 4.50 1.25 9 Apr. 1.50 -0.50 2.50 - -0.50 3.50 -1.00 5 Nov. 2.00 0.50 3.00 - 0.50 4.00 0.50 2000 4 Feb. 2.25 0.25 3.25 - 0.25 4.25 0.25 17 Mar. 2.50 0.25 3.50 - 0.25 4.50 0.25 28 Apr. 2.75 0.25 3.75 - 0.25 4.75 0.25 9 June 3.25 0.50 4.25 - 0.50 5.25 0.50 28 3.25 ... - 4.25 ... 5.25 ... 1 Sep. 3.50 0.25 - 4.50 0.25 5.50 0.25 6 Oct. 3.75 0.25 - 4.75 0.25 5.75 0.25 2001 11 May 3.50 -0.25 - 4.50 -0.25 5.50 -0.25 31 Aug. 3.25 -0.25 - 4.25 -0.25 5.25 -0.25 18 Sep. 2.75 -0.50 - 3.75 -0.50 4.75 -0.50 9 Nov. 2.25 -0.50 - 3.25 -0.50 4.25 -0.50 2002 6 Dec. 1.75 -0.50 - 2.75 -0.50 3.75 -0.50 2003 7 Mar. 1.50 -0.25 - 2.50 -0.25 3.50 -0.25 6 June 1.00 -0.50 - 2.00 -0.50 3.00 -0.50 2005 6 Dec. 1.25 0.25 - 2.25 0.25 3.25 0.25 2006 8 Mar. 1.50 0.25 - 2.50 0.25 3.50 0.25 15 June 1.75 0.25 - 2.75 0.25 3.75 0.25 9 Aug. 2.00 0.25 - 3.00 0.25 4.00 0.25 11 Oct. 2.25 0.25 - 3.25 0.25 4.25 0.25 13 Dec. 2.50 0.25 - 3.50 0.25 4.50 0.25 2007 14 Mar. 2.75 0.25 - 3.75 0.25 4.75 0.25 13 June 3.00 0.25 - 4.00 0.25 5.00 0.25 2008 9 July 3.25 0.25 - 4.25 0.25 5.25 0.25 8 Oct. 2.75 -0.50 - 4.25 - 4.75 -0.50 9 3.25 0.50 - - - 4.25 -0.50 15 1) 3.25 ... 3.75 - ... 4.25 ... 12 Nov. 2.75 -0.50 3.25 - -0.50 3.75 -0.50 10 Dec. 2.00 -0.75 2.50 - -0.75 3.00 -0.75 2009 21 Jan. 1.00 -1.00 2.00 - -0.50 3.00 ... 11 Mar. 0.50 -0.50 1.50 - -0.50 2.50 -0.50 8 Apr. 0.25 -0.25 1.25 - -0.25 2.25 -0.25 13 May 0.25 ... 1.00 - -0.25 1.75 -0.50 Source: ECB. 26 ECB • Statistics Pocket Book • February 2010
- 29. 8.2 Eurosystem monetary policy operations allotted through tenders (EUR millions; interest rates in percentages per annum) Date of Bids Number Allotment Fixed Variable Running settlement (amount) of (amount) rate rate for participants tenders tenders (...) days Fixed Minimum Marginal Weighted rate bid rate rate 1) average rate Main refinancing operations 2009 14 Oct. 61,565 218 61,565 1.00 - - - 7 21 49,803 224 49,803 1.00 - - - 7 28 48,660 188 48,660 1.00 - - - 7 4 Nov. 46,201 170 46,201 1.00 - - - 7 11 51,250 160 51,250 1.00 - - - 7 18 52,580 177 52,580 1.00 - - - 7 25 59,066 168 59,066 1.00 - - - 7 2 Dec. 58,128 137 58,128 1.00 - - - 6 8 55,779 111 55,779 1.00 - - - 8 16 52,899 125 52,899 1.00 - - - 7 23 58,575 109 58,575 1.00 - - - 7 30 78,647 132 78,647 1.00 - - - 7 2010 6 Jan. 54,023 100 54,023 1.00 - - - 7 13 60,077 102 60,077 1.00 - - - 7 20 58,020 101 58,020 1.00 - - - 7 27 63,435 83 63,435 1.00 - - - 7 3 Feb. 55,824 74 55,824 1.00 - - - 7 Longer-term refinancing operations 2009 10 Sep. 3,161 14 3,161 1.00 - - - 91 1 Oct. 2,769 19 2,769 1.00 - - - 77 1 75,241 589 75,241 1.00 - - - 364 8 1,128 8 1,128 1.00 - - - 98 8 2,368 22 2,368 1.00 - - - 182 14 7,741 19 7,741 1.00 - - - 28 29 3,284 25 3,284 1.00 - - - 91 11 Nov. 2,536 12 2,536 1.00 - - - 27 12 10,794 9 10,794 1.00 - - - 91 12 782 21 782 1.00 - - - 182 26 2,065 19 2,065 1.00 - - - 91 8 Dec. 2,655 8 2,655 1.00 - - - 43 10 2,933 9 2,933 1.00 - - - 91 10 1,728 21 1,728 1.00 - - - 182 17 2,558 21 2,558 1.00 - - - 105 17 2) 96,937 224 96,937 . - - - 371 2010 20 Jan. 5,739 7 5,739 1.00 - - - 21 28 3,268 22 3,268 1.00 - - - 91 Source: ECB. ECB • Statistics Pocket Book • February 2010 27