Examples from the Western Indian Ocean
•Descargar como PPT, PDF•
1 recomendación•391 vistas

ASCLME/SWIOFP/FAO Nansen projects Warwick Sauer and Kevern Cochrane Presentation at the 2nd Targeted Workshop for GEF IW Projects in Africa on Economic Valuation in November 2012 in Addis Ababa.
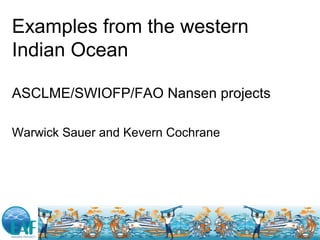
![ManagementManagement
ProcessesProcesses
i) Developing ai) Developing a
managementmanagement
planplan
4.1.2 Scoping
[Fishery & area,
Stakeholders,
Broad issues]
4.1.3 Background information & analysis
4.1.5 Formulating rules
Implementation &
enforcement
4.1.4 Setting objectives
[Broad objectives,
Operational objectives,
Indicators & performance
measures]
4.1.6 Monitoring
4.1.6 Long-term review
4.1.6 Short-term review
Consultationwithstakeholders
C](data:image/gif;base64,R0lGODlhAQABAIAAAAAAAP///yH5BAEAAAAALAAAAAABAAEAAAIBRAA7)
Recomendados
Recomendados
Más contenido relacionado
Destacado
Destacado (17)
Similar a Examples from the Western Indian Ocean
Similar a Examples from the Western Indian Ocean (20)
Más de Iwl Pcu
Más de Iwl Pcu (20)
Examples from the Western Indian Ocean
- 1. Examples from the western Indian Ocean ASCLME/SWIOFP/FAO Nansen projects Warwick Sauer and Kevern Cochrane
- 2. ManagementManagement ProcessesProcesses i) Developing ai) Developing a managementmanagement planplan 4.1.2 Scoping [Fishery & area, Stakeholders, Broad issues] 4.1.3 Background information & analysis 4.1.5 Formulating rules Implementation & enforcement 4.1.4 Setting objectives [Broad objectives, Operational objectives, Indicators & performance measures] 4.1.6 Monitoring 4.1.6 Long-term review 4.1.6 Short-term review Consultationwithstakeholders C
- 3. Response option 1 Response option 2 Response Option 1 Response Option 2 Response Option 1 Response Option 2 Response Option 3 Response Option 1 Response Option 2 Response Option 3
- 4. Kenya Tanzania Mozambique Zim Zambia Namibia Malawi Lesotho Uganda Often little data available SADC NEPAD Seychelles Cape Verde Madagascar Swaziland Angola Eritrea Mauritius
- 5. In Africa a close link with the resources and socio-economic vulnerability
- 6. Assessment of the octopus resource in Rodriques
- 7. Octopus catch • Dire situation for the local fishers
- 9. Over 10000 tons of toxic waste dumped offOver 10000 tons of toxic waste dumped off Spmalia in the 1990’s/early 2000 bySpmalia in the 1990’s/early 2000 by european countrieseuropean countries
- 10. The need to anchor biological research to an economic and social framework
- 11. There are many challenges...
- 12. Compiling Fisheries management plans for Tanzania, Kenya and Seychelles, •1 month course held at Rhodes for representatives from the ASCLME/SWIOFP countries •Each country to choose a fishery and compile a management plan by December 2012
- 13. BASELINE STUDY: •Preamble •Objectives •Policy and legal framework within which the fishery is operating •Institutional and administrative frameworks •Overview of the fishery and resources exploited •Available scientific and traditional knowledge on the resources •Assessment of the importance of the fishery in the national economy •Management measures currently being used in the fishery •Effectiveness of the current management •Compliance and Enforcement: •The way forward •References
- 14. Risk Analysis involves consideration of : • the sources of risk, • their consequences and • the likelihood that they may occur. Moreover, it allows for the prioritization of issues or hazards with justification and the subsequent prioritization of management responses. It requires stakeholders to deliberate and come up with an agreed position and provides an agreed roadmap for the way forward. In essence it is a way of operationalizing policy. Risk Analysis
- 15. • Identification of Issues The methodology utilizes generic component trees to help participants to tease out the main issues or concerns that the fishery faces (Figure 1).
- 16. Consequence Level Likelihood Minor Moderate Major Extreme 1 2 3 4 Remote 1 1 2 3 4 Unlikely 2 2 4 6 8 Possible 3 3 6 9 12 Likely 4 4 8 12 16
- 17. This information is then used to compile a fisheries management plan…
- 18. Using the broad information required by the management plan to set management measures: Perhaps think simple models - Gather fishery biological, economic, social and political information to gauge trends in sustainability – Set Target and limit indicators e.g. simple biological indicators from an Angolan study.. Proposed Example Robot ≥ 336660 < 336660 ≤ 217200 ≤ 0.51 > 0.51 ≥ 0.65 ≥ 738 < 738 ≤ 664 ≥ 0.08 < 0.08 ≤ 0.05 Cut off Values ≥ 60% baseline < 60% baseline ≤ 40% baseline Sardinella Biomass (baseline = 543 000mt) ≤ baseline M + 0.1 > baseline M + 0.1 > RSA Z + 0.10 Mean Z (baseline M = 0.38, F = 0.03, Z = 0.41) ≥ 10% baseline < 10% baseline ≤ 20% baseline Mean size of mature fish (baseline 820mm FL) ≥ 60% baseline < 60% baseline ≤ 40% baseline Mean cpue (baseline 0.13 fish.angler- 1hour) EstimatorIndicator (baseline reference point) Proposed Example Robot ≥ 336660 < 336660 ≤ 217200 ≤ 0.51 > 0.51 ≥ 0.65 ≥ 738 < 738 ≤ 664 ≥ 0.08 < 0.08 ≤ 0.05 Cut off Values ≥ 60% baseline < 60% baseline ≤ 40% baseline Sardinella Biomass (baseline = 543 000mt) ≤ baseline M + 0.1 > baseline M + 0.1 > RSA Z + 0.10 Mean Z (baseline M = 0.38, F = 0.03, Z = 0.41) ≥ 10% baseline < 10% baseline ≤ 20% baseline Mean size of mature fish (baseline 820mm FL) ≥ 60% baseline < 60% baseline ≤ 40% baseline Mean cpue (baseline 0.13 fish.angler- 1hour) EstimatorIndicator (baseline reference point) rr gg oo gg0.15 = 105000= g oo rr gg oo rr oo rr gg oo rr gg 750 = 0.48 = Traffic light system No restrictions Fishery closure Eg. Closed areas (size and location to be determined) Eg. Closed season (Aug–Oct) First tier Second tier Third tier Management framework Indicators
- 19. BUT HOW DOWE MAKE MANAGERS ACT ONTHIS ADVICE? THE FAO CODE OF CONDUCT SUGGESTS WE USETHE PRECAUTIONARY APPROACH FOR MANAGING MARINE SPECIES WITH LITTLE OR UNCERTAIN DATA Precautionary approach - If in doubt, adopt a cautious position based on a ‘worst-case’ scenario Problem: Managers are uncomfortable at basing their management plans/strategies on what is often seen as ‘supposition’ or limited observation with limited supportive scientific evidence Policy-Makers do not feel fully justified in making policy decisions which may threaten or impact on other social or economic priorities unless they have reliable ‘justification’ (clear advice from scientists) to support their decisions Scientists are therefore understandable nervous about ‘sticking their necks out’ and provide advice/guidance based on anything less than very high confidence limits (95% +)
- 20. No confidence limits Managers / policy makers reluctant to base decisions on ‘supposition’ Provides an indication of trends Enables faster action Allows adaptive management Prioritises issues for further study Indicators and modelling used as tools Scientific research Precautionary approach Weight-of Evidence approach for Adaptation measures? Few, detailed studies Large body of work Advise and Guide Policy and Management Decisions 95% confidence required Very reliable but data demanding Often based on long term studies (too long to wait) Traditional approach Limited Peer Review (1-3 Specialists?) Extensive Peer Review (multi-sectoral) Limited or No Peer Review Too slow for effective Management decisions Too unreliable for effective Management decisions Fast-Track decision-making supported by expert opinion WE REQUIRTE AN ALTERNATE APPROACH, PARICULALRY FOR DEVLOPING COUNTRIES WITH LIMITED CAPACITY…
- 21. BUILDING AN ECOSYSTEM APPROACH TO MANAGING AFRICAN MARINE RESOURCES ResearchTraditional Publication >95% CI Submit Trends Paper “Trends in Ecosystem Variability & Adaptive Management” <95% CI IW Review Board; SET UP BY IW LEARN? Review Panel Includes: Biological, Physico-Chemical, Modelling, Socio- economics & Governance experts Peer Review Roster Maintained by Includes specialist reviewers in: Marine Biology Physical Oceanography Chemical Oceanography Pollution Modelling Remote Sensing Socio-Economics Governance Trend Assessment & Allocation HP P L UL HUL Reject? Recommend as Priority Trend ReferBackforMoreConfidence A.National importance- DraftPolicy Brief B.Regionalimportance -DraftManagement Brief C.FurtherStudies& StrengtheningofConfidence National Agency Regional management groups Funding/ Support
Notas del editor
- Bellard, C., Bertelsmeier, C., Leadley, P., Thuiller, W. & Courchamp, F. 2012 Impacts of climate change on the future of biodiversity. Ecology Letters, doi: 10.1111/j.1461-0248.2011.01736.x.
- Rock lobster future scenario 1 (dark blue line in Figure 22): Recruitment decline with increased temperature is greater than estimated from recruitment data derived from fisher logbook book data (i.e. we assumed impact would be more in line with the changes in puerulus settlement that have been observed with temperature). Declines in exploitable biomass occur after only minor initial increases in biomass driven by improved growth rates. Reduction in exploitable biomass is predicted to be greater and occur earlier in the north. The abundance of large lobsters would be insufficient to prevent Centrostephanus barrens formation along the east coast in the immediate future, and state-wide in the medium term (e.g. 2035). Rock lobster future scenario 2 (light blue line in Figure 22): In this scenario growth responds more rapidly to temperature so that the stock becomes more productive initially. Increases in growth are predicted to lead to increases in exploitable biomass in all regions, driven by gains in productivity in the southern regions of the state, dragging commercial effort southwards. Centrostephanus barrens formation remains an immediate risk until the inshore biomass of lobsters over 145 millimetres CL becomes sufficient to limit the spread of barrens. Gains from growth are not negated by falls in recruitment until sometime after 2070, although it is important to acknowledge that this decline would still occur and would also include a decline in larger lobsters, ultimately increasing probability of barrens formation. Increased recreational effort may result as a function of improved catch rates due to increased biomass but only if barrens formation is limited.