SlideShare una empresa de Scribd logo
1 de 16
Descargar para leer sin conexión
Graphing Nagios services with pnp4nagios

Jason Holtzapple (jason@bitflip.net)

Nagios is a popular open source computer system and network monitoring software application. It
watches hosts and services, alerting users when things go wrong and again when they get better. Some
of the major features of Nagios are:

   •   Over 50 bundled plugins for checking common protocols and services (HTTP, FTP, disk space,
       S.M.A.R.T., lmsensors, etc). Hundreds of other monitoring plugins are available at nagios-
       exchange.org
   •   Simple API allows plugin creation in any language supported by OS
   •   Supports many different reports such as availability, alert histograms and top alerts.
   •   Support for distributed monitoring and clustered configurations

pnp4nagios is a framework written in perl, PHP and C for automatically parsing performance data
collected by Nagios plugins. The data is collected into RRD databases for display in the Nagios web
interface. The graphs created by pnp4nagios are similar to other monitoring tools like Cacti:


pnp4nagios is designed to work well with the standard Nagios plugins and create useable graphs right
out of the box. The appearance of the graphs can be customized.

Pages of related graphs (for instance, CPU usage or TCP connections of each server in a web farm) can
be easily defined and displayed in HTML or exported to PDF.

Because Nagios does not perform checks while performance data is being processed all processing can
be offloaded to the npcd daemon for large installations.

pnp4nagios requires perl, PHP (built with XML, zlib and GD support) and rrdtool. It can optionally use
the rrd perl modules for better performance. Pre-built Fedora packages are available and a Debian
package is planned. Our example will use Ubuntu Server 8.10 with the bundled perl, PHP and Apache
packages. Nagios has been installed from source in the default location of /usr/local/nagios.
Installing pnp4nagios
You use the typical configure/make/make install to install pnp4nagios:

jth@ubuntu:~/pnp-0.4.13$ ./configure
checking for a BSD-compatible install... /usr/bin/install -c
checking build system type... i686-pc-linux-gnu
checking host system type... i686-pc-linux-gnu
…
*** Configuration summary for pnp 0.4.13 02-19-2009 ***

  General Options:
  -------------------------         -------------------
  Nagios user/group:                nagios nagios
  Install directory:                /usr/local/nagios
  HTML Dir:                         /usr/local/nagios/share/pnp
  Config Dir:                       /usr/local/nagios/etc/pnp
  Path to rrdtool:                  /usr/bin/rrdtool (Version 1.2.27)
  RRDs Perl Modules:                FOUND (Version 1.2027)
  RRD Files stored in:              /usr/local/nagios/share/perfdata
  process_perfdata.pl Logfile:      /usr/local/nagios/var/perfdata.log
  Perfdata files (NPCD) stored in: /usr/local/nagios/var/spool/perfdata/
jth@ubuntu:~/pnp-0.4.13$ make all
...
jth@ubuntu:~/pnp-0.4.13$ sudo make install
cd ./src && make install
make[1]: Entering directory `/home/jth/pnp-0.4.13/src'
...

*** Main program, Scripts and HTML files installed ***

Please run 'make install-config' to install sample
configuration files

jth@ubuntu:~/pnp-0.4.13$ sudo make install-config
cd ./sample-config && make install-config
make[1]: Entering directory `/home/jth/pnp-0.4.13/sample-config'
rm -f /usr/local/nagios/share/pnp/conf/config.php
/usr/bin/install -c -m 755 -o nagios -g nagios -d /usr/local/nagios/etc/pnp
...
Configuring pnp4nagios
The main configuration files for pnp4nagios are located in /usr/local/nagios/share/pnp (web frontend
and graph options) and /usr/local/nagios/etc/pnp (global options – tool paths, access control, etc)
Before configuring pnp, we need to decide how we want Nagios to process the performance data. This
largely depends on the number of monitored hosts and services of Nagios.
     •   Default mode, where process_perfdata.pl is executed after each host and service check, is
         acceptable for small installations.
     •   Bulk mode, where performance information is appended to a temporary file and processed after
         a short interval, is fine for medium-sized installations.
     •   Setups with hundreds of hosts and services should use bulk mode with npcd, where a separate
         multi-threaded daemon handles the processing.
Our example will use Bulk mode, but it is possible to switch between modes as your Nagios setup
grows.
Edit the performance data section of /usr/local/nagios/etc/nagios.cfg:
#   PROCESS PERFORMANCE DATA OPTION
#   This determines whether or not Nagios will process performance
#   data returned from service and host checks. If this option is
#   enabled, host performance data will be processed using the
#   host_perfdata_command (defined below) and service performance
#   data will be processed using the service_perfdata_command (also
#   defined below). Read the HTML docs for more information on
#   performance data.
#   Values: 1 = process performance data, 0 = do not process performance data

process_performance_data=1

#   HOST AND SERVICE PERFORMANCE DATA PROCESSING COMMANDS
#   These commands are run after every host and service check is
#   performed. These commands are executed only if the
#   enable_performance_data option (above) is set to 1. The command
#   argument is the short name of a command definition that you
#   define in your host configuration file. Read the HTML docs for
#   more information on performance data.

#host_perfdata_command=process-host-perfdata
#service_perfdata_command=process-service-perfdata

#   HOST AND SERVICE PERFORMANCE DATA FILES
#   These files are used to store host and service performance data.
#   Performance data is only written to these files if the
#   enable_performance_data option (above) is set to 1.

host_perfdata_file=/usr/local/nagios/var/host-perfdata
service_perfdata_file=/usr/local/nagios/var/service-perfdata

#   HOST AND SERVICE PERFORMANCE DATA FILE TEMPLATES
#   These options determine what data is written (and how) to the
#   performance data files. The templates may contain macros, special
#   characters (t for tab, r for carriage return, n for newline)
#   and plain text. A newline is automatically added after each write
#   to the performance data file. Some examples of what you can do are
#   shown below.
host_perfdata_file_template=DATATYPE::HOSTPERFDATAtTIMET::$TIMET$tHOSTNAME::$H
OSTNAME$tHOSTPERFDATA::$HOSTPERFDATA$tHOSTCHECKCOMMAND::$HOSTCHECKCOMMAND$tHO
STSTATE::$HOSTSTATE$tHOSTSTATETYPE::$HOSTSTATETYPE$tHOSTOUTPUT::$HOSTOUTPUT$

service_perfdata_file_template=DATATYPE::SERVICEPERFDATAtTIMET::$TIMET$tHOSTNA
ME::$HOSTNAME$tSERVICEDESC::$SERVICEDESC$tSERVICEPERFDATA::$SERVICEPERFDATA$t
SERVICECHECKCOMMAND::$SERVICECHECKCOMMAND$tHOSTSTATE::$HOSTSTATE$tHOSTSTATETYP
E::$HOSTSTATETYPE$tSERVICESTATE::$SERVICESTATE$tSERVICESTATETYPE::$SERVICESTAT
ETYPE$tSERVICEOUTPUT::$SERVICEOUTPUT$

#   HOST AND SERVICE PERFORMANCE DATA FILE MODES
#   This option determines whether or not the host and service
#   performance data files are opened in write ("w") or append ("a")
#   mode. If you want to use named pipes, you should use the special
#   pipe ("p") mode which avoid blocking at startup, otherwise you will
#   likely want the defult append ("a") mode.

host_perfdata_file_mode=a
service_perfdata_file_mode=a

#   HOST AND SERVICE PERFORMANCE DATA FILE PROCESSING INTERVAL
#   These options determine how often (in seconds) the host and service
#   performance data files are processed using the commands defined
#   below. A value of 0 indicates the files should not be periodically
#   processed.

host_perfdata_file_processing_interval=15
service_perfdata_file_processing_interval=15

#   HOST AND SERVICE PERFORMANCE DATA FILE PROCESSING COMMANDS
#   These commands are used to periodically process the host and
#   service performance data files. The interval at which the
#   processing occurs is determined by the options above.

host_perfdata_file_processing_command=process-host-perfdata-file
service_perfdata_file_processing_command=process-service-perfdata-file


At the end of /usr/local/nagios/etc/objects/commands.cfg, add the command definitions:

define command{
        command_name       process-service-perfdata-file
        command_line       $USER1$/process_perfdata.pl --bulk=/usr/local/nagios/var/service-
perfdata
 }

define command{
        command_name       process-host-perfdata-file
        command_line       $USER1$/process_perfdata.pl --bulk=/usr/local/nagios/var/host-
perfdata
 }


Restart Nagios. Now if you look in /usr/local/nagios/share/perfdata, you should start to see rrd files
created by pnp4nagios for all your monitored hosts and services. These rrd files are created with pnp's
default time settings - 48 hours of 1 minute time step data, 4 years of 360 minute time step data. If you
want more or less, change rra.cfg before running pnp for the first time.

If everything is set up correctly, http://your-nagios-host/nagios/pnp/index.php should show your first
pnp graphs. If not, a debug message should tell you which component was broken or missing.
There is one more step to complete the setup. We need to enable extended info in Nagios so that links
to the graphs are created for each applicable host and service.

Append two entries to /usr/local/nagios/etc/objects/templates.cfg:

define host {
  name       host-pnp
  register   0
  action_url /nagios/pnp/index.php?host=$HOSTNAME$
}

define service {
  name       srv-pnp
  register   0
  action_url /nagios/pnp/index.php?host=$HOSTNAME$&srv=$SERVICEDESC$
}
These are templates that you add to each host and service definition with graphs:

define host {
    use                         linux-server,host-pnp
    host_name                   ubuntu
    alias                       ubuntu
    address                     127.0.0.1
}

define service {
    use                                  local-service,srv-pnp
    host_name                            ubuntu
    service_description                  PING
    check_command                        check_ping!100.0,20%!500.0,60%
}

After signalling Nagios to restart, the icons for the graphs should appear next to the hosts and services.
I usually replace the “bullet hole” image /usr/local/nagios/share/images/action.gif with the graph image
provided in /usr/local/nagios/share/pnp/images/action.gif


The number of graphs and time period displayed on the web interface is independent of what's actually
stored in the rrd files. To change these, see the options in the pnp/config.php file.
Example: Setting Up An SNMP Service
check_snmp_int is a 3rd party check plugin specifically designed to check network interface counters
via SNMP. We'll set it up to create a cacti-style traffic graph for our server. Our server already has
snmpd installed and the community string set to 'public'.

1. Copy the check_snmp_int script into the plugin directory: /usr/local/nagios/libexec. Make sure it is
owned by the Nagios user and is executable.

2. Create the service definition in /usr/local/nagios/etc/objects/localhost.cfg:

define service {
use                         local-service,srv-pnp
host_name                   ubuntu
service_description         NIC_ETH0
check_command               check_snmp_int!eth0!-f
}

Service definitions should be made as flexible as possible. “!” separates arguments that nagios will
send to the underlying command. The first argument is the interface name and the second argument
contains any additional arguments for the check_snmp_int plugin.

3. Create the command definition in /usr/local/nagios/etc/objects/commands.cfg:

define command {
command_name    check_snmp_int
command_line    $USER1$/check_snmp_int -H $HOSTADDRESS$ -C $USER3$ -n $ARG1$ $ARG2$
}


$HOSTADDRESS$ is built-in macro supplied by Nagios as the hostname of the server being checked.
$USER3$ is the public community string that we'll define in a minute. $ARG1$ and $ARG2$ are set to
'eth0' and '-f' when our check is run.

4. Define the $USER3$ macro in /usr/local/nagios/etc/resource.cfg:

# Sets $USER1$ to be the path to the plugins
$USER1$=/usr/local/nagios/libexec

# Sets $USER2$ to be the path to event handlers
#$USER2$=/usr/local/nagios/libexec/eventhandlers

# SNMP public community string
$USER3$=public


5. To display the graph pnp will look in its template.dist directory and see if there's a file with the
same name as the command_name of the command definition. If there is, it will use it. If not, it will use
default.pnp. This is a php script that builds arguments to the rrdtool command. If there is a customized
file in the template directory, it will use that instead. But there are two issues with the supplied
check_snmp_int.php: we would like the graph to have the same format as cacti and we'd also like it to
display in the more standard bits per second, not bytes per second as collected.
There is already an included template that does the bytes to bits conversion installed with pnp:
check_snmp_int-bits.php. We'll copy /usr/local/nagios/share/pnp/templates.dist/check_snmp_int-
bits.php to /usr/local/nagios/share/pnp/templates/check_snmp_int.php for our local edits. I've
highlighted what to change:

RRD CHEAT SHEET
rrd – file containing multiple sources of time-related data
step – time interval in rra
rra – round-robin archive. An rrd file will contain one of these for each step and timeperiod recorded
DEF – get data from an rrd file
CDEF – create new set of data from existing DEF (can be used for graphing like DEF)
AREA, LINE – draw graph using DEF or CDEF
GPRINT – print inside the graph

<?php
#
# Copyright (c) 2006-2008 Joerg Linge (http://www.pnp4nagios.org)
# Plugin: check_iftraffic.pl (COUNTER)
# Output based on Bits/s
#
# $Id: check_snmp_int-bits.php 523 2008-09-26 17:10:20Z pitchfork $
#
#
$opt[1] = " --vertical-label "Traffic" -b 1000 --title "Interface Traffic for $hostname /
$servicedesc" ";
$def[1] = "DEF:var1=$rrdfile:$DS[1]:AVERAGE " ;
$def[1] .= "DEF:var2=$rrdfile:$DS[2]:AVERAGE " ;
$def[1] .= "CDEF:in_bits=var1,8,* ";
$def[1] .= "CDEF:out_bits=var2,8,* ";
$def[1] .= "AREA:in_bits#00cf00:"in " " ;
$def[1] .= "GPRINT:in_bits:LAST:"%7.2lf %Sbit/s last" " ;
$def[1] .= "GPRINT:in_bits:AVERAGE:"%7.2lf %Sbit/s avg" " ;
$def[1] .= "GPRINT:in_bits:MAX:"%7.2lf %Sbit/s maxn" " ;
$def[1] .= "LINE1:out_bits#002a00:"out " " ;
$def[1] .= "GPRINT:out_bits:LAST:"%7.2lf %Sbit/s last" " ;
$def[1] .= "GPRINT:out_bits:AVERAGE:"%7.2lf %Sbit/s avg" " ;
$def[1] .= "GPRINT:out_bits:MAX:"%7.2lf %Sbit/s maxn" ";
if($NAGIOS_TIMET != ""){
    $def[1] .= "VRULE:".$NAGIOS_TIMET."#000000:"Last Service Check n" ";
}
if($NAGIOS_LASTHOSTDOWN != ""){
    $def[1] .= "VRULE:".$NAGIOS_LASTHOSTDOWN."#FF0000:"Last Host Downn" ";
}
?>


Now our graph will look like this (I cheated a bit because our new graph would not have collected this
much data yet, but this it what it would look like in a few hours):
Example: Migrating a legacy graphing tool (Orca) to pnp4nagios
Rationale: during an upgrade from Nagios 1 to Nagios 3, a decision was made to replace Orca (which
is not very actively maintained by the authors) running on Solaris 8 & 10 servers with pnp4nagios. The
Orca collector would remain on the system, generating the same statistics, but the statistics will be
collected and displayed by Nagios and pnp.

Orca works by collecting performance data regularly on each monitored system. Periodically the
collector logs are copied to a central server where they are processed into rrd files. A cgi script allows a
web browser to view the graphs. The basic steps to migrate this service are:

   1.   Configure Orca to write logs to new location and rotate daily
   2.   Write Nagios plugin to read orca log and return appropriate data
   3.   Write pnp4nagios template to display the data
   4.   Turn off old Orca server
   5.   Profit

The first line of an Orca log contains a space separated list of parameters monitored. The second and
subsequent lines contain timestamped performance data. This makes it easy to write a script to request
parameters and return values.

root@orcaclient [16:43:51 tmp] head -2 /tmp/orcallator-2009-03-28-000

timestamp locltime    uptime state_D state_N state_n state_s state_r state_k state_c state_m state_d
state_i state_t DNnsrkcmdit usr% sys% wio% idle% ... (several dozen more parameters)

1238223600 00:00:00 2443807         8        2       0       0       0       0        0        8       2
0       2 RgwwwwwRgwg  1.2 22.6      0.0   76.2   ... (several dozen more parameters)

The Nagios plugin is called with a list of all parameters requested:
check_solaris_orcallator -q "#proc/s,tcp_Icn/s,tcp_Ocn/s,dnlc_hit%,inod_hit%,tcp_Ret%,tcp_Dup
%,tcp_estb,tcp_Rst/s,tcp_Atf/s,tcp_Ldrp/s,tcp_LdQ0/s,tcp_HOdp/s,smtx,smtx/cpu,disk_rd/s,disk_wr/s,disk_
rK/s,disk_wK/s,dnlc_ref/s,inod_ref/s,scanrate,pageslock,usr%,sys%,wio%,idle%"

Here is the output in standard Nagios plugin performance format. (See the Nagios docs for more details
on this format)
ORCA OK - tcp_Atf/s 0.000 tcp_Ldrp/s 0.000 tcp_LdQ0/s 0.000 tcp_HOdp/s 0.000 smtx 972 smtx/cpu 60
disk_rd/s 14.5 disk_wr/s 222.3 disk_rK/s 463.5 disk_wK/s 11454.4 #proc/s 2.247 dnlc_ref/s 4441.080
inod_ref/s 0.740 scanrate 0.000 pageslock 13326231 usr% 0.2 sys% 2.2 wio% 0.0 idle% 97.5 tcp_Icn/s
0.397 tcp_Ocn/s 0.217 dnlc_hit% 99.992 inod_hit% 100.000 tcp_Ret% 0.000 tcp_Dup% 0.000 tcp_estb 337
tcp_Rst/s 0.403 |'tcp_Atf/s'=0.000 'tcp_Ldrp/s'=0.000 'tcp_LdQ0/s'=0.000 'tcp_HOdp/s'=0.000 'smtx'=972
'smtx/cpu'=60 'disk_rd/s'=14.5 'disk_wr/s'=222.3 'disk_rK/s'=463.5 'disk_wK/s'=11454.4 '#proc/s'=2.247
'dnlc_ref/s'=4441.080 'inod_ref/s'=0.740 'scanrate'=0.000 'pageslock'=13326231 'usr%'=0.2 'sys%'=2.2
'wio%'=0.0 'idle%'=97.5 'tcp_Icn/s'=0.397 'tcp_Ocn/s'=0.217 'dnlc_hit%'=99.992 'inod_hit%'=100.000
'tcp_Ret%'=0.000 'tcp_Dup%'=0.000 'tcp_estb'=337 'tcp_Rst/s'=0.403
The complete check_solaris_orcallator perl script is included at the end of the presentation. This script
needs to be copied to each monitored host.

The nagios service definition looks like this:
define service {
use                     service-unix-template,srv-pnp
hostgroup_name          orcallator
service_description     ORCA_ALL
check_command           check_nrpe_solaris_orcallator_all
}


The command definition looks like:
define command {
command_name    check_nrpe_solaris_orcallator_all
command_line    $USER1$/check_nrpe -H $HOSTADDRESS$ -c check_solaris_orcallator_all
}

check_nrpe is the standard Nagios agent for running check programs on remote hosts.
Each monitored host has this entry in its /usr/local/nagios/etc/nrpe.cfg:
command[check_solaris_orcallator_all]=/usr/local/nagios/libexec/check_solaris_orcallator -q
"#proc/s,tcp_Icn/s,tcp_Ocn/s,dnlc_hit%,inod_hit%,tcp_Ret%,tcp_Dup
%,tcp_estb,tcp_Rst/s,tcp_Atf/s,tcp_Ldrp/s,tcp_LdQ0/s,tcp_HOdp/s,smtx,smtx/cpu,disk_rd/s,disk_wr/s,disk_
rK/s,disk_wK/s,dnlc_ref/s,inod_ref/s,scanrate,pageslock,usr%,sys%,wio%,idle%"


The last task is to create a pnp template for graph display. Each counter/value pair returned from the
orca plugin is placed into its own data source (DS) in the rrd file by pnp (in order). The appearance and
legend of the graphs follow Orca as closely as possible. Here is the code for displaying the first graph –
the full version for all 15 graphs is at the end of the presentation.
<?php
#
# display Orca counters. The file is in DS order, the actual graphs are displayed in
# $opt[]/$def[] order on the web pages

$opt[1] = "--lower-limit 0 --upper-limit 100 --rigid --vertical-label "" -b 1000
--title "$hostname / CPU"";
$ds_name[1] = "usr%,sys%,wio%,idle%";
$def[1] = "DEF:var1=$rrdfile:$DS[16]:AVERAGE " ;
$def[1] .= "DEF:var2=$rrdfile:$DS[17]:AVERAGE " ;
$def[1] .= "DEF:var3=$rrdfile:$DS[18]:AVERAGE " ;
$def[1] .= "DEF:var4=$rrdfile:$DS[19]:AVERAGE " ;
$def[1] .= "AREA:var1#0000ff:$NAME[16]:STACK ";
$def[1] .= "GPRINT:var1:LAST:"%3.1lf last" " ;
$def[1] .= "GPRINT:var1:AVERAGE:"%3.1lf avg" " ;
$def[1] .= "GPRINT:var1:MAX:"%3.1lf max" " ;
$def[1] .= "AREA:var2#ff0000:$NAME[17]:STACK ";
$def[1] .= "GPRINT:var2:LAST:"%3.1lf last" " ;
$def[1] .= "GPRINT:var2:AVERAGE:"%3.1lf avg" " ;
$def[1] .= "GPRINT:var2:MAX:"%3.1lf maxn" ";
$def[1] .= "AREA:var3#8b00cc:$NAME[18]:STACK ";
$def[1] .= "GPRINT:var3:LAST:"%3.1lf last" " ;
$def[1] .= "GPRINT:var3:AVERAGE:"%3.1lf avg" " ;
$def[1] .= "GPRINT:var3:MAX:"%3.1lf max" ";
$def[1] .= "AREA:var4#00cf00:$NAME[19]:STACK ";
$def[1] .= "GPRINT:var4:LAST:"%3.1lf last" " ;
$def[1] .= "GPRINT:var4:AVERAGE:"%3.1lf avg" " ;
$def[1] .= "GPRINT:var4:MAX:"%3.1lf maxn" ";
When it is all put together, the collection of Orca graphs looks like this:
Custom scripts:
/usr/local/nagios/libexec/check_solaris_orcallator

#!/usr/bin/perl -wT

use strict;
use Getopt::Std;

$ENV{'PATH'}='/usr/bin';

# Nagios plugin return values
my $RET_OK   = 0;
my $RET_WARN = 1;
my $RET_CRIT = 2;
my $RET_UNK = 3;
my $result = 'UNKNOWN';

my   ($key, $value);
my   $sorted_key;
my   %stat_map;
my   $addr;
my   %values;
my   $ret;
my   $stats;
my   $count;

my %opts;
getopts ('q:', %opts);

my $QUERY = $opts{q} || '';

unless ($QUERY) {
    usage ();
    exit $RET_WARN;
}

my $orca_logloc = '/tmp/orcallator*';
my $orca_log = `ls -t $orca_logloc | head -1 2>/dev/null`;

unless ($orca_log) {
    print "Can't find orcallator log file in $orca_logloc";
    exit $RET_UNK;
}

chomp ($orca_log);

$count = 0;
open ORCA, "$orca_log" or die "Can't open $orca_log: $!";
my $line = <ORCA>;
chomp $line;
foreach (split /s+/, $line) {
    $stat_map{$_} = $count;
    ++$count;
}

my @queries = split /,/,$QUERY;
foreach (@queries) {
    unless (exists $stat_map{$_}) {
        print "Unknown orca stat $_n";
        exit $RET_WARN;
    }
}

# read last line
while (<ORCA>) {
    $addr = tell (ORCA) unless eof (ORCA);
}
seek (ORCA, $addr, 0);
$line = <ORCA>;
chomp $line;
close ORCA or warn "close: $orca_log: $!";

my @stats = split /s+/, $line;

$count = 1;
foreach (@queries) {
    $values{"${count}_$_"} = $stats[$stat_map{$_}];
    ++$count;
}

foreach $sorted_key (sort keys %values) {
    $key = $sorted_key;
    $key =~ s/^d+_//;
    $ret .= qq($key $values{$sorted_key} );
    $stats .= qq('$key'=$values{$sorted_key} );
}

print "ORCA OK - $ret|$statsn";
exit 0;

sub usage () {
    print STDERR qq(usage: $0 -q "orcavalue,orcavalue,..."n);
}

/usr/local/nagios/share/pnp/templates/check_nrpe_solaris_orcallator_all.php

<?php
#
# display Orca counters. The file is in DS order, the actual graphs are displayed in
# $opt[]/$def[] order on the web page

$opt[10] = "--vertical-label "" -b 1000 --title "$hostname / TCP Attempt Fail Rate Per Sec"";
$ds_name[10] = "tcp_Atf_s";
$def[10] = "DEF:var1=$rrdfile:$DS[1]:AVERAGE " ;
$def[10] .= "AREA:var1#00cf00:"$NAME[1] " " ;
$def[10] .= "GPRINT:var1:LAST:"%7.2lf %S last" " ;
$def[10] .= "GPRINT:var1:AVERAGE:"%7.2lf %S avg" " ;
$def[10] .= "GPRINT:var1:MAX:"%7.2lf %S maxn" " ;

$opt[11] = "--vertical-label "" -b 1000 --title "$hostname / TCP Listen Drop Rate Per Sec"";
$ds_name[11] = "tcp_Ldrp_s,tcp_LdQ0_s,tcp_HOdp_s";
$def[11] = "DEF:var1=$rrdfile:$DS[2]:AVERAGE " ;
$def[11] .= "DEF:var2=$rrdfile:$DS[3]:AVERAGE " ;
$def[11] .= "DEF:var3=$rrdfile:$DS[4]:AVERAGE " ;
$def[11] .= "LINE:var1#00ff00:"$NAME[2] " " ;
$def[11] .= "GPRINT:var1:LAST:"%7.2lf %S last" " ;
$def[11] .= "GPRINT:var1:AVERAGE:"%7.2lf %S avg" " ;
$def[11] .= "GPRINT:var1:MAX:"%7.2lf %S maxn" " ;
$def[11] .= "LINE1:var2#ff0000:"$NAME[3] " " ;
$def[11] .= "GPRINT:var2:LAST:"%7.2lf %S last" " ;
$def[11] .= "GPRINT:var2:AVERAGE:"%7.2lf %S avg" " ;
$def[11] .= "GPRINT:var2:MAX:"%7.2lf %S maxn" ";
$def[11] .= "LINE2:var3#0000ff:"$NAME[4] " " ;
$def[11] .= "GPRINT:var3:LAST:"%7.2lf %S last" " ;
$def[11] .= "GPRINT:var3:AVERAGE:"%7.2lf %S avg" " ;
$def[11] .= "GPRINT:var3:MAX:"%7.2lf %S maxn" ";

$opt[9] = "--vertical-label "" -b 1000 --title "$hostname / Sleeps On Mutex Per Sec"";
$ds_name[9] = "smtx,smtx_cpu";
$def[9] = "DEF:var1=$rrdfile:$DS[5]:AVERAGE " ;
$def[9] .= "DEF:var2=$rrdfile:$DS[6]:AVERAGE " ;
$def[9] .= "AREA:var1#00cf00:"$NAME[5] " " ;
$def[9] .= "GPRINT:var1:LAST:"%8.2lf %S last" " ;
$def[9] .= "GPRINT:var1:AVERAGE:"%7.2lf %S avg" " ;
$def[9] .= "GPRINT:var1:MAX:"%7.2lf %S maxn" " ;
$def[9] .= "LINE1:var2#0000ff:"$NAME[6] " " ;
$def[9] .= "GPRINT:var2:LAST:"%3.2lf %S last" " ;
$def[9] .= "GPRINT:var2:AVERAGE:"%7.2lf %S avg" " ;
$def[9] .= "GPRINT:var2:MAX:"%7.2lf %S maxn" ";

$opt[4] = "--vertical-label "" -b 1000 --title "$hostname / Disk System-wide R/W Ops Per Sec"";
$ds_name[4] = "disk_rd_s,disk_wr_s";
$def[4] = "DEF:var1=$rrdfile:$DS[7]:AVERAGE " ;
$def[4] .= "DEF:var2=$rrdfile:$DS[8]:AVERAGE " ;
$def[4] .= "AREA:var1#00cf00:"$NAME[7] " " ;
$def[4] .= "GPRINT:var1:LAST:"%7.2lf %S last" " ;
$def[4] .= "GPRINT:var1:AVERAGE:"%7.2lf %S avg" " ;
$def[4] .= "GPRINT:var1:MAX:"%7.2lf %S maxn" " ;
$def[4] .= "LINE1:var2#0000ff:"$NAME[8] " " ;
$def[4] .= "GPRINT:var2:LAST:"%7.2lf %S last" " ;
$def[4] .= "GPRINT:var2:AVERAGE:"%7.2lf %S avg" " ;
$def[4] .= "GPRINT:var2:MAX:"%7.2lf %S maxn" ";

$opt[5] = "--vertical-label "" -b 1000 --title "$hostname / Disk System-wide R/W Transfer Rate KB
Per Sec"";
$ds_name[5] = "disk_rK_s,disk_wK_s";
$def[5] = "DEF:var1=$rrdfile:$DS[9]:AVERAGE " ;
$def[5] .= "DEF:var2=$rrdfile:$DS[10]:AVERAGE " ;
$def[5] .= "AREA:var1#00cf00:"$NAME[9] " " ;
$def[5] .= "GPRINT:var1:LAST:"%7.2lf %S last" " ;
$def[5] .= "GPRINT:var1:AVERAGE:"%7.2lf %S avg" " ;
$def[5] .= "GPRINT:var1:MAX:"%7.2lf %S maxn" " ;
$def[5] .= "LINE1:var2#0000ff:"$NAME[10] " " ;
$def[5] .= "GPRINT:var2:LAST:"%7.2lf %S last" " ;
$def[5] .= "GPRINT:var2:AVERAGE:"%7.2lf %S avg" " ;
$def[5] .= "GPRINT:var2:MAX:"%7.2lf %S maxn" ";

$opt[8] = "--vertical-label "" -b 1000 --title "$hostname / New Processes Per Sec"";
$ds_name[8] = "#proc_s";
$def[8] = "DEF:var1=$rrdfile:$DS[11]:AVERAGE " ;
$def[8] .= "AREA:var1#00cf00:"$NAME[11] " " ;
$def[8] .= "GPRINT:var1:LAST:"%7.2lf %S last" " ;
$def[8] .= "GPRINT:var1:AVERAGE:"%7.2lf %S avg" " ;
$def[8] .= "GPRINT:var1:MAX:"%7.2lf %S maxn" " ;

$opt[3] = "--vertical-label "" -b 1000 --title "$hostname / Disk Cache Refs Per Sec"";
$ds_name[3] = "dnlc_ref_s,inod_ref_s";
$def[3] = "DEF:var1=$rrdfile:$DS[12]:AVERAGE " ;
$def[3] .= "DEF:var2=$rrdfile:$DS[13]:AVERAGE " ;
$def[3] .= "AREA:var1#00cf00:"$NAME[12] " " ;
$def[3] .= "GPRINT:var1:LAST:"%7.2lf %S last" " ;
$def[3] .= "GPRINT:var1:AVERAGE:"%7.2lf %S avg" " ;
$def[3] .= "GPRINT:var1:MAX:"%7.2lf %S maxn" " ;
$def[3] .= "LINE1:var2#0000ff:"$NAME[13] " " ;
$def[3] .= "GPRINT:var2:LAST:"%7.2lf %S last" " ;
$def[3] .= "GPRINT:var2:AVERAGE:"%7.2lf %S avg" " ;
$def[3] .= "GPRINT:var2:MAX:"%7.2lf %S max" " ;

$opt[7] = "--vertical-label "" -b 1000 --title "$hostname / Memory Pages Scanned Per Sec"";
$ds_name[7] = "scanrate";
$def[7] = "DEF:var1=$rrdfile:$DS[14]:AVERAGE " ;
$def[7] .= "AREA:var1#00cf00:"$NAME[14] " " ;
$def[7] .= "GPRINT:var1:LAST:"%7.2lf %S last" " ;
$def[7] .= "GPRINT:var1:AVERAGE:"%7.2lf %S avg" " ;
$def[7] .= "GPRINT:var1:MAX:"%7.2lf %S maxn" " ;

$opt[6] = "--vertical-label "" -b 1000 --title "$hostname / Locked Memory Pages"";
$ds_name[6] = "pageslock";
$def[6] = "DEF:var1=$rrdfile:$DS[15]:AVERAGE " ;
$def[6] .= "AREA:var1#00cf00:"$NAME[15] " " ;
$def[6] .= "GPRINT:var1:LAST:"%7.2lf %S last" " ;
$def[6] .= "GPRINT:var1:AVERAGE:"%7.2lf %S avg" " ;
$def[6] .= "GPRINT:var1:MAX:"%7.2lf %S maxn" " ;

$opt[1] = "--lower-limit 0 --upper-limit 100 --rigid --vertical-label "" -b 1000
--title "$hostname / CPU"";
$ds_name[1] = "usr%,sys%,wio%,idle%";
$def[1] = "DEF:var1=$rrdfile:$DS[16]:AVERAGE " ;
$def[1] .= "DEF:var2=$rrdfile:$DS[17]:AVERAGE " ;
$def[1] .= "DEF:var3=$rrdfile:$DS[18]:AVERAGE " ;
$def[1] .= "DEF:var4=$rrdfile:$DS[19]:AVERAGE " ;
$def[1] .= "AREA:var1#0000ff:$NAME[16]:STACK ";
$def[1] .= "GPRINT:var1:LAST:"%3.1lf last" " ;
$def[1]   .=   "GPRINT:var1:AVERAGE:"%3.1lf avg" "   ;
$def[1]   .=   "GPRINT:var1:MAX:"%3.1lf max" " ;
$def[1]   .=   "AREA:var2#ff0000:$NAME[17]:STACK ";
$def[1]   .=   "GPRINT:var2:LAST:"%3.1lf last" " ;
$def[1]   .=   "GPRINT:var2:AVERAGE:"%3.1lf avg" "   ;
$def[1]   .=   "GPRINT:var2:MAX:"%3.1lf maxn" ";
$def[1]   .=   "AREA:var3#8b00cc:$NAME[18]:STACK ";
$def[1]   .=   "GPRINT:var3:LAST:"%3.1lf last" " ;
$def[1]   .=   "GPRINT:var3:AVERAGE:"%3.1lf avg" "   ;
$def[1]   .=   "GPRINT:var3:MAX:"%3.1lf max" ";
$def[1]   .=   "AREA:var4#00cf00:$NAME[19]:STACK ";
$def[1]   .=   "GPRINT:var4:LAST:"%3.1lf last" " ;
$def[1]   .=   "GPRINT:var4:AVERAGE:"%3.1lf avg" "   ;
$def[1]   .=   "GPRINT:var4:MAX:"%3.1lf maxn" ";

$opt[12] = "--vertical-label "" -b 1000 --title "$hostname / TCP Connections Per Sec"";
$ds_name[12] = "tcp_Icn_s,tcp_Ocn_s";
$def[12] = "DEF:var1=$rrdfile:$DS[20]:AVERAGE " ;
$def[12] .= "DEF:var2=$rrdfile:$DS[21]:AVERAGE " ;
$def[12] .= "AREA:var1#00cf00:"$NAME[20] " " ;
$def[12] .= "GPRINT:var1:LAST:"%7.2lf %S last" " ;
$def[12] .= "GPRINT:var1:AVERAGE:"%7.2lf %S avg" " ;
$def[12] .= "GPRINT:var1:MAX:"%7.2lf %S maxn" " ;
$def[12] .= "LINE1:var2#0000ff:"$NAME[21] " " ;
$def[12] .= "GPRINT:var2:LAST:"%7.2lf %S last" " ;
$def[12] .= "GPRINT:var2:AVERAGE:"%7.2lf %S avg" " ;
$def[12] .= "GPRINT:var2:MAX:"%7.2lf %S max" " ;

$opt[2] = "--vertical-label "" -b 1000 --title "$hostname / Disk Cache Utilization"";
$ds_name[2] = "dnlc_hit%,inod_hit%";
$def[2] = "DEF:var1=$rrdfile:$DS[22]:AVERAGE " ;
$def[2] .= "DEF:var2=$rrdfile:$DS[23]:AVERAGE " ;
$def[2] .= "AREA:var1#00cf00:"$NAME[22] " " ;
$def[2] .= "GPRINT:var1:LAST:"%7.2lf %S last" " ;
$def[2] .= "GPRINT:var1:AVERAGE:"%7.2lf %S avg" " ;
$def[2] .= "GPRINT:var1:MAX:"%7.2lf %S maxn" " ;
$def[2] .= "LINE1:var2#0000ff:"$NAME[23] " " ;
$def[2] .= "GPRINT:var2:LAST:"%7.2lf %S last" " ;
$def[2] .= "GPRINT:var2:AVERAGE:"%7.2lf %S avg" " ;
$def[2] .= "GPRINT:var2:MAX:"%7.2lf %S max" " ;

$opt[15] = "--vertical-label "" -b 1000 --title "$hostname / TCP Retrans & Dupes"";
$ds_name[15] = "tcp_Ret%,tcp_Dup%";
$def[15] = "DEF:var1=$rrdfile:$DS[24]:AVERAGE " ;
$def[15] .= "DEF:var2=$rrdfile:$DS[25]:AVERAGE " ;
$def[15] .= "AREA:var1#00cf00:"$NAME[24] " " ;
$def[15] .= "GPRINT:var1:LAST:"%7.2lf %S last" " ;
$def[15] .= "GPRINT:var1:AVERAGE:"%7.2lf %S avg" " ;
$def[15] .= "GPRINT:var1:MAX:"%7.2lf %S maxn" " ;
$def[15] .= "LINE1:var2#0000ff:"$NAME[25] " " ;
$def[15] .= "GPRINT:var2:LAST:"%7.2lf %S last" " ;
$def[15] .= "GPRINT:var2:AVERAGE:"%7.2lf %S avg" " ;
$def[15] .= "GPRINT:var2:MAX:"%7.2lf %S max" " ;

$opt[13] = "--vertical-label "" -b 1000 --title "$hostname / TCP Established Connections"";
$ds_name[13] = "tcp_estb";
$def[13] = "DEF:var1=$rrdfile:$DS[26]:AVERAGE " ;
$def[13] .= "AREA:var1#00cf00:"$NAME[26] " " ;
$def[13] .= "GPRINT:var1:LAST:"%7.2lf %S last" " ;
$def[13] .= "GPRINT:var1:AVERAGE:"%7.2lf %S avg" " ;
$def[13] .= "GPRINT:var1:MAX:"%7.2lf %S maxn" " ;

$opt[14] = "--vertical-label "" -b 1000 --title "$hostname / TCP Resets Per Sec"";
$ds_name[14] = "tcp_Rst_s";
$def[14] = "DEF:var1=$rrdfile:$DS[27]:AVERAGE " ;
$def[14] .= "AREA:var1#00cf00:"$NAME[27] " " ;
$def[14] .= "GPRINT:var1:LAST:"%7.2lf %S last" " ;
$def[14] .= "GPRINT:var1:AVERAGE:"%7.2lf %S avg" " ;
$def[14] .= "GPRINT:var1:MAX:"%7.2lf %S maxn" " ;
?>

Más contenido relacionado

La actualidad más candente

Logs/Metrics Gathering With OpenShift EFK Stack
Logs/Metrics Gathering With OpenShift EFK StackLogs/Metrics Gathering With OpenShift EFK Stack
Logs/Metrics Gathering With OpenShift EFK StackJosef Karásek
 
vpn-site-a-site-avec-des-routeurs-cisco
 vpn-site-a-site-avec-des-routeurs-cisco vpn-site-a-site-avec-des-routeurs-cisco
vpn-site-a-site-avec-des-routeurs-ciscoCamara Assane
 
Présentation de nagios
Présentation de nagiosPrésentation de nagios
Présentation de nagiosilyassin
 
Docker Networking with New Ipvlan and Macvlan Drivers
Docker Networking with New Ipvlan and Macvlan DriversDocker Networking with New Ipvlan and Macvlan Drivers
Docker Networking with New Ipvlan and Macvlan DriversBrent Salisbury
 
Alphorm.com formation-GNS3
Alphorm.com formation-GNS3Alphorm.com formation-GNS3
Alphorm.com formation-GNS3Alphorm
 
pfSense presentation
pfSense presentationpfSense presentation
pfSense presentationSimon Vass
 
66 pfsense tutorial
66 pfsense tutorial66 pfsense tutorial
66 pfsense tutorialequinonesr
 
Admin reseaux sous linux cours 3
Admin reseaux sous linux   cours 3Admin reseaux sous linux   cours 3
Admin reseaux sous linux cours 3Stephen Salama
 
Nginx A High Performance Load Balancer, Web Server & Reverse Proxy
Nginx A High Performance Load Balancer, Web Server & Reverse ProxyNginx A High Performance Load Balancer, Web Server & Reverse Proxy
Nginx A High Performance Load Balancer, Web Server & Reverse ProxyAmit Aggarwal
 
Kvm performance optimization for ubuntu
Kvm performance optimization for ubuntuKvm performance optimization for ubuntu
Kvm performance optimization for ubuntuSim Janghoon
 
Load Balancing and Scaling with NGINX
Load Balancing and Scaling with NGINXLoad Balancing and Scaling with NGINX
Load Balancing and Scaling with NGINXNGINX, Inc.
 
Tài Liệu Cấu Hình forti os v6.0 ( FORTINET )
 Tài Liệu Cấu Hình forti os v6.0 ( FORTINET ) Tài Liệu Cấu Hình forti os v6.0 ( FORTINET )
Tài Liệu Cấu Hình forti os v6.0 ( FORTINET )CamQueVuong
 
alphorm.com - Formation Linux LPIC-1/Comptia Linux+
alphorm.com - Formation Linux LPIC-1/Comptia Linux+alphorm.com - Formation Linux LPIC-1/Comptia Linux+
alphorm.com - Formation Linux LPIC-1/Comptia Linux+Alphorm
 
MariaDB Performance Tuning Crash Course
MariaDB Performance Tuning Crash CourseMariaDB Performance Tuning Crash Course
MariaDB Performance Tuning Crash CourseSeveralnines
 
Room 1 - 2 - Nguyễn Văn Thắng & Dzung Nguyen - Proxmox VE và ZFS over iscsi
Room 1 - 2 - Nguyễn Văn Thắng & Dzung Nguyen - Proxmox VE và ZFS over iscsiRoom 1 - 2 - Nguyễn Văn Thắng & Dzung Nguyen - Proxmox VE và ZFS over iscsi
Room 1 - 2 - Nguyễn Văn Thắng & Dzung Nguyen - Proxmox VE và ZFS over iscsiVietnam Open Infrastructure User Group
 
2017 red hat open stack(rhosp) function overview (samuel,2017-0516)
2017 red hat open stack(rhosp) function overview (samuel,2017-0516)2017 red hat open stack(rhosp) function overview (samuel,2017-0516)
2017 red hat open stack(rhosp) function overview (samuel,2017-0516)SAMUEL SJ Cheon
 

La actualidad más candente (20)

Logs/Metrics Gathering With OpenShift EFK Stack
Logs/Metrics Gathering With OpenShift EFK StackLogs/Metrics Gathering With OpenShift EFK Stack
Logs/Metrics Gathering With OpenShift EFK Stack
 
vpn-site-a-site-avec-des-routeurs-cisco
 vpn-site-a-site-avec-des-routeurs-cisco vpn-site-a-site-avec-des-routeurs-cisco
vpn-site-a-site-avec-des-routeurs-cisco
 
Présentation de nagios
Présentation de nagiosPrésentation de nagios
Présentation de nagios
 
Docker Networking with New Ipvlan and Macvlan Drivers
Docker Networking with New Ipvlan and Macvlan DriversDocker Networking with New Ipvlan and Macvlan Drivers
Docker Networking with New Ipvlan and Macvlan Drivers
 
PostgreSQL and RAM usage
PostgreSQL and RAM usagePostgreSQL and RAM usage
PostgreSQL and RAM usage
 
Alphorm.com formation-GNS3
Alphorm.com formation-GNS3Alphorm.com formation-GNS3
Alphorm.com formation-GNS3
 
OpenNMS
OpenNMSOpenNMS
OpenNMS
 
pfSense presentation
pfSense presentationpfSense presentation
pfSense presentation
 
66 pfsense tutorial
66 pfsense tutorial66 pfsense tutorial
66 pfsense tutorial
 
Admin reseaux sous linux cours 3
Admin reseaux sous linux   cours 3Admin reseaux sous linux   cours 3
Admin reseaux sous linux cours 3
 
Nginx A High Performance Load Balancer, Web Server & Reverse Proxy
Nginx A High Performance Load Balancer, Web Server & Reverse ProxyNginx A High Performance Load Balancer, Web Server & Reverse Proxy
Nginx A High Performance Load Balancer, Web Server & Reverse Proxy
 
Kvm performance optimization for ubuntu
Kvm performance optimization for ubuntuKvm performance optimization for ubuntu
Kvm performance optimization for ubuntu
 
Automating with Ansible
Automating with AnsibleAutomating with Ansible
Automating with Ansible
 
Load Balancing and Scaling with NGINX
Load Balancing and Scaling with NGINXLoad Balancing and Scaling with NGINX
Load Balancing and Scaling with NGINX
 
Tài Liệu Cấu Hình forti os v6.0 ( FORTINET )
 Tài Liệu Cấu Hình forti os v6.0 ( FORTINET ) Tài Liệu Cấu Hình forti os v6.0 ( FORTINET )
Tài Liệu Cấu Hình forti os v6.0 ( FORTINET )
 
alphorm.com - Formation Linux LPIC-1/Comptia Linux+
alphorm.com - Formation Linux LPIC-1/Comptia Linux+alphorm.com - Formation Linux LPIC-1/Comptia Linux+
alphorm.com - Formation Linux LPIC-1/Comptia Linux+
 
MariaDB Performance Tuning Crash Course
MariaDB Performance Tuning Crash CourseMariaDB Performance Tuning Crash Course
MariaDB Performance Tuning Crash Course
 
Room 1 - 2 - Nguyễn Văn Thắng & Dzung Nguyen - Proxmox VE và ZFS over iscsi
Room 1 - 2 - Nguyễn Văn Thắng & Dzung Nguyen - Proxmox VE và ZFS over iscsiRoom 1 - 2 - Nguyễn Văn Thắng & Dzung Nguyen - Proxmox VE và ZFS over iscsi
Room 1 - 2 - Nguyễn Văn Thắng & Dzung Nguyen - Proxmox VE và ZFS over iscsi
 
2017 red hat open stack(rhosp) function overview (samuel,2017-0516)
2017 red hat open stack(rhosp) function overview (samuel,2017-0516)2017 red hat open stack(rhosp) function overview (samuel,2017-0516)
2017 red hat open stack(rhosp) function overview (samuel,2017-0516)
 
Meetup 23 - 02 - OVN - The future of networking in OpenStack
Meetup 23 - 02 - OVN - The future of networking in OpenStackMeetup 23 - 02 - OVN - The future of networking in OpenStack
Meetup 23 - 02 - OVN - The future of networking in OpenStack
 

Similar a Graphing Nagios services with pnp4nagios

02 Hadoop deployment and configuration
02 Hadoop deployment and configuration02 Hadoop deployment and configuration
02 Hadoop deployment and configurationSubhas Kumar Ghosh
 
Lamp Server With Drupal Installation
Lamp Server With Drupal InstallationLamp Server With Drupal Installation
Lamp Server With Drupal Installationfranbow
 
Configure h base hadoop and hbase client
Configure h base hadoop and hbase clientConfigure h base hadoop and hbase client
Configure h base hadoop and hbase clientShashwat Shriparv
 
[MathWorks] Versioning Infrastructure
[MathWorks] Versioning Infrastructure[MathWorks] Versioning Infrastructure
[MathWorks] Versioning InfrastructurePerforce
 
Nagios Conference 2012 - Mike Weber - NRPE
Nagios Conference 2012 - Mike Weber - NRPENagios Conference 2012 - Mike Weber - NRPE
Nagios Conference 2012 - Mike Weber - NRPENagios
 
Docker for mac & local developer environment optimization
Docker for mac & local developer environment optimizationDocker for mac & local developer environment optimization
Docker for mac & local developer environment optimizationRadek Baczynski
 
Nagios Conference 2014 - Mike Weber - Expanding NRDS Capabilities on Linux Sy...
Nagios Conference 2014 - Mike Weber - Expanding NRDS Capabilities on Linux Sy...Nagios Conference 2014 - Mike Weber - Expanding NRDS Capabilities on Linux Sy...
Nagios Conference 2014 - Mike Weber - Expanding NRDS Capabilities on Linux Sy...Nagios
 
Free radius billing server with practical vpn exmaple
Free radius billing server with practical vpn exmapleFree radius billing server with practical vpn exmaple
Free radius billing server with practical vpn exmapleChanaka Lasantha
 
Linux networking
Linux networkingLinux networking
Linux networkingsanakiyan
 
Linux Server Deep Dives (DrupalCon Amsterdam)
Linux Server Deep Dives (DrupalCon Amsterdam)Linux Server Deep Dives (DrupalCon Amsterdam)
Linux Server Deep Dives (DrupalCon Amsterdam)Amin Astaneh
 
Using R on High Performance Computers
Using R on High Performance ComputersUsing R on High Performance Computers
Using R on High Performance ComputersDave Hiltbrand
 
Tutorial CentOS 5 untuk Webhosting
Tutorial CentOS 5 untuk WebhostingTutorial CentOS 5 untuk Webhosting
Tutorial CentOS 5 untuk WebhostingBeni Krisbiantoro
 
Nrpe - Nagios Remote Plugin Executor. NRPE plugin for Nagios Core
Nrpe - Nagios Remote Plugin Executor. NRPE plugin for Nagios CoreNrpe - Nagios Remote Plugin Executor. NRPE plugin for Nagios Core
Nrpe - Nagios Remote Plugin Executor. NRPE plugin for Nagios CoreNagios
 
NRPE - Nagios Remote Plugin Executor. NRPE plugin for Nagios Core 4 and others.
NRPE - Nagios Remote Plugin Executor. NRPE plugin for Nagios Core 4 and others.NRPE - Nagios Remote Plugin Executor. NRPE plugin for Nagios Core 4 and others.
NRPE - Nagios Remote Plugin Executor. NRPE plugin for Nagios Core 4 and others.Marc Trimble
 
NFS is an excellent way of sharing files between linux and other unix systems
NFS is an excellent way of sharing files between linux and other unix systemsNFS is an excellent way of sharing files between linux and other unix systems
NFS is an excellent way of sharing files between linux and other unix systemsAshish Mamgain
 

Similar a Graphing Nagios services with pnp4nagios (20)

02 Hadoop deployment and configuration
02 Hadoop deployment and configuration02 Hadoop deployment and configuration
02 Hadoop deployment and configuration
 
Lamp Server With Drupal Installation
Lamp Server With Drupal InstallationLamp Server With Drupal Installation
Lamp Server With Drupal Installation
 
linux installation.pdf
linux installation.pdflinux installation.pdf
linux installation.pdf
 
Configure h base hadoop and hbase client
Configure h base hadoop and hbase clientConfigure h base hadoop and hbase client
Configure h base hadoop and hbase client
 
Rac on NFS
Rac on NFSRac on NFS
Rac on NFS
 
[MathWorks] Versioning Infrastructure
[MathWorks] Versioning Infrastructure[MathWorks] Versioning Infrastructure
[MathWorks] Versioning Infrastructure
 
Nagios Conference 2012 - Mike Weber - NRPE
Nagios Conference 2012 - Mike Weber - NRPENagios Conference 2012 - Mike Weber - NRPE
Nagios Conference 2012 - Mike Weber - NRPE
 
Docker for mac & local developer environment optimization
Docker for mac & local developer environment optimizationDocker for mac & local developer environment optimization
Docker for mac & local developer environment optimization
 
Nagios Conference 2014 - Mike Weber - Expanding NRDS Capabilities on Linux Sy...
Nagios Conference 2014 - Mike Weber - Expanding NRDS Capabilities on Linux Sy...Nagios Conference 2014 - Mike Weber - Expanding NRDS Capabilities on Linux Sy...
Nagios Conference 2014 - Mike Weber - Expanding NRDS Capabilities on Linux Sy...
 
Its3 Drupal
Its3 DrupalIts3 Drupal
Its3 Drupal
 
Its3 Drupal
Its3 DrupalIts3 Drupal
Its3 Drupal
 
Free radius billing server with practical vpn exmaple
Free radius billing server with practical vpn exmapleFree radius billing server with practical vpn exmaple
Free radius billing server with practical vpn exmaple
 
Linux networking
Linux networkingLinux networking
Linux networking
 
Linux Server Deep Dives (DrupalCon Amsterdam)
Linux Server Deep Dives (DrupalCon Amsterdam)Linux Server Deep Dives (DrupalCon Amsterdam)
Linux Server Deep Dives (DrupalCon Amsterdam)
 
Using R on High Performance Computers
Using R on High Performance ComputersUsing R on High Performance Computers
Using R on High Performance Computers
 
Tutorial CentOS 5 untuk Webhosting
Tutorial CentOS 5 untuk WebhostingTutorial CentOS 5 untuk Webhosting
Tutorial CentOS 5 untuk Webhosting
 
Dhcp
DhcpDhcp
Dhcp
 
Nrpe - Nagios Remote Plugin Executor. NRPE plugin for Nagios Core
Nrpe - Nagios Remote Plugin Executor. NRPE plugin for Nagios CoreNrpe - Nagios Remote Plugin Executor. NRPE plugin for Nagios Core
Nrpe - Nagios Remote Plugin Executor. NRPE plugin for Nagios Core
 
NRPE - Nagios Remote Plugin Executor. NRPE plugin for Nagios Core 4 and others.
NRPE - Nagios Remote Plugin Executor. NRPE plugin for Nagios Core 4 and others.NRPE - Nagios Remote Plugin Executor. NRPE plugin for Nagios Core 4 and others.
NRPE - Nagios Remote Plugin Executor. NRPE plugin for Nagios Core 4 and others.
 
NFS is an excellent way of sharing files between linux and other unix systems
NFS is an excellent way of sharing files between linux and other unix systemsNFS is an excellent way of sharing files between linux and other unix systems
NFS is an excellent way of sharing files between linux and other unix systems
 

Último

Scaling API-first – The story of a global engineering organization
Scaling API-first – The story of a global engineering organizationScaling API-first – The story of a global engineering organization
Scaling API-first – The story of a global engineering organizationRadu Cotescu
 
Apidays New York 2024 - Scaling API-first by Ian Reasor and Radu Cotescu, Adobe
Apidays New York 2024 - Scaling API-first by Ian Reasor and Radu Cotescu, AdobeApidays New York 2024 - Scaling API-first by Ian Reasor and Radu Cotescu, Adobe
Apidays New York 2024 - Scaling API-first by Ian Reasor and Radu Cotescu, Adobeapidays
 
TrustArc Webinar - Stay Ahead of US State Data Privacy Law Developments
TrustArc Webinar - Stay Ahead of US State Data Privacy Law DevelopmentsTrustArc Webinar - Stay Ahead of US State Data Privacy Law Developments
TrustArc Webinar - Stay Ahead of US State Data Privacy Law DevelopmentsTrustArc
 
Strategies for Unlocking Knowledge Management in Microsoft 365 in the Copilot...
Strategies for Unlocking Knowledge Management in Microsoft 365 in the Copilot...Strategies for Unlocking Knowledge Management in Microsoft 365 in the Copilot...
Strategies for Unlocking Knowledge Management in Microsoft 365 in the Copilot...Drew Madelung
 
Axa Assurance Maroc - Insurer Innovation Award 2024
Axa Assurance Maroc - Insurer Innovation Award 2024Axa Assurance Maroc - Insurer Innovation Award 2024
Axa Assurance Maroc - Insurer Innovation Award 2024The Digital Insurer
 
presentation ICT roal in 21st century education
presentation ICT roal in 21st century educationpresentation ICT roal in 21st century education
presentation ICT roal in 21st century educationjfdjdjcjdnsjd
 
Driving Behavioral Change for Information Management through Data-Driven Gree...
Driving Behavioral Change for Information Management through Data-Driven Gree...Driving Behavioral Change for Information Management through Data-Driven Gree...
Driving Behavioral Change for Information Management through Data-Driven Gree...Enterprise Knowledge
 
Boost PC performance: How more available memory can improve productivity
Boost PC performance: How more available memory can improve productivityBoost PC performance: How more available memory can improve productivity
Boost PC performance: How more available memory can improve productivityPrincipled Technologies
 
Artificial Intelligence: Facts and Myths
Artificial Intelligence: Facts and MythsArtificial Intelligence: Facts and Myths
Artificial Intelligence: Facts and MythsJoaquim Jorge
 
A Year of the Servo Reboot: Where Are We Now?
A Year of the Servo Reboot: Where Are We Now?A Year of the Servo Reboot: Where Are We Now?
A Year of the Servo Reboot: Where Are We Now?Igalia
 
Apidays Singapore 2024 - Building Digital Trust in a Digital Economy by Veron...
Apidays Singapore 2024 - Building Digital Trust in a Digital Economy by Veron...Apidays Singapore 2024 - Building Digital Trust in a Digital Economy by Veron...
Apidays Singapore 2024 - Building Digital Trust in a Digital Economy by Veron...apidays
 
Automating Google Workspace (GWS) & more with Apps Script
Automating Google Workspace (GWS) & more with Apps ScriptAutomating Google Workspace (GWS) & more with Apps Script
Automating Google Workspace (GWS) & more with Apps Scriptwesley chun
 
Advantages of Hiring UIUX Design Service Providers for Your Business
Advantages of Hiring UIUX Design Service Providers for Your BusinessAdvantages of Hiring UIUX Design Service Providers for Your Business
Advantages of Hiring UIUX Design Service Providers for Your BusinessPixlogix Infotech
 
How to Troubleshoot Apps for the Modern Connected Worker
How to Troubleshoot Apps for the Modern Connected WorkerHow to Troubleshoot Apps for the Modern Connected Worker
How to Troubleshoot Apps for the Modern Connected WorkerThousandEyes
 
Histor y of HAM Radio presentation slide
Histor y of HAM Radio presentation slideHistor y of HAM Radio presentation slide
Histor y of HAM Radio presentation slidevu2urc
 
Strategize a Smooth Tenant-to-tenant Migration and Copilot Takeoff
Strategize a Smooth Tenant-to-tenant Migration and Copilot TakeoffStrategize a Smooth Tenant-to-tenant Migration and Copilot Takeoff
Strategize a Smooth Tenant-to-tenant Migration and Copilot Takeoffsammart93
 
The 7 Things I Know About Cyber Security After 25 Years | April 2024
The 7 Things I Know About Cyber Security After 25 Years | April 2024The 7 Things I Know About Cyber Security After 25 Years | April 2024
The 7 Things I Know About Cyber Security After 25 Years | April 2024Rafal Los
 
Strategies for Landing an Oracle DBA Job as a Fresher
Strategies for Landing an Oracle DBA Job as a FresherStrategies for Landing an Oracle DBA Job as a Fresher
Strategies for Landing an Oracle DBA Job as a FresherRemote DBA Services
 
From Event to Action: Accelerate Your Decision Making with Real-Time Automation
From Event to Action: Accelerate Your Decision Making with Real-Time AutomationFrom Event to Action: Accelerate Your Decision Making with Real-Time Automation
From Event to Action: Accelerate Your Decision Making with Real-Time AutomationSafe Software
 

Último (20)

Scaling API-first – The story of a global engineering organization
Scaling API-first – The story of a global engineering organizationScaling API-first – The story of a global engineering organization
Scaling API-first – The story of a global engineering organization
 
Apidays New York 2024 - Scaling API-first by Ian Reasor and Radu Cotescu, Adobe
Apidays New York 2024 - Scaling API-first by Ian Reasor and Radu Cotescu, AdobeApidays New York 2024 - Scaling API-first by Ian Reasor and Radu Cotescu, Adobe
Apidays New York 2024 - Scaling API-first by Ian Reasor and Radu Cotescu, Adobe
 
TrustArc Webinar - Stay Ahead of US State Data Privacy Law Developments
TrustArc Webinar - Stay Ahead of US State Data Privacy Law DevelopmentsTrustArc Webinar - Stay Ahead of US State Data Privacy Law Developments
TrustArc Webinar - Stay Ahead of US State Data Privacy Law Developments
 
Strategies for Unlocking Knowledge Management in Microsoft 365 in the Copilot...
Strategies for Unlocking Knowledge Management in Microsoft 365 in the Copilot...Strategies for Unlocking Knowledge Management in Microsoft 365 in the Copilot...
Strategies for Unlocking Knowledge Management in Microsoft 365 in the Copilot...
 
Axa Assurance Maroc - Insurer Innovation Award 2024
Axa Assurance Maroc - Insurer Innovation Award 2024Axa Assurance Maroc - Insurer Innovation Award 2024
Axa Assurance Maroc - Insurer Innovation Award 2024
 
presentation ICT roal in 21st century education
presentation ICT roal in 21st century educationpresentation ICT roal in 21st century education
presentation ICT roal in 21st century education
 
Driving Behavioral Change for Information Management through Data-Driven Gree...
Driving Behavioral Change for Information Management through Data-Driven Gree...Driving Behavioral Change for Information Management through Data-Driven Gree...
Driving Behavioral Change for Information Management through Data-Driven Gree...
 
Boost PC performance: How more available memory can improve productivity
Boost PC performance: How more available memory can improve productivityBoost PC performance: How more available memory can improve productivity
Boost PC performance: How more available memory can improve productivity
 
Artificial Intelligence: Facts and Myths
Artificial Intelligence: Facts and MythsArtificial Intelligence: Facts and Myths
Artificial Intelligence: Facts and Myths
 
A Year of the Servo Reboot: Where Are We Now?
A Year of the Servo Reboot: Where Are We Now?A Year of the Servo Reboot: Where Are We Now?
A Year of the Servo Reboot: Where Are We Now?
 
Apidays Singapore 2024 - Building Digital Trust in a Digital Economy by Veron...
Apidays Singapore 2024 - Building Digital Trust in a Digital Economy by Veron...Apidays Singapore 2024 - Building Digital Trust in a Digital Economy by Veron...
Apidays Singapore 2024 - Building Digital Trust in a Digital Economy by Veron...
 
Automating Google Workspace (GWS) & more with Apps Script
Automating Google Workspace (GWS) & more with Apps ScriptAutomating Google Workspace (GWS) & more with Apps Script
Automating Google Workspace (GWS) & more with Apps Script
 
Advantages of Hiring UIUX Design Service Providers for Your Business
Advantages of Hiring UIUX Design Service Providers for Your BusinessAdvantages of Hiring UIUX Design Service Providers for Your Business
Advantages of Hiring UIUX Design Service Providers for Your Business
 
How to Troubleshoot Apps for the Modern Connected Worker
How to Troubleshoot Apps for the Modern Connected WorkerHow to Troubleshoot Apps for the Modern Connected Worker
How to Troubleshoot Apps for the Modern Connected Worker
 
Histor y of HAM Radio presentation slide
Histor y of HAM Radio presentation slideHistor y of HAM Radio presentation slide
Histor y of HAM Radio presentation slide
 
Strategize a Smooth Tenant-to-tenant Migration and Copilot Takeoff
Strategize a Smooth Tenant-to-tenant Migration and Copilot TakeoffStrategize a Smooth Tenant-to-tenant Migration and Copilot Takeoff
Strategize a Smooth Tenant-to-tenant Migration and Copilot Takeoff
 
The 7 Things I Know About Cyber Security After 25 Years | April 2024
The 7 Things I Know About Cyber Security After 25 Years | April 2024The 7 Things I Know About Cyber Security After 25 Years | April 2024
The 7 Things I Know About Cyber Security After 25 Years | April 2024
 
Strategies for Landing an Oracle DBA Job as a Fresher
Strategies for Landing an Oracle DBA Job as a FresherStrategies for Landing an Oracle DBA Job as a Fresher
Strategies for Landing an Oracle DBA Job as a Fresher
 
From Event to Action: Accelerate Your Decision Making with Real-Time Automation
From Event to Action: Accelerate Your Decision Making with Real-Time AutomationFrom Event to Action: Accelerate Your Decision Making with Real-Time Automation
From Event to Action: Accelerate Your Decision Making with Real-Time Automation
 
+971581248768>> SAFE AND ORIGINAL ABORTION PILLS FOR SALE IN DUBAI AND ABUDHA...
+971581248768>> SAFE AND ORIGINAL ABORTION PILLS FOR SALE IN DUBAI AND ABUDHA...+971581248768>> SAFE AND ORIGINAL ABORTION PILLS FOR SALE IN DUBAI AND ABUDHA...
+971581248768>> SAFE AND ORIGINAL ABORTION PILLS FOR SALE IN DUBAI AND ABUDHA...
 

Graphing Nagios services with pnp4nagios

  • 1. Graphing Nagios services with pnp4nagios Jason Holtzapple (jason@bitflip.net) Nagios is a popular open source computer system and network monitoring software application. It watches hosts and services, alerting users when things go wrong and again when they get better. Some of the major features of Nagios are: • Over 50 bundled plugins for checking common protocols and services (HTTP, FTP, disk space, S.M.A.R.T., lmsensors, etc). Hundreds of other monitoring plugins are available at nagios- exchange.org • Simple API allows plugin creation in any language supported by OS • Supports many different reports such as availability, alert histograms and top alerts. • Support for distributed monitoring and clustered configurations pnp4nagios is a framework written in perl, PHP and C for automatically parsing performance data collected by Nagios plugins. The data is collected into RRD databases for display in the Nagios web interface. The graphs created by pnp4nagios are similar to other monitoring tools like Cacti: pnp4nagios is designed to work well with the standard Nagios plugins and create useable graphs right out of the box. The appearance of the graphs can be customized. Pages of related graphs (for instance, CPU usage or TCP connections of each server in a web farm) can be easily defined and displayed in HTML or exported to PDF. Because Nagios does not perform checks while performance data is being processed all processing can be offloaded to the npcd daemon for large installations. pnp4nagios requires perl, PHP (built with XML, zlib and GD support) and rrdtool. It can optionally use the rrd perl modules for better performance. Pre-built Fedora packages are available and a Debian package is planned. Our example will use Ubuntu Server 8.10 with the bundled perl, PHP and Apache packages. Nagios has been installed from source in the default location of /usr/local/nagios.
  • 2. Installing pnp4nagios You use the typical configure/make/make install to install pnp4nagios: jth@ubuntu:~/pnp-0.4.13$ ./configure checking for a BSD-compatible install... /usr/bin/install -c checking build system type... i686-pc-linux-gnu checking host system type... i686-pc-linux-gnu … *** Configuration summary for pnp 0.4.13 02-19-2009 *** General Options: ------------------------- ------------------- Nagios user/group: nagios nagios Install directory: /usr/local/nagios HTML Dir: /usr/local/nagios/share/pnp Config Dir: /usr/local/nagios/etc/pnp Path to rrdtool: /usr/bin/rrdtool (Version 1.2.27) RRDs Perl Modules: FOUND (Version 1.2027) RRD Files stored in: /usr/local/nagios/share/perfdata process_perfdata.pl Logfile: /usr/local/nagios/var/perfdata.log Perfdata files (NPCD) stored in: /usr/local/nagios/var/spool/perfdata/ jth@ubuntu:~/pnp-0.4.13$ make all ... jth@ubuntu:~/pnp-0.4.13$ sudo make install cd ./src && make install make[1]: Entering directory `/home/jth/pnp-0.4.13/src' ... *** Main program, Scripts and HTML files installed *** Please run 'make install-config' to install sample configuration files jth@ubuntu:~/pnp-0.4.13$ sudo make install-config cd ./sample-config && make install-config make[1]: Entering directory `/home/jth/pnp-0.4.13/sample-config' rm -f /usr/local/nagios/share/pnp/conf/config.php /usr/bin/install -c -m 755 -o nagios -g nagios -d /usr/local/nagios/etc/pnp ...
  • 3. Configuring pnp4nagios The main configuration files for pnp4nagios are located in /usr/local/nagios/share/pnp (web frontend and graph options) and /usr/local/nagios/etc/pnp (global options – tool paths, access control, etc) Before configuring pnp, we need to decide how we want Nagios to process the performance data. This largely depends on the number of monitored hosts and services of Nagios. • Default mode, where process_perfdata.pl is executed after each host and service check, is acceptable for small installations. • Bulk mode, where performance information is appended to a temporary file and processed after a short interval, is fine for medium-sized installations. • Setups with hundreds of hosts and services should use bulk mode with npcd, where a separate multi-threaded daemon handles the processing. Our example will use Bulk mode, but it is possible to switch between modes as your Nagios setup grows. Edit the performance data section of /usr/local/nagios/etc/nagios.cfg: # PROCESS PERFORMANCE DATA OPTION # This determines whether or not Nagios will process performance # data returned from service and host checks. If this option is # enabled, host performance data will be processed using the # host_perfdata_command (defined below) and service performance # data will be processed using the service_perfdata_command (also # defined below). Read the HTML docs for more information on # performance data. # Values: 1 = process performance data, 0 = do not process performance data process_performance_data=1 # HOST AND SERVICE PERFORMANCE DATA PROCESSING COMMANDS # These commands are run after every host and service check is # performed. These commands are executed only if the # enable_performance_data option (above) is set to 1. The command # argument is the short name of a command definition that you # define in your host configuration file. Read the HTML docs for # more information on performance data. #host_perfdata_command=process-host-perfdata #service_perfdata_command=process-service-perfdata # HOST AND SERVICE PERFORMANCE DATA FILES # These files are used to store host and service performance data. # Performance data is only written to these files if the # enable_performance_data option (above) is set to 1. host_perfdata_file=/usr/local/nagios/var/host-perfdata service_perfdata_file=/usr/local/nagios/var/service-perfdata # HOST AND SERVICE PERFORMANCE DATA FILE TEMPLATES # These options determine what data is written (and how) to the # performance data files. The templates may contain macros, special # characters (t for tab, r for carriage return, n for newline) # and plain text. A newline is automatically added after each write # to the performance data file. Some examples of what you can do are # shown below.
  • 4. host_perfdata_file_template=DATATYPE::HOSTPERFDATAtTIMET::$TIMET$tHOSTNAME::$H OSTNAME$tHOSTPERFDATA::$HOSTPERFDATA$tHOSTCHECKCOMMAND::$HOSTCHECKCOMMAND$tHO STSTATE::$HOSTSTATE$tHOSTSTATETYPE::$HOSTSTATETYPE$tHOSTOUTPUT::$HOSTOUTPUT$ service_perfdata_file_template=DATATYPE::SERVICEPERFDATAtTIMET::$TIMET$tHOSTNA ME::$HOSTNAME$tSERVICEDESC::$SERVICEDESC$tSERVICEPERFDATA::$SERVICEPERFDATA$t SERVICECHECKCOMMAND::$SERVICECHECKCOMMAND$tHOSTSTATE::$HOSTSTATE$tHOSTSTATETYP E::$HOSTSTATETYPE$tSERVICESTATE::$SERVICESTATE$tSERVICESTATETYPE::$SERVICESTAT ETYPE$tSERVICEOUTPUT::$SERVICEOUTPUT$ # HOST AND SERVICE PERFORMANCE DATA FILE MODES # This option determines whether or not the host and service # performance data files are opened in write ("w") or append ("a") # mode. If you want to use named pipes, you should use the special # pipe ("p") mode which avoid blocking at startup, otherwise you will # likely want the defult append ("a") mode. host_perfdata_file_mode=a service_perfdata_file_mode=a # HOST AND SERVICE PERFORMANCE DATA FILE PROCESSING INTERVAL # These options determine how often (in seconds) the host and service # performance data files are processed using the commands defined # below. A value of 0 indicates the files should not be periodically # processed. host_perfdata_file_processing_interval=15 service_perfdata_file_processing_interval=15 # HOST AND SERVICE PERFORMANCE DATA FILE PROCESSING COMMANDS # These commands are used to periodically process the host and # service performance data files. The interval at which the # processing occurs is determined by the options above. host_perfdata_file_processing_command=process-host-perfdata-file service_perfdata_file_processing_command=process-service-perfdata-file At the end of /usr/local/nagios/etc/objects/commands.cfg, add the command definitions: define command{ command_name process-service-perfdata-file command_line $USER1$/process_perfdata.pl --bulk=/usr/local/nagios/var/service- perfdata } define command{ command_name process-host-perfdata-file command_line $USER1$/process_perfdata.pl --bulk=/usr/local/nagios/var/host- perfdata } Restart Nagios. Now if you look in /usr/local/nagios/share/perfdata, you should start to see rrd files created by pnp4nagios for all your monitored hosts and services. These rrd files are created with pnp's default time settings - 48 hours of 1 minute time step data, 4 years of 360 minute time step data. If you want more or less, change rra.cfg before running pnp for the first time. If everything is set up correctly, http://your-nagios-host/nagios/pnp/index.php should show your first pnp graphs. If not, a debug message should tell you which component was broken or missing.
  • 5. There is one more step to complete the setup. We need to enable extended info in Nagios so that links to the graphs are created for each applicable host and service. Append two entries to /usr/local/nagios/etc/objects/templates.cfg: define host { name host-pnp register 0 action_url /nagios/pnp/index.php?host=$HOSTNAME$ } define service { name srv-pnp register 0 action_url /nagios/pnp/index.php?host=$HOSTNAME$&srv=$SERVICEDESC$ }
  • 6. These are templates that you add to each host and service definition with graphs: define host { use linux-server,host-pnp host_name ubuntu alias ubuntu address 127.0.0.1 } define service { use local-service,srv-pnp host_name ubuntu service_description PING check_command check_ping!100.0,20%!500.0,60% } After signalling Nagios to restart, the icons for the graphs should appear next to the hosts and services. I usually replace the “bullet hole” image /usr/local/nagios/share/images/action.gif with the graph image provided in /usr/local/nagios/share/pnp/images/action.gif The number of graphs and time period displayed on the web interface is independent of what's actually stored in the rrd files. To change these, see the options in the pnp/config.php file.
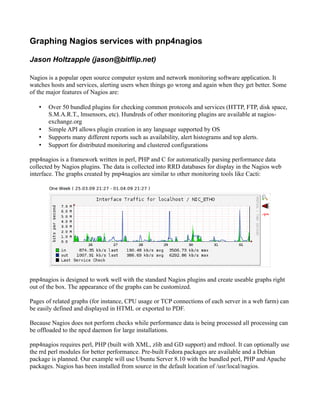
  • 7. Example: Setting Up An SNMP Service check_snmp_int is a 3rd party check plugin specifically designed to check network interface counters via SNMP. We'll set it up to create a cacti-style traffic graph for our server. Our server already has snmpd installed and the community string set to 'public'. 1. Copy the check_snmp_int script into the plugin directory: /usr/local/nagios/libexec. Make sure it is owned by the Nagios user and is executable. 2. Create the service definition in /usr/local/nagios/etc/objects/localhost.cfg: define service { use local-service,srv-pnp host_name ubuntu service_description NIC_ETH0 check_command check_snmp_int!eth0!-f } Service definitions should be made as flexible as possible. “!” separates arguments that nagios will send to the underlying command. The first argument is the interface name and the second argument contains any additional arguments for the check_snmp_int plugin. 3. Create the command definition in /usr/local/nagios/etc/objects/commands.cfg: define command { command_name check_snmp_int command_line $USER1$/check_snmp_int -H $HOSTADDRESS$ -C $USER3$ -n $ARG1$ $ARG2$ } $HOSTADDRESS$ is built-in macro supplied by Nagios as the hostname of the server being checked. $USER3$ is the public community string that we'll define in a minute. $ARG1$ and $ARG2$ are set to 'eth0' and '-f' when our check is run. 4. Define the $USER3$ macro in /usr/local/nagios/etc/resource.cfg: # Sets $USER1$ to be the path to the plugins $USER1$=/usr/local/nagios/libexec # Sets $USER2$ to be the path to event handlers #$USER2$=/usr/local/nagios/libexec/eventhandlers # SNMP public community string $USER3$=public 5. To display the graph pnp will look in its template.dist directory and see if there's a file with the same name as the command_name of the command definition. If there is, it will use it. If not, it will use default.pnp. This is a php script that builds arguments to the rrdtool command. If there is a customized file in the template directory, it will use that instead. But there are two issues with the supplied check_snmp_int.php: we would like the graph to have the same format as cacti and we'd also like it to display in the more standard bits per second, not bytes per second as collected.
  • 8. There is already an included template that does the bytes to bits conversion installed with pnp: check_snmp_int-bits.php. We'll copy /usr/local/nagios/share/pnp/templates.dist/check_snmp_int- bits.php to /usr/local/nagios/share/pnp/templates/check_snmp_int.php for our local edits. I've highlighted what to change: RRD CHEAT SHEET rrd – file containing multiple sources of time-related data step – time interval in rra rra – round-robin archive. An rrd file will contain one of these for each step and timeperiod recorded DEF – get data from an rrd file CDEF – create new set of data from existing DEF (can be used for graphing like DEF) AREA, LINE – draw graph using DEF or CDEF GPRINT – print inside the graph <?php # # Copyright (c) 2006-2008 Joerg Linge (http://www.pnp4nagios.org) # Plugin: check_iftraffic.pl (COUNTER) # Output based on Bits/s # # $Id: check_snmp_int-bits.php 523 2008-09-26 17:10:20Z pitchfork $ # # $opt[1] = " --vertical-label "Traffic" -b 1000 --title "Interface Traffic for $hostname / $servicedesc" "; $def[1] = "DEF:var1=$rrdfile:$DS[1]:AVERAGE " ; $def[1] .= "DEF:var2=$rrdfile:$DS[2]:AVERAGE " ; $def[1] .= "CDEF:in_bits=var1,8,* "; $def[1] .= "CDEF:out_bits=var2,8,* "; $def[1] .= "AREA:in_bits#00cf00:"in " " ; $def[1] .= "GPRINT:in_bits:LAST:"%7.2lf %Sbit/s last" " ; $def[1] .= "GPRINT:in_bits:AVERAGE:"%7.2lf %Sbit/s avg" " ; $def[1] .= "GPRINT:in_bits:MAX:"%7.2lf %Sbit/s maxn" " ; $def[1] .= "LINE1:out_bits#002a00:"out " " ; $def[1] .= "GPRINT:out_bits:LAST:"%7.2lf %Sbit/s last" " ; $def[1] .= "GPRINT:out_bits:AVERAGE:"%7.2lf %Sbit/s avg" " ; $def[1] .= "GPRINT:out_bits:MAX:"%7.2lf %Sbit/s maxn" "; if($NAGIOS_TIMET != ""){ $def[1] .= "VRULE:".$NAGIOS_TIMET."#000000:"Last Service Check n" "; } if($NAGIOS_LASTHOSTDOWN != ""){ $def[1] .= "VRULE:".$NAGIOS_LASTHOSTDOWN."#FF0000:"Last Host Downn" "; } ?> Now our graph will look like this (I cheated a bit because our new graph would not have collected this much data yet, but this it what it would look like in a few hours):
  • 9.
  • 10. Example: Migrating a legacy graphing tool (Orca) to pnp4nagios Rationale: during an upgrade from Nagios 1 to Nagios 3, a decision was made to replace Orca (which is not very actively maintained by the authors) running on Solaris 8 & 10 servers with pnp4nagios. The Orca collector would remain on the system, generating the same statistics, but the statistics will be collected and displayed by Nagios and pnp. Orca works by collecting performance data regularly on each monitored system. Periodically the collector logs are copied to a central server where they are processed into rrd files. A cgi script allows a web browser to view the graphs. The basic steps to migrate this service are: 1. Configure Orca to write logs to new location and rotate daily 2. Write Nagios plugin to read orca log and return appropriate data 3. Write pnp4nagios template to display the data 4. Turn off old Orca server 5. Profit The first line of an Orca log contains a space separated list of parameters monitored. The second and subsequent lines contain timestamped performance data. This makes it easy to write a script to request parameters and return values. root@orcaclient [16:43:51 tmp] head -2 /tmp/orcallator-2009-03-28-000 timestamp locltime uptime state_D state_N state_n state_s state_r state_k state_c state_m state_d state_i state_t DNnsrkcmdit usr% sys% wio% idle% ... (several dozen more parameters) 1238223600 00:00:00 2443807 8 2 0 0 0 0 0 8 2 0 2 RgwwwwwRgwg 1.2 22.6 0.0 76.2 ... (several dozen more parameters) The Nagios plugin is called with a list of all parameters requested: check_solaris_orcallator -q "#proc/s,tcp_Icn/s,tcp_Ocn/s,dnlc_hit%,inod_hit%,tcp_Ret%,tcp_Dup %,tcp_estb,tcp_Rst/s,tcp_Atf/s,tcp_Ldrp/s,tcp_LdQ0/s,tcp_HOdp/s,smtx,smtx/cpu,disk_rd/s,disk_wr/s,disk_ rK/s,disk_wK/s,dnlc_ref/s,inod_ref/s,scanrate,pageslock,usr%,sys%,wio%,idle%" Here is the output in standard Nagios plugin performance format. (See the Nagios docs for more details on this format) ORCA OK - tcp_Atf/s 0.000 tcp_Ldrp/s 0.000 tcp_LdQ0/s 0.000 tcp_HOdp/s 0.000 smtx 972 smtx/cpu 60 disk_rd/s 14.5 disk_wr/s 222.3 disk_rK/s 463.5 disk_wK/s 11454.4 #proc/s 2.247 dnlc_ref/s 4441.080 inod_ref/s 0.740 scanrate 0.000 pageslock 13326231 usr% 0.2 sys% 2.2 wio% 0.0 idle% 97.5 tcp_Icn/s 0.397 tcp_Ocn/s 0.217 dnlc_hit% 99.992 inod_hit% 100.000 tcp_Ret% 0.000 tcp_Dup% 0.000 tcp_estb 337 tcp_Rst/s 0.403 |'tcp_Atf/s'=0.000 'tcp_Ldrp/s'=0.000 'tcp_LdQ0/s'=0.000 'tcp_HOdp/s'=0.000 'smtx'=972 'smtx/cpu'=60 'disk_rd/s'=14.5 'disk_wr/s'=222.3 'disk_rK/s'=463.5 'disk_wK/s'=11454.4 '#proc/s'=2.247 'dnlc_ref/s'=4441.080 'inod_ref/s'=0.740 'scanrate'=0.000 'pageslock'=13326231 'usr%'=0.2 'sys%'=2.2 'wio%'=0.0 'idle%'=97.5 'tcp_Icn/s'=0.397 'tcp_Ocn/s'=0.217 'dnlc_hit%'=99.992 'inod_hit%'=100.000 'tcp_Ret%'=0.000 'tcp_Dup%'=0.000 'tcp_estb'=337 'tcp_Rst/s'=0.403
  • 11. The complete check_solaris_orcallator perl script is included at the end of the presentation. This script needs to be copied to each monitored host. The nagios service definition looks like this: define service { use service-unix-template,srv-pnp hostgroup_name orcallator service_description ORCA_ALL check_command check_nrpe_solaris_orcallator_all } The command definition looks like: define command { command_name check_nrpe_solaris_orcallator_all command_line $USER1$/check_nrpe -H $HOSTADDRESS$ -c check_solaris_orcallator_all } check_nrpe is the standard Nagios agent for running check programs on remote hosts. Each monitored host has this entry in its /usr/local/nagios/etc/nrpe.cfg: command[check_solaris_orcallator_all]=/usr/local/nagios/libexec/check_solaris_orcallator -q "#proc/s,tcp_Icn/s,tcp_Ocn/s,dnlc_hit%,inod_hit%,tcp_Ret%,tcp_Dup %,tcp_estb,tcp_Rst/s,tcp_Atf/s,tcp_Ldrp/s,tcp_LdQ0/s,tcp_HOdp/s,smtx,smtx/cpu,disk_rd/s,disk_wr/s,disk_ rK/s,disk_wK/s,dnlc_ref/s,inod_ref/s,scanrate,pageslock,usr%,sys%,wio%,idle%" The last task is to create a pnp template for graph display. Each counter/value pair returned from the orca plugin is placed into its own data source (DS) in the rrd file by pnp (in order). The appearance and legend of the graphs follow Orca as closely as possible. Here is the code for displaying the first graph – the full version for all 15 graphs is at the end of the presentation. <?php # # display Orca counters. The file is in DS order, the actual graphs are displayed in # $opt[]/$def[] order on the web pages $opt[1] = "--lower-limit 0 --upper-limit 100 --rigid --vertical-label "" -b 1000 --title "$hostname / CPU""; $ds_name[1] = "usr%,sys%,wio%,idle%"; $def[1] = "DEF:var1=$rrdfile:$DS[16]:AVERAGE " ; $def[1] .= "DEF:var2=$rrdfile:$DS[17]:AVERAGE " ; $def[1] .= "DEF:var3=$rrdfile:$DS[18]:AVERAGE " ; $def[1] .= "DEF:var4=$rrdfile:$DS[19]:AVERAGE " ; $def[1] .= "AREA:var1#0000ff:$NAME[16]:STACK "; $def[1] .= "GPRINT:var1:LAST:"%3.1lf last" " ; $def[1] .= "GPRINT:var1:AVERAGE:"%3.1lf avg" " ; $def[1] .= "GPRINT:var1:MAX:"%3.1lf max" " ; $def[1] .= "AREA:var2#ff0000:$NAME[17]:STACK "; $def[1] .= "GPRINT:var2:LAST:"%3.1lf last" " ; $def[1] .= "GPRINT:var2:AVERAGE:"%3.1lf avg" " ; $def[1] .= "GPRINT:var2:MAX:"%3.1lf maxn" "; $def[1] .= "AREA:var3#8b00cc:$NAME[18]:STACK "; $def[1] .= "GPRINT:var3:LAST:"%3.1lf last" " ; $def[1] .= "GPRINT:var3:AVERAGE:"%3.1lf avg" " ; $def[1] .= "GPRINT:var3:MAX:"%3.1lf max" "; $def[1] .= "AREA:var4#00cf00:$NAME[19]:STACK "; $def[1] .= "GPRINT:var4:LAST:"%3.1lf last" " ; $def[1] .= "GPRINT:var4:AVERAGE:"%3.1lf avg" " ; $def[1] .= "GPRINT:var4:MAX:"%3.1lf maxn" ";
  • 12. When it is all put together, the collection of Orca graphs looks like this:
  • 13. Custom scripts: /usr/local/nagios/libexec/check_solaris_orcallator #!/usr/bin/perl -wT use strict; use Getopt::Std; $ENV{'PATH'}='/usr/bin'; # Nagios plugin return values my $RET_OK = 0; my $RET_WARN = 1; my $RET_CRIT = 2; my $RET_UNK = 3; my $result = 'UNKNOWN'; my ($key, $value); my $sorted_key; my %stat_map; my $addr; my %values; my $ret; my $stats; my $count; my %opts; getopts ('q:', %opts); my $QUERY = $opts{q} || ''; unless ($QUERY) { usage (); exit $RET_WARN; } my $orca_logloc = '/tmp/orcallator*'; my $orca_log = `ls -t $orca_logloc | head -1 2>/dev/null`; unless ($orca_log) { print "Can't find orcallator log file in $orca_logloc"; exit $RET_UNK; } chomp ($orca_log); $count = 0; open ORCA, "$orca_log" or die "Can't open $orca_log: $!"; my $line = <ORCA>; chomp $line; foreach (split /s+/, $line) { $stat_map{$_} = $count; ++$count; } my @queries = split /,/,$QUERY; foreach (@queries) { unless (exists $stat_map{$_}) { print "Unknown orca stat $_n"; exit $RET_WARN; } } # read last line while (<ORCA>) { $addr = tell (ORCA) unless eof (ORCA); } seek (ORCA, $addr, 0); $line = <ORCA>;
  • 14. chomp $line; close ORCA or warn "close: $orca_log: $!"; my @stats = split /s+/, $line; $count = 1; foreach (@queries) { $values{"${count}_$_"} = $stats[$stat_map{$_}]; ++$count; } foreach $sorted_key (sort keys %values) { $key = $sorted_key; $key =~ s/^d+_//; $ret .= qq($key $values{$sorted_key} ); $stats .= qq('$key'=$values{$sorted_key} ); } print "ORCA OK - $ret|$statsn"; exit 0; sub usage () { print STDERR qq(usage: $0 -q "orcavalue,orcavalue,..."n); } /usr/local/nagios/share/pnp/templates/check_nrpe_solaris_orcallator_all.php <?php # # display Orca counters. The file is in DS order, the actual graphs are displayed in # $opt[]/$def[] order on the web page $opt[10] = "--vertical-label "" -b 1000 --title "$hostname / TCP Attempt Fail Rate Per Sec""; $ds_name[10] = "tcp_Atf_s"; $def[10] = "DEF:var1=$rrdfile:$DS[1]:AVERAGE " ; $def[10] .= "AREA:var1#00cf00:"$NAME[1] " " ; $def[10] .= "GPRINT:var1:LAST:"%7.2lf %S last" " ; $def[10] .= "GPRINT:var1:AVERAGE:"%7.2lf %S avg" " ; $def[10] .= "GPRINT:var1:MAX:"%7.2lf %S maxn" " ; $opt[11] = "--vertical-label "" -b 1000 --title "$hostname / TCP Listen Drop Rate Per Sec""; $ds_name[11] = "tcp_Ldrp_s,tcp_LdQ0_s,tcp_HOdp_s"; $def[11] = "DEF:var1=$rrdfile:$DS[2]:AVERAGE " ; $def[11] .= "DEF:var2=$rrdfile:$DS[3]:AVERAGE " ; $def[11] .= "DEF:var3=$rrdfile:$DS[4]:AVERAGE " ; $def[11] .= "LINE:var1#00ff00:"$NAME[2] " " ; $def[11] .= "GPRINT:var1:LAST:"%7.2lf %S last" " ; $def[11] .= "GPRINT:var1:AVERAGE:"%7.2lf %S avg" " ; $def[11] .= "GPRINT:var1:MAX:"%7.2lf %S maxn" " ; $def[11] .= "LINE1:var2#ff0000:"$NAME[3] " " ; $def[11] .= "GPRINT:var2:LAST:"%7.2lf %S last" " ; $def[11] .= "GPRINT:var2:AVERAGE:"%7.2lf %S avg" " ; $def[11] .= "GPRINT:var2:MAX:"%7.2lf %S maxn" "; $def[11] .= "LINE2:var3#0000ff:"$NAME[4] " " ; $def[11] .= "GPRINT:var3:LAST:"%7.2lf %S last" " ; $def[11] .= "GPRINT:var3:AVERAGE:"%7.2lf %S avg" " ; $def[11] .= "GPRINT:var3:MAX:"%7.2lf %S maxn" "; $opt[9] = "--vertical-label "" -b 1000 --title "$hostname / Sleeps On Mutex Per Sec""; $ds_name[9] = "smtx,smtx_cpu"; $def[9] = "DEF:var1=$rrdfile:$DS[5]:AVERAGE " ; $def[9] .= "DEF:var2=$rrdfile:$DS[6]:AVERAGE " ; $def[9] .= "AREA:var1#00cf00:"$NAME[5] " " ; $def[9] .= "GPRINT:var1:LAST:"%8.2lf %S last" " ; $def[9] .= "GPRINT:var1:AVERAGE:"%7.2lf %S avg" " ; $def[9] .= "GPRINT:var1:MAX:"%7.2lf %S maxn" " ; $def[9] .= "LINE1:var2#0000ff:"$NAME[6] " " ; $def[9] .= "GPRINT:var2:LAST:"%3.2lf %S last" " ; $def[9] .= "GPRINT:var2:AVERAGE:"%7.2lf %S avg" " ; $def[9] .= "GPRINT:var2:MAX:"%7.2lf %S maxn" "; $opt[4] = "--vertical-label "" -b 1000 --title "$hostname / Disk System-wide R/W Ops Per Sec"";
  • 15. $ds_name[4] = "disk_rd_s,disk_wr_s"; $def[4] = "DEF:var1=$rrdfile:$DS[7]:AVERAGE " ; $def[4] .= "DEF:var2=$rrdfile:$DS[8]:AVERAGE " ; $def[4] .= "AREA:var1#00cf00:"$NAME[7] " " ; $def[4] .= "GPRINT:var1:LAST:"%7.2lf %S last" " ; $def[4] .= "GPRINT:var1:AVERAGE:"%7.2lf %S avg" " ; $def[4] .= "GPRINT:var1:MAX:"%7.2lf %S maxn" " ; $def[4] .= "LINE1:var2#0000ff:"$NAME[8] " " ; $def[4] .= "GPRINT:var2:LAST:"%7.2lf %S last" " ; $def[4] .= "GPRINT:var2:AVERAGE:"%7.2lf %S avg" " ; $def[4] .= "GPRINT:var2:MAX:"%7.2lf %S maxn" "; $opt[5] = "--vertical-label "" -b 1000 --title "$hostname / Disk System-wide R/W Transfer Rate KB Per Sec""; $ds_name[5] = "disk_rK_s,disk_wK_s"; $def[5] = "DEF:var1=$rrdfile:$DS[9]:AVERAGE " ; $def[5] .= "DEF:var2=$rrdfile:$DS[10]:AVERAGE " ; $def[5] .= "AREA:var1#00cf00:"$NAME[9] " " ; $def[5] .= "GPRINT:var1:LAST:"%7.2lf %S last" " ; $def[5] .= "GPRINT:var1:AVERAGE:"%7.2lf %S avg" " ; $def[5] .= "GPRINT:var1:MAX:"%7.2lf %S maxn" " ; $def[5] .= "LINE1:var2#0000ff:"$NAME[10] " " ; $def[5] .= "GPRINT:var2:LAST:"%7.2lf %S last" " ; $def[5] .= "GPRINT:var2:AVERAGE:"%7.2lf %S avg" " ; $def[5] .= "GPRINT:var2:MAX:"%7.2lf %S maxn" "; $opt[8] = "--vertical-label "" -b 1000 --title "$hostname / New Processes Per Sec""; $ds_name[8] = "#proc_s"; $def[8] = "DEF:var1=$rrdfile:$DS[11]:AVERAGE " ; $def[8] .= "AREA:var1#00cf00:"$NAME[11] " " ; $def[8] .= "GPRINT:var1:LAST:"%7.2lf %S last" " ; $def[8] .= "GPRINT:var1:AVERAGE:"%7.2lf %S avg" " ; $def[8] .= "GPRINT:var1:MAX:"%7.2lf %S maxn" " ; $opt[3] = "--vertical-label "" -b 1000 --title "$hostname / Disk Cache Refs Per Sec""; $ds_name[3] = "dnlc_ref_s,inod_ref_s"; $def[3] = "DEF:var1=$rrdfile:$DS[12]:AVERAGE " ; $def[3] .= "DEF:var2=$rrdfile:$DS[13]:AVERAGE " ; $def[3] .= "AREA:var1#00cf00:"$NAME[12] " " ; $def[3] .= "GPRINT:var1:LAST:"%7.2lf %S last" " ; $def[3] .= "GPRINT:var1:AVERAGE:"%7.2lf %S avg" " ; $def[3] .= "GPRINT:var1:MAX:"%7.2lf %S maxn" " ; $def[3] .= "LINE1:var2#0000ff:"$NAME[13] " " ; $def[3] .= "GPRINT:var2:LAST:"%7.2lf %S last" " ; $def[3] .= "GPRINT:var2:AVERAGE:"%7.2lf %S avg" " ; $def[3] .= "GPRINT:var2:MAX:"%7.2lf %S max" " ; $opt[7] = "--vertical-label "" -b 1000 --title "$hostname / Memory Pages Scanned Per Sec""; $ds_name[7] = "scanrate"; $def[7] = "DEF:var1=$rrdfile:$DS[14]:AVERAGE " ; $def[7] .= "AREA:var1#00cf00:"$NAME[14] " " ; $def[7] .= "GPRINT:var1:LAST:"%7.2lf %S last" " ; $def[7] .= "GPRINT:var1:AVERAGE:"%7.2lf %S avg" " ; $def[7] .= "GPRINT:var1:MAX:"%7.2lf %S maxn" " ; $opt[6] = "--vertical-label "" -b 1000 --title "$hostname / Locked Memory Pages""; $ds_name[6] = "pageslock"; $def[6] = "DEF:var1=$rrdfile:$DS[15]:AVERAGE " ; $def[6] .= "AREA:var1#00cf00:"$NAME[15] " " ; $def[6] .= "GPRINT:var1:LAST:"%7.2lf %S last" " ; $def[6] .= "GPRINT:var1:AVERAGE:"%7.2lf %S avg" " ; $def[6] .= "GPRINT:var1:MAX:"%7.2lf %S maxn" " ; $opt[1] = "--lower-limit 0 --upper-limit 100 --rigid --vertical-label "" -b 1000 --title "$hostname / CPU""; $ds_name[1] = "usr%,sys%,wio%,idle%"; $def[1] = "DEF:var1=$rrdfile:$DS[16]:AVERAGE " ; $def[1] .= "DEF:var2=$rrdfile:$DS[17]:AVERAGE " ; $def[1] .= "DEF:var3=$rrdfile:$DS[18]:AVERAGE " ; $def[1] .= "DEF:var4=$rrdfile:$DS[19]:AVERAGE " ; $def[1] .= "AREA:var1#0000ff:$NAME[16]:STACK "; $def[1] .= "GPRINT:var1:LAST:"%3.1lf last" " ;
  • 16. $def[1] .= "GPRINT:var1:AVERAGE:"%3.1lf avg" " ; $def[1] .= "GPRINT:var1:MAX:"%3.1lf max" " ; $def[1] .= "AREA:var2#ff0000:$NAME[17]:STACK "; $def[1] .= "GPRINT:var2:LAST:"%3.1lf last" " ; $def[1] .= "GPRINT:var2:AVERAGE:"%3.1lf avg" " ; $def[1] .= "GPRINT:var2:MAX:"%3.1lf maxn" "; $def[1] .= "AREA:var3#8b00cc:$NAME[18]:STACK "; $def[1] .= "GPRINT:var3:LAST:"%3.1lf last" " ; $def[1] .= "GPRINT:var3:AVERAGE:"%3.1lf avg" " ; $def[1] .= "GPRINT:var3:MAX:"%3.1lf max" "; $def[1] .= "AREA:var4#00cf00:$NAME[19]:STACK "; $def[1] .= "GPRINT:var4:LAST:"%3.1lf last" " ; $def[1] .= "GPRINT:var4:AVERAGE:"%3.1lf avg" " ; $def[1] .= "GPRINT:var4:MAX:"%3.1lf maxn" "; $opt[12] = "--vertical-label "" -b 1000 --title "$hostname / TCP Connections Per Sec""; $ds_name[12] = "tcp_Icn_s,tcp_Ocn_s"; $def[12] = "DEF:var1=$rrdfile:$DS[20]:AVERAGE " ; $def[12] .= "DEF:var2=$rrdfile:$DS[21]:AVERAGE " ; $def[12] .= "AREA:var1#00cf00:"$NAME[20] " " ; $def[12] .= "GPRINT:var1:LAST:"%7.2lf %S last" " ; $def[12] .= "GPRINT:var1:AVERAGE:"%7.2lf %S avg" " ; $def[12] .= "GPRINT:var1:MAX:"%7.2lf %S maxn" " ; $def[12] .= "LINE1:var2#0000ff:"$NAME[21] " " ; $def[12] .= "GPRINT:var2:LAST:"%7.2lf %S last" " ; $def[12] .= "GPRINT:var2:AVERAGE:"%7.2lf %S avg" " ; $def[12] .= "GPRINT:var2:MAX:"%7.2lf %S max" " ; $opt[2] = "--vertical-label "" -b 1000 --title "$hostname / Disk Cache Utilization""; $ds_name[2] = "dnlc_hit%,inod_hit%"; $def[2] = "DEF:var1=$rrdfile:$DS[22]:AVERAGE " ; $def[2] .= "DEF:var2=$rrdfile:$DS[23]:AVERAGE " ; $def[2] .= "AREA:var1#00cf00:"$NAME[22] " " ; $def[2] .= "GPRINT:var1:LAST:"%7.2lf %S last" " ; $def[2] .= "GPRINT:var1:AVERAGE:"%7.2lf %S avg" " ; $def[2] .= "GPRINT:var1:MAX:"%7.2lf %S maxn" " ; $def[2] .= "LINE1:var2#0000ff:"$NAME[23] " " ; $def[2] .= "GPRINT:var2:LAST:"%7.2lf %S last" " ; $def[2] .= "GPRINT:var2:AVERAGE:"%7.2lf %S avg" " ; $def[2] .= "GPRINT:var2:MAX:"%7.2lf %S max" " ; $opt[15] = "--vertical-label "" -b 1000 --title "$hostname / TCP Retrans & Dupes""; $ds_name[15] = "tcp_Ret%,tcp_Dup%"; $def[15] = "DEF:var1=$rrdfile:$DS[24]:AVERAGE " ; $def[15] .= "DEF:var2=$rrdfile:$DS[25]:AVERAGE " ; $def[15] .= "AREA:var1#00cf00:"$NAME[24] " " ; $def[15] .= "GPRINT:var1:LAST:"%7.2lf %S last" " ; $def[15] .= "GPRINT:var1:AVERAGE:"%7.2lf %S avg" " ; $def[15] .= "GPRINT:var1:MAX:"%7.2lf %S maxn" " ; $def[15] .= "LINE1:var2#0000ff:"$NAME[25] " " ; $def[15] .= "GPRINT:var2:LAST:"%7.2lf %S last" " ; $def[15] .= "GPRINT:var2:AVERAGE:"%7.2lf %S avg" " ; $def[15] .= "GPRINT:var2:MAX:"%7.2lf %S max" " ; $opt[13] = "--vertical-label "" -b 1000 --title "$hostname / TCP Established Connections""; $ds_name[13] = "tcp_estb"; $def[13] = "DEF:var1=$rrdfile:$DS[26]:AVERAGE " ; $def[13] .= "AREA:var1#00cf00:"$NAME[26] " " ; $def[13] .= "GPRINT:var1:LAST:"%7.2lf %S last" " ; $def[13] .= "GPRINT:var1:AVERAGE:"%7.2lf %S avg" " ; $def[13] .= "GPRINT:var1:MAX:"%7.2lf %S maxn" " ; $opt[14] = "--vertical-label "" -b 1000 --title "$hostname / TCP Resets Per Sec""; $ds_name[14] = "tcp_Rst_s"; $def[14] = "DEF:var1=$rrdfile:$DS[27]:AVERAGE " ; $def[14] .= "AREA:var1#00cf00:"$NAME[27] " " ; $def[14] .= "GPRINT:var1:LAST:"%7.2lf %S last" " ; $def[14] .= "GPRINT:var1:AVERAGE:"%7.2lf %S avg" " ; $def[14] .= "GPRINT:var1:MAX:"%7.2lf %S maxn" " ; ?>