Basic Statistics
The z-Score and standard normal distribution
One of the most common measurements in statistics is the z-score, which identifies the number of standard deviations a particular value is from the mean of its population or sample.
Population z-score
where:
x = The data value of interest
µ = The population mean
σ= The population standard deviation
If our data are from a sample, we would use the equation below to compute the z-score.
Sample z-score
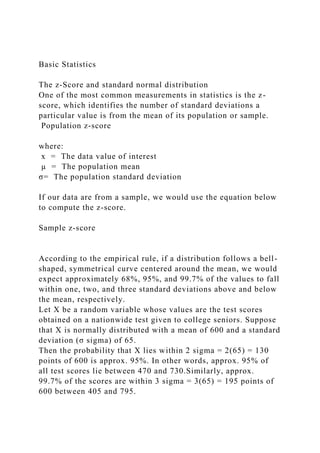
According to the empirical rule, if a distribution follows a bell-shaped, symmetrical curve centered around the mean, we would expect approximately 68%, 95%, and 99.7% of the values to fall within one, two, and three standard deviations above and below the mean, respectively.
Let X be a random variable whose values are the test scores obtained on a nationwide test given to college seniors. Suppose that X is normally distributed with a mean of 600 and a standard deviation (σ sigma) of 65.
Then the probability that X lies within 2 sigma = 2(65) = 130 points of 600 is approx. 95%. In other words, approx. 95% of all test scores lie between 470 and 730.Similarly, approx. 99.7% of the scores are within 3 sigma = 3(65) = 195 points of 600 between 405 and 795.
Then, what is the probability of getting a score 470-600? We need to convert the normal variable into standard normal variable Z in order to answer this question.
Standard Normal Distribution, Standard Normal Variable
Standard Normal Distribution: is a distribution with mean=0 and standard deviation =1
Standard normal random variable (Z): is a normal variable with mean = 0 and standard deviation= 1.
This variable is usually designated Z. Any "regular" normal variable can be designated as X.
Probabilities of the form P(a ≤ Z ≤ b) can be calculated with the aid of a Normal Distribution Table
See: http://www.stat.purdue.edu/~mccabe/ips4tab/bmtables.pdf
Or
http://www.mathsisfun.com/data/standard-normal-distribution-table.htm
Sampling and sampling distributions
Why sample?
Collecting data from the entire population is costly and nearly impossible. If sampling is done properly, the information about the sample can be used to make an accurate assessment of the population. We use Parametersto describe the characteristics (e.g., population mean, population standard deviation) of the population while we use Statistics to describe the characteristics of the sample (e.g., sample mean, sample standard deviation). Because a statistic is based on a subset of a population, we should not expect the sample statistics are the same value as population statistics. The difference between the two values is known as the sampling error.
Central Limit Theorem
Population distribution can take on any forms.
The Central Limit Theorem states that the sample means of large-sized samples (30) will be normally distributed regardless of the shape of their population distributions. The mean of this normal distribution is ...
Z Score,T Score, Percential Rank and Box Plot Graph
Basic Statistics The z-Score and standard normal distribution.docx
1. Basic Statistics
The z-Score and standard normal distribution
One of the most common measurements in statistics is the z-
score, which identifies the number of standard deviations a
particular value is from the mean of its population or sample.
Population z-score
where:
x = The data value of interest
µ = The population mean
σ= The population standard deviation
If our data are from a sample, we would use the equation below
to compute the z-score.
Sample z-score
According to the empirical rule, if a distribution follows a bell-
shaped, symmetrical curve centered around the mean, we would
expect approximately 68%, 95%, and 99.7% of the values to fall
within one, two, and three standard deviations above and below
the mean, respectively.
Let X be a random variable whose values are the test scores
obtained on a nationwide test given to college seniors. Suppose
that X is normally distributed with a mean of 600 and a standard
deviation (σ sigma) of 65.
Then the probability that X lies within 2 sigma = 2(65) = 130
points of 600 is approx. 95%. In other words, approx. 95% of
all test scores lie between 470 and 730.Similarly, approx.
99.7% of the scores are within 3 sigma = 3(65) = 195 points of
600 between 405 and 795.
2. Then, what is the probability of getting a score 470-600? We
need to convert the normal variable into standard normal
variable Z in order to answer this question.
Standard Normal Distribution, Standard Normal Variable
Standard Normal Distribution: is a distribution with mean=0
and standard deviation =1
Standard normal random variable (Z): is a normal variable with
mean = 0 and standard deviation= 1.
This variable is usually designated Z. Any "regular" normal
variable can be designated as X.
Probabilities of the form P(a ≤ Z ≤ b) can be calculated with the
aid of a Normal Distribution Table
See: http://www.stat.purdue.edu/~mccabe/ips4tab/bmtables.pdf
Or
http://www.mathsisfun.com/data/standard-normal-distribution-
table.htm
Sampling and sampling distributions
Why sample?
3. Collecting data from the entire population is costly and nearly
impossible. If sampling is done properly, the information about
the sample can be used to make an accurate assessment of the
population. We use Parametersto describe the characteristics
(e.g., population mean, population standard deviation) of the
population while we use Statistics to describe the characteristics
of the sample (e.g., sample mean, sample standard deviation).
Because a statistic is based on a subset of a population, we
should not expect the sample statistics are the same value as
population statistics. The difference between the two values is
known as the sampling error.
Central Limit Theorem
Population distribution can take on any forms.
The Central Limit Theorem states that the sample means of
large-sized samples (30) will be normally distributed regardless
of the shape of their population distributions. The mean of this
normal distribution is equal to the population mean and its
variance equal to the parent population variance divided by the
sample size.
µ=µ
Based on the central limit theorem, we are able to make
4. inferences of the population parameters based on the sample
statistics. And this is the KEY theorem to statistical inference
because most times, we are not sure about the population
parameters.
1. Standard error of the mean The standard error of the mean is
the sample mean standard deviation, which measures the
average variation around the mean of the sample means
2. Z score for the sample mean
Utility 1:
When we know the population parameter, we can infer sample
statistics.
Based on the Z score of the sample mean, we are able to
estimate the probability of a sample mean taking on different
ranges of value. For example, what is the probability of a
sample mean larger than 5, larger than 5 but smaller than 7,
smaller than 5 etc?
Example: The average GPA at a particular school is m=2.89
with a standard deviation s=0.63. A random sample of 25
students is collected. Find the probability that the average GPA
for this sample is greater than 3.0.
The average is standard error is
The z-score is . Looking up this z-score in the normal curve
table yields a probability of .8078. The final answer is 1-
.8078=.1922.
5. Utility 2:
When we know the sample statistics, we are able to infer the
population parameter.
For example, let’s say I make the claim that my average drive of
a golf ball while teeing off is equal to a whopping 240 yards in
length. But you don’t believe it. You see, now you know how to
put my claim to the test. You can do so by randomly sampling
45 of my drives to satisfy the CLT requirement (we have no
knowledge of the shape of the population distribution). Suppose
the average drive from this sample is 233 yards, and the
standard deviation for my driving population is 20 yards. Is
there enough evidence to support my claim?
On the surface, you might be led to believe that, because 233
yards is less than 240, my claim is not supported. However, the
mean of 233 yards is based on a sample. We know from earlier
in the chapter that a sampling error occurs when a sample is
used to estimate a population parameter. The sample mean does
not have to equal 240 to support my claim; it can be slightly
lower and still suffice. However, to answer this question
thoroughly, You need to employ the CLT. Your goal is to
determine the probability of observing a sample mean of 233
yards or less, given that the sampling distribution mean (which
we assume equals the population mean) is truly 240 yards. First,
you set up our sampling distribution by assuming the mean does
equal 240 yards. Even though we don’t know if this claim is
true at this point, we assume it is in order to test my claim.
= 240 yards
Next, you calculate the standard error of the mean:
σ = 20 yards n = 45
=2.98
6. Now, you calculate the z-score for = 233 based on
Z233 = -2.35
Finally, you calculate the probability that the sample mean will
be less than or equal
to 233 yards if the actual sampling distribution mean equals 240
yards. Using Ztable
This probability is shown graphically in the shaded region
(usually, the cutoff probability is .05, any probability below .05
will suggest that the probability of the sampled mean is quite
different from the assumed population mean). Hence, there is
not enough support for the claim my average drive of a golf ball
is 240 in length.
Confidence interval
A confidence level is defined as the probability that the interval
estimate will include the population parameter of interest, such
as a mean or a proportion.
Upper confidence limit (UCL) and a lower confidence limit
(LCL)
Margin of Error
x
mm
7. =
x
n
s
s
=
Basic Statistics
Measures of Central Tendency
1. A company has four locations at which customers were
surveyed about their satisfaction levels. The following table
shows the average customer rating for each of the four locations
along with the number of customers at each location who
responded. Calculate the average customer rating for the entire
company.
2. The following table shows the number of wins each season
for the Green Bay Packers from 2003–2009. Determine the
variance and standard deviation for these data.
3. Question to think: what’s probability of -2.54 Z 2.54, or
Prob (-2.54 Z 2.54)?
4. The average U.S. monthly cable bill in 2009 was $75,
according to Centris, a marketing research firm. Assume
monthly cable bills follow a normal distribution with a standard
deviation of $9.50.
a) What is the probability that a randomly selected bill will be
1) less than $70?
2) less than $80?
3) exactly $75?
8. 4) between $65 and $85?
5. According to the Kaiser Family Foundation, children ranging
from ages 8 to 18 averaged 7.5 hours per day using electronic
media in 2009 (up from 6 hours in 1999). Assume the
population standard deviation is 2.4 hours per day. A random
sample of 30 children from this age group was selected, with a
sample average of 8.8 hours of electronic media use per day.
a) Is there support for this claim using the criteria that were
previously discussed?
6. According to ESPN, the average weight of a National
Football League (NFL) player in 2009 is 252.8 pounds. Assume
the population standard deviation is 25 pounds. A random
sample of 38 NFL players was selected.
a) Calculate the standard error of the mean.
b) What is the probability that the sample mean will be less than
246 pounds?
7. Banking fees have received much attention during the recent
economic recession as banks look for ways to recover from the
crisis. A sample of 30 customers paid an average fee of $12.55
per month on their interest-bearing checking accounts. Assume
the population standard deviation is $1.75.
a) Construct a 95% confidence interval to estimate the average
fee for the population.
b) What is the margin of error for this interval?